SmarterEd

Aussie Maths & Science Teachers: Save your time with SmarterEd

  • Login
  • Get Help
  • About

Probability, STD2 S2 2015 HSC 16 MC

The probability of winning a game is `7/10`.

Which expression represents the probability of winning two consecutive games?

  1. `7/10 xx 6/9`
  2. `7/10 xx 6/10`
  3. `7/10 xx 7/9`
  4. `7/10 xx 7/10`
Show Answers Only

`D`

Show Worked Solution

`text{Since the two events are independent:}`

`P text{(W)}` `= 7/10`
`P text{(WW)}` `= 7/10 xx 7/10`

 
`=>D`

Filed Under: Multi-stage Events, Multi-Stage Events, Multi-Stage Events (Std 2), Single and Multi-Stage Events (Std 1) Tagged With: Band 4, num-title-ct-corea, num-title-qs-hsc, smc-1135-20-Other Multi-Stage Events, smc-4238-20-Independent events, smc-829-20-Other Multi-Stage Events

Measurement, STD2 M1 2015 HSC 12 MC

The length of a fish was measured to be 49 cm, correct to the nearest cm.

What is the percentage error in this measurement, correct to one significant figure?

  1. 0.01%
  2. 0.5%
  3. 1%
  4. 2%
Show Answers Only

`C`

Show Worked Solution
♦ Mean mark 41%.

`text{Absolute error}\ =1/2 xx text{precision}\ = 1/2 xx 1 = 0.5\ text{cm}`

`text{% error}` `=\ frac{text{absolute error}}{text{measurement}} xx 100%`  
  `=0.5/49 xx 100%`  
  `=1.020… %`  
  `=1%\ \ text{(to 1 sig fig)}`  

 
`=>C`

Filed Under: Numbers of Any Magnitude, Simpson's Rule/Measurement Error, Units and Measurement Error (Std 1), Units and Measurement Error (Std 2) Tagged With: Band 5, num-title-ct-corea, num-title-qs-hsc, smc-1120-10-Measurement Error, smc-4232-10-Measurement error, smc-4232-50-Significant figures, smc-797-10-Measurement Error

Measurement, STD2 M6 2015 HSC 9 MC

From the top of a cliff 67 metres above sea level, the angle of depression of a buoy is 42°.


How far is the buoy from the base of the cliff, to the nearest metre?

  1. `60\ text(m)`
  2. `74\ text(m)`
  3. `90\ text(m)`
  4. `100\ text(m)`
Show Answers Only

`B`

Show Worked Solution
♦ Mean mark 49%.
COMMENT: The angle of depression is a regularly examined concept. Make sure you know exactly what it refers to.

`text(Let)\ x\ text(= distance of buoy from cliff base)`

`tan\ 42^@` `= 67/x`
`x\ tan\ 42^@` `= 67`
`x` `= 67/(tan\ 42^@)`
  `= 74.41…\ text(m)`

`⇒ B`

Filed Under: 2-Triangle and Harder Examples, M3 Right-Angled Triangles (Y12), Pythagoras and Right-Angled Trig (Std2), Right-Angled Trig Tagged With: Band 5, num-title-ct-coreb, num-title-qs-hsc, smc-1103-20-Right-angled Trig, smc-1103-30-Angle of Depression, smc-4552-40-Real world applications, smc-4552-50-Angle of depression, smc-802-20-Right-Angled Trig, smc-802-30-Angle of Depression

Measurement, STD2 M1 2015 HSC 8 MC

The Louvre Pyramid in Paris has a square base with side length 35 m and a perpendicular height of 22 m.
 

What is the volume of this pyramid, to the nearest m³?

  1. `257\ text(m)^3`
  2. `1027\ text(m)^3`
  3. `8983\ text(m)^3`
  4. `26\ 950\ text(m)^3`
Show Answers Only

`C`

Show Worked Solution
`V` `= 1/3Ah`
`A` `= 35 xx 35`
  `= 1225\ text(m)^2`


`:.V` `= 1/3 xx 1225 xx 22`
  `= 8983.33…\ text(m)^3`

 
`=>C`

Filed Under: Areas and Volumes (Harder), Perimeter, Area and Volume (Std 2), Perimeter, Area and Volume (Std2-2027), Volume Tagged With: Band 4, num-title-ct-pathb, num-title-qs-hsc, smc-4235-50-Pyramids/Cones, smc-6304-40-Volume, smc-798-40-Volume

Statistics, STD2 S1 2015 HSC 6 MC

The times, in minutes, that a large group of students spend on exercise per day are presented in the box‑and‑whisker plot.
 

What percentage of these students spend between 40 minutes and 60 minutes per day on exercise?

  1. 17%
  2. 20%
  3. 25%
  4. 50%
Show Answers Only

`C`

Show Worked Solution

`text{Q}_1 = 40, \ text(Median) = 60`

`:.\ text(% Students between 40 and 60)`

`= 50text{%}-25text{%}`

`=25 text{%}`
 

`=>C`

Filed Under: Box Plots and 5-Number Summary, Stem & Leaf, Box & Whisker, Summary Statistics - Box Plots (Std 2), Summary Statistics - Box Plots (Std2-2027), Summary Statistics - Box Plots (Y12), Summary Statistics (Std 1) Tagged With: Band 4, common-content, num-title-ct-corea, num-title-qs-hsc, smc-1000-10-Single Box-Plots, smc-5021-50-Box plot (single), smc-6313-10-Single Box Plots, smc-825-10-Single Box-Plots

Statistics, STD2 S1 2015 HSC 4 MC

On a school report, a student’s record of completing homework is graded using the following codes.

C = consistently
U = usually
S = sometimes
R = rarely
N = never

What type of data is this?

  1. Categorical, ordinal
  2. Categorical, nominal
  3. Numerical, continuous
  4. Numerical, discrete
Show Answers Only

`A`

Show Worked Solution

`text(The data has been grouped into categories and)`

`text(because each category can be ranked, it is ordinal.)`

`⇒ A`

Filed Under: Classifying Data, Classifying Data (Std 1), Classifying Data (Std 2), Classifying Data (Y12), Data Classification, Investigation and Sampling Methods (Std2-2027), DS1 - Stats and society Tagged With: Band 4, common-content, num-title-ct-core, num-title-qs-hsc, smc-1127-20-Classifying Data, smc-5075-10-Categorical, smc-6309-20-Data Classification, smc-820-20-Classifying Data

Algebra, STD2 A1 2015 HSC 2 MC

Which of the following is  `4x + 3y-x-5y`  in its simplest form?

  1. `3x - 2y`
  2. `3x + 8y`
  3. `5x - 2y`
  4. `5x + 8y`
Show Answers Only

`A`

Show Worked Solution

`4x + 3y-x-5y`

`= 3x-2y`

`⇒ A`

Filed Under: AM1 - Algebra (Prelim), Distributive Laws, Substitution and Other Equations (Std 1), Substitution and Other Equations (Std 2), Substitution and Other Equations (Std2-2027) Tagged With: Band 3, num-title-ct-corea, num-title-qs-hsc, smc-1116-50-Other Equations, smc-6234-50-Other Equations, smc-789-50-Other Equations

Measurement, STD2 M1 2015 HSC 1 MC

What is  1 560 200 km written in standard form correct to two significant figures?

  1. `1.56 × 10^4 \ text(km)`
  2. `1.6 × 10^5 \ text(km)`
  3. `1.56 × 10^6 \ text(km)`
  4. `1.6 × 10^6 \ text(km)`
Show Answers Only

`D`

Show Worked Solution

♦♦ Mean mark 30%.
COMMENT: Incredibly, the first MC question in 2015 had the lowest mean mark of all MC questions in the exam!

`1\ 560\ 200`

`= 1.5602 xx 10^6`

`= 1.6 xx 10^6\ text(km)\ \ \ text{(2 sig fig)}`

 
`=> D`

Filed Under: Identify and Convert Between Units (Std2-2027), MM1 - Units of Measurement, Numbers of Any Magnitude, Units and Measurement Error (Std 1), Units and Measurement Error (Std 2) Tagged With: Band 5, num-title-ct-corea, num-title-qs-hsc, smc-1120-20-Scientific Notation, smc-1120-30-Significant Figures, smc-4232-30-Scientific notation, smc-4232-50-Significant figures, smc-6303-40-Scientific Notation, smc-6303-50-Significant Figures, smc-797-20-Scientific Notation, smc-797-30-Significant Figures

Plane Geometry, 2UA 2004 HSC 2b

In the diagram, `ABC`  is an isosceles triangle with  `AB = AC`  and  `/_BAC = 38^@`. The line `BC` is produced to `D`. 

Find the size of `/_ACD`. Give reasons for your answer.   (2 marks)

--- 4 WORK AREA LINES (style=lined) ---

Show Answers Only

`109^@`

Show Worked Solution

Plane Geometry, 2UA 2004 HSC 2b Answer

`/_ABC` `= 1/2 (180-38)\ \ \ text{(base angle of isosceles}\ Delta ABC text{)}`
  `= 71^@`


`:.\ /_ACD` `= 71 + 38\ \ \ text{(exterior angle of}\ Delta ABC text{)}`
  `= 109^@`

Filed Under: 2. Plane Geometry, Special Properties Tagged With: Band 3, num-title-ct-pathc, num-title-qs-hsc, smc-4748-10-Triangle properties

Functions, 2ADV F1 2006 HSC 1e

Solve  `3-5x <= 2`.  (2 marks)

Show Answers Only

`x >= 1/5`

Show Worked Solution
`3-5x` `<= 2`
`-5x` `<= -1`
`x` `>= 1/5`

Filed Under: Further Functions and Relations (Y11), Inequalities, Inequalities and Absolute Values, Linear Functions (Adv-2027) Tagged With: Band 3, num-title-ct-pathb, num-title-qs-hsc, smc-4385-10-Linear, smc-6214-08-Inequalities, smc-987-20-Inequalities

Functions, 2ADV F1 2006 HSC 1b

Factorise  `2x^2 + 5x-3`.  (2 marks)

Show Answers Only

`(2x-1) (x + 3)`

Show Worked Solution

`2x^2 + 5x-3= (2x-1) (x + 3)`

Filed Under: Distributive Laws, Factors and Other Equations, Quadratics and Cubic Functions (Adv-2027), Quadratics and Cubic Functions (Y11) Tagged With: Band 2, num-title-ct-pathc, num-title-qs-hsc, smc-4357-50-Factorise, smc-6215-10-Quadratics, smc-6215-40-Factorise, smc-984-10-Quadratics

Probability, STD2 S2 2006 HSC 26c

A new test has been developed for determining whether or not people are carriers of the Gaussian virus.

Two hundred people are tested. A two-way table is being used to record the results.
 

  1.  What is the value of  `A`?  (1 mark)

    --- 1 WORK AREA LINES (style=lined) ---

  2.  A person selected from the tested group is a carrier of the virus.


     What is the probability that the test results would show this?  (2 marks) 

    --- 4 WORK AREA LINES (style=lined) ---

  3.  For how many of the people tested were their test results inaccurate?  (1 mark)

    --- 2 WORK AREA LINES (style=lined) ---

Show Answers Only
  1. `98`
  2. `37/43`
  3. `28`
Show Worked Solution
i.  `A` `= 200-(74 + 12 + 16)`
  `= 98`


ii.  `P` `= text(# Positive carriers)/text(Total carriers)`
  `= 74/86`
  `= 37/43`


iii.  `text(# People with inaccurate results)`

`= 12 + 16`

`= 28`

Filed Under: Relative Frequency, Relative Frequency (Std 1), Relative Frequency (Std 2), Relative Frequency (Y11), Relative Frequency and Venn Diagrams Tagged With: Band 3, Band 4, common-content, num-title-ct-pathb, num-title-qs-hsc, smc-1133-10-Surveys/Two-Way Tables, smc-4815-10-2-Way tables, smc-827-10-Surveys/Two-Way Tables, smc-990-10-Surveys/Two-Way Tables

Plane Geometry, 2UA 2005 HSC 5b

The diagram shows a parallelogram `ABCD` with `∠DAB = 120^@`. The side `DC` is produced to `E` so that `AD = BE`.

Prove that `ΔBCE` is equilateral.  (3 marks)

--- 6 WORK AREA LINES (style=lined) ---

Show Answers Only

`text(See Worked Solutions)`

Show Worked Solution

`BC` `= AD\ text{(opposite sides of parallelogram}\ ABCD)`
`∠BCD` `= 120^@\ text{(opposite angles of parallelogram}\ ABCD)`
`∠BCE` `= 60^@\ (∠DCE\ text{is a straight angle)}`
`∠CEB` `= 60^@\ text{(base angles of isosceles}\ \Delta BCE)`
`∠CBE` `= 60^@\ text{(angle sum of}\ ΔBCE)`

 
`:.ΔBCE\ text(is equilateral)`

Filed Under: 2. Plane Geometry, Special Properties Tagged With: Band 4, num-title-ct-pathc, num-title-qs-hsc, smc-4748-10-Triangle properties, smc-4748-20-Quadrilateral properties

L&E, 2ADV E1 2005 HSC 5a

Use the change of base formula to evaluate  `log_3 7`, correct to two decimal places.  (1 mark)

Show Answers Only

`1.77\ \ text{(to 2 d.p.)}`

Show Worked Solution
`log_3 7` `= (log_10 7)/(log_10 3)`
  `= 1.771…`
  `= 1.77\ \ text{(to 2 d.p.)}`

Filed Under: Log/Index Laws and Equations (Adv-2027), Log/Index Laws and Equations (Y11), Log/Index laws and Other Equations, Logarithms Tagged With: Band 3, num-title-ct-patha, num-title-qs-hsc, smc-4243-50-Change of base, smc-6455-30-Logs - COB Rule, smc-963-30-Log - COB rule

Functions, 2ADV F1 2005 HSC 1d

Express  `((2x-3))/2-((x-1))/5`  as a single fraction in its simplest form.  (2 marks)

--- 5 WORK AREA LINES (style=lined) ---

Show Answers Only

`(8x-13)/10`

Show Worked Solution

`((2x-3))/2-((x-1))/5`

`= (5(2x-3)-2(x-1))/10`

`= (10x-15-2x + 2)/10`

`= (8x-13)/10`

Filed Under: Algebraic Fractions, Algebraic Techniques (Adv-2027), Algebraic Techniques (Y11), Factors and Other Equations Tagged With: Band 3, common-content, num-title-ct-pathc, num-title-qs-hsc, smc-4356-10-Addition, smc-6213-10-Algebraic Fractions, smc-983-40-Algebraic Fractions

Financial Maths, STD2 F4 2005 HSC 26a

A sports car worth $150 000 is bought in December 2005.

In December each year, beginning in 2006, the value of the sports car is depreciated by 10% using the declining balance method of depreciation.

In which year will the depreciated value first fall below $120 000?   (2 marks)

--- 5 WORK AREA LINES (style=lined) ---

Show Answers Only

`text(The value falls below $120 000 in the third year)`

`text{which will be during 2008.}`

Show Worked Solution

`text(Using)\ \ S = V_0(1-r)^n`

`text(where)\ \ V_0 = 150\ 000, r = text(10%)`

`text(If)\ \ n = 2,`

`S` `= 150\ 000(1-0.1)^2`
  `= 121\ 500`

 
`text(If)\ \ n= 3,`

`S` `= 150\ 000(1-0.1)^3`
  `= 109\ 350`


`:.\ text(The value falls below $120 000 in the third year)`

`text{which will be during 2008.}`

Filed Under: Depreciation, Depreciation - Declining Balance (Std 1), Depreciation - Declining Balance (Std 2), Depreciation / Running costs Tagged With: Band 4, num-title-ct-coreb, num-title-qs-hsc, smc-1139-10-Find S, smc-1139-40-Find n, smc-4335-30-Find n, smc-813-10-Find S, smc-813-40-Find n

Measurement, STD2 M6 2006 HSC 24b

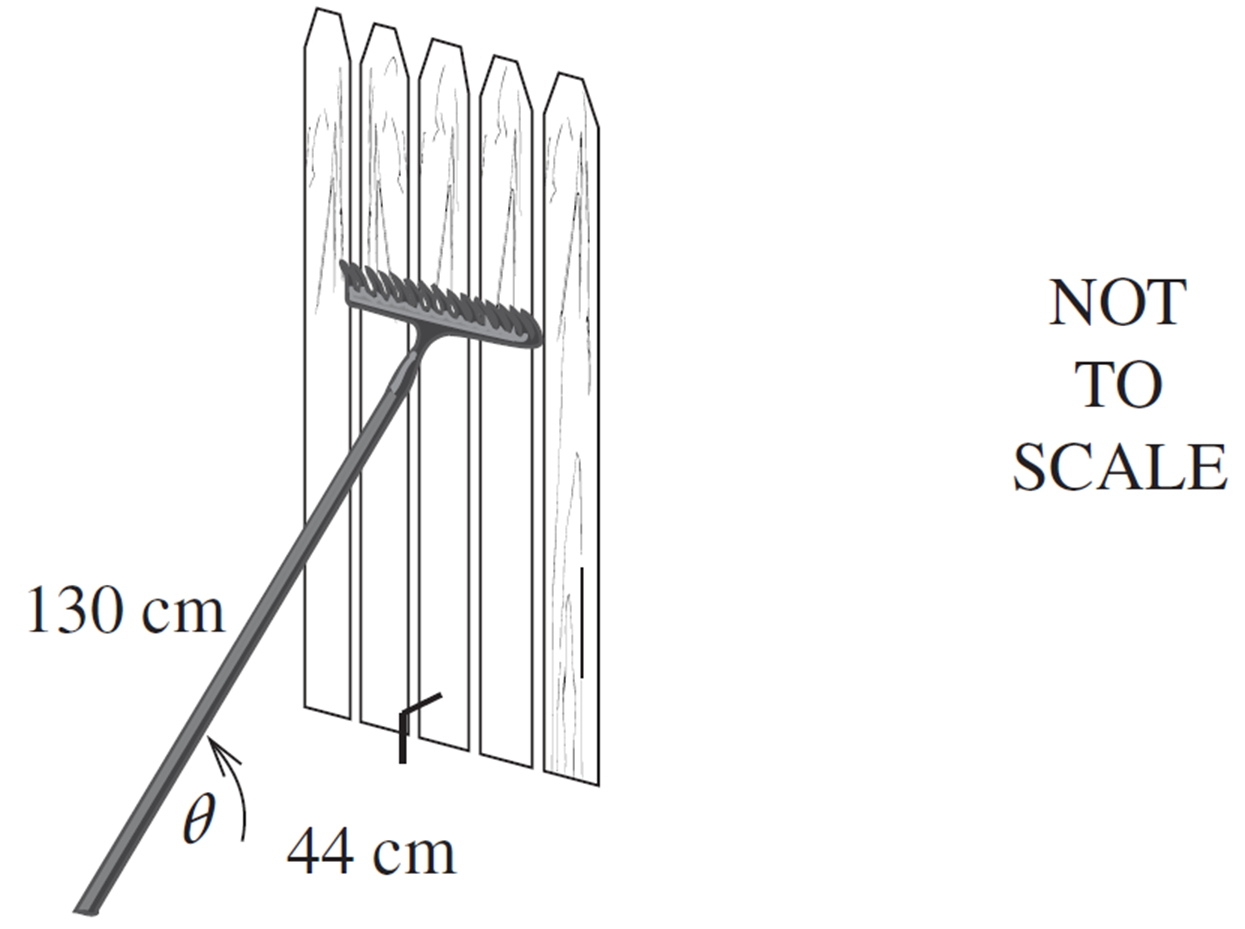
A 130 cm long garden rake leans against a fence. The end of the rake is 44 cm from the base of the fence.

  1. If the fence is vertical, find the value of `theta` to the nearest degree.  (2 marks)
      
          2UG-2006-24b-i

    --- 4 WORK AREA LINES (style=lined) ---


  2. The fence develops a lean and the rake is now at an angle of 53° to the ground. Calculate the new distance (`x` cm) from the base of the fence to the head of the rake. Give your answer to the nearest centimetre.  (2 marks)
     
          2UG-2006-24b-ii

    --- 4 WORK AREA LINES (style=lined) ---

Show Answers Only
  1. `text{70°  (nearest degree)}`
  2. `text{109 cm  (nearest cm)}`
Show Worked Solution
i.   

2UG-2006-24b1 Answer

`cos theta` `= 44/130`
  `= 70.216… ^@`
  `= 70^@\ \ \ text{(nearest degree)}`


ii.   

2UG-2006-24b2 Answer

`text(Using cosine rule)`

`x^2` `= 130^2 + 44^2-2 xx 130 xx 44 xx cos 53^@`
  `= 11\ 951.23…`
`x` `= 109.32…`
  `= 109\ text{cm  (nearest cm)}`

Filed Under: Non Right-Angled Trig, Non-Right Angled Trig, Non-Right Angled Trig (Std2), Pythagoras and basic trigonometry Tagged With: Band 4, Band 5, num-title-ct-pathc, num-title-qs-hsc, smc-4553-10-Cosine Rule, smc-804-10-Cosine Rule, smc-804-40-2-Triangle

Statistics, STD2 S1 2006 HSC 24a

2UG-2006-24a

List TWO ways in which this graph is misleading.  (2 marks)

--- 4 WORK AREA LINES (style=lined) ---

Show Answers Only

`text(Reasons the graph is misleading include)`

`text(- the columns are a different widths/volumes)`

`text(- the vertical axis doesn’t start at zero)`

Show Worked Solution

`text(Reasons the graph is misleading include)`

`text(- the columns are a different widths/volumes)`

`text(- the vertical axis doesn’t start at zero)`

Filed Under: Bar Charts and Histograms, Bar Charts and Histograms (Std 2), Bar Charts and Histograms (Std2-2027), Bar Charts and Histograms (Y12), Bar Charts, Histograms and Other Graphs (Std 1), Interpreting Data Tagged With: Band 4, common-content, num-title-ct-core, num-title-qs-hsc, smc-1128-10-Bar Charts, smc-5077-10-Misleading graphs, smc-6310-10-Bar Charts, smc-821-10-Bar Charts, smc-997-10-Bar Charts

Algebra, 2UG 2006 HSC 23a

Simplify  `(ab^2)/w xx (4w)/(3b).`  (2 marks)

Show Answers Only

`(4ab)/3`

Show Worked Solution
`(ab^2)/w xx (4w)/(3b)` `=(4ab^2w)/(3bw)`  
  `=(4ab)/3`  

Filed Under: Index and Log Laws, Indices Tagged With: Band 4, num-title-ct-pathb, num-title-qs-hsc, smc-4228-10-Positive integers

Statistics, STD2 S1 2005 HSC 24d

The sector graph shows the proportion of people, as a percentage, living in each region of Sumcity. There are 24 000 people living in the Eastern Suburbs.
 

2UG-2005-24d1
 

  1. Show that the total number of people living in Sumcity is  160 000.  (1 mark)

    --- 1 WORK AREA LINES (style=lined) ---

Jake used the information above to draw a column graph.
 

2UG-2005-24d2

  1. The column graph height is incorrect for one region.


    Identify this region and justify your answer.   (2 marks)

    --- 4 WORK AREA LINES (style=lined) ---

Show Answers Only
  1. `160\ 000`
  2. `text(Western Suburbs population)`
Show Worked Solution

i.   `text(Let the population of Sumcity =)\ P`

`text(15%)× P` `= 24\ 000`
`:.P`  `= (24\ 000)/0.15` 
  `= 160\ 000\ …\ text(as required)` 


ii.  `text(Western Suburbs population)`

`= text(10%) × 160\ 000`

`= 16\ 000`

`text(The column graph has this population as)`

`text(12 000 people which is incorrect.)`

Filed Under: Bar Charts and Histograms, Bar Charts and Histograms (Std 2), Bar Charts and Histograms (Std2-2027), Bar Charts and Histograms (Y12), Bar Charts, Histograms and Other Graphs (Std 1), Displaying Data, Other Chart Types (Y12), Other Charts (Std 2), Other Charts (Std2-2027), Other Graphs Tagged With: Band 4, common-content, num-title-ct-core, num-title-qs-hsc, smc-1128-10-Bar Charts, smc-5076-15-Sector graphs and Divided Bar graphs, smc-5077-10-Misleading graphs, smc-6310-10-Bar Charts, smc-6311-30-Other Charts, smc-821-10-Bar Charts, smc-822-40-Other Charts, smc-997-10-Bar Charts, smc-998-40-Other Charts

Algebra, STD2 A1 2005 HSC 24c

Make  `L`  the subject of the equation  `T = 2piL^2`.   (2 marks)

--- 4 WORK AREA LINES (style=lined) ---

Show Answers Only

`± sqrt(T/(2pi))`

Show Worked Solution
`T` `= 2piL^2`
`L^2` `= T/(2pi)`
`:.L` `= ±sqrt(T/(2pi))`

Filed Under: Formula Rearrange, Formula Rearrange (Std 1), Formula Rearrange (Std 2), Formula Rearrange (Std2-2027), Index and Log Laws, Quadratics and Cubics Tagged With: Band 5, num-title-ct-pathc, num-title-qs-hsc, smc-1200-20-Non-Linear, smc-1201-20-Non-Linear, smc-4386-10-Rearrange equation, smc-4386-30-Quadratics (Monic), smc-6236-20-Non-Linear

Statistics, STD2 S1 2005 HSC 24a

  1. Draw a stem-and-leaf plot for the following set of scores.
  2.  


    `21\ \ \ 45\ \ \ 29\ \ \ 27\ \ \ 19\ \ \ 35\ \ \ 23\ \ \ 58\ \ \ 34\ \ \ 27`  (2 marks)

    --- 6 WORK AREA LINES (style=blank) ---

  3. What is the median of the set of scores?   (1 mark)

    --- 2 WORK AREA LINES (style=lined) ---

  4. Comment on the skewness of the set of scores.   (1 mark)

    --- 2 WORK AREA LINES (style=lined) ---

Show Answers Only
  1.  
  2. `28`
  3. `text(The data has a tail that stretches to the right)`
  4.  

    `:.\ text(Data is positively Skewed.)`

Show Worked Solution
i.    HSC 2005 24a


ii.  `text(10 scores)`

`:.\ text(Median)` `= text{(5th + 6th)}/2`
  `= (27 + 29)/2`
  `= 28`


iii.  `text(The data has a tail that stretches to the right)`

`:.\ text(Data is positively skewed.)`

Filed Under: Bar Charts, Histograms and Other Graphs (Std 1), Displaying Data, Other Chart Types (Y12), Other Charts (Std 2), Other Charts (Std2-2027), Stem & Leaf, Box & Whisker Tagged With: Band 4, Band 5, common-content, num-title-ct-core, num-title-qs-hsc, smc-1128-24-Stem and Leaf, smc-5076-20-Stem and Leaf, smc-6311-10-Stem-and-Leaf, smc-822-20-Stem and Leaf, smc-998-20-Stem and Leaf

Financial Maths, STD2 F1 2004 HSC 27b

David is paid at these rates:


His time sheet for last week is:
  

  1. Calculate David’s gross pay for last week.  (3 marks)

    --- 6 WORK AREA LINES (style=lined) ---

  2. David decides not to work on Saturdays. He wants to keep his weekly gross pay the same. How many extra hours at the weekday rate must he work?  (1 mark)

    --- 2 WORK AREA LINES (style=lined) ---

Show Answers Only
  1. `$414.00`
  2. `text(9 extra hours)`
Show Worked Solution
i.   `text{Pay (Fri)}` `= text(4 hours) xx 18.00`
  `= $72.00`
`text{Pay (Sat)}` `= 6\ text(hours) xx 1.5 xx 18.00`
  `= $162.00`
`text{Pay (Sun)}` `= 5\ text(hours) xx 2 xx 18.00`
  `= $180.00`


`:.\ text(Gross pay)` `= 72 + 162 + 180`
  `= $414.00`


 ii.  `text(Pay on Sat) = $162.00`

`text(Weekly equivalent hours)`

`= 162/18`

`= 9\ text(hours)`

`:.\ text(He will have to work 9 extra hours on)`

`text(a weekday for the same gross pay)`


Filed Under: Earning and Spending Money, Earning Money and Budgeting (Std 1), Earning Money and Budgeting (Std 2), FM1 - Earning money, Ways of Earning (Std2-2027) Tagged With: Band 4, Band 5, num-title-ct-corea, num-title-qs-hsc, smc-1126-10-Wages, smc-4331-10-Wages, smc-6276-10-Wages/Salaries, smc-810-10-Wages

Financial Maths, STD2 F1 2006 HSC 22 MC

This income tax table is used to calculate Evelyn’s tax payable.
 

Evelyn’s taxable income increases from $50 000 to $80 000.

What percentage of her increase will she pay in additional tax?

  1. `text(15.25%)`
  2. `text(40.7%)`
  3. `text(43.5%)`
  4. `text(52%)`
Show Answers Only

`B`

Show Worked Solution
`text(Tax on $50 000)` `= 2500 + 0.35 xx (50\ 000-45\ 000)`
  `= 2500 + 1750`
  `= $4250`
`text(Tax on $80 000)` `= 11\ 250 + 0.52 xx (80\ 000-70\ 000)`
  `= 11\ 250 + 5200`
  `= $16\ 450`
`:.\ text(Extra tax)` `= 16\ 450-4250`
  `= $12\ 200`


`:.\ text(% Increase paid in tax)`

`= (12\ 200) / (30\ 000) xx 100`

`=\ text(40.66… %)`
 

`=>  B`

Filed Under: Earning and Spending Money, FM3 - Taxation, Tax and Percentage Increase/Decrease (Std 2), Taxation (Std2-2027) Tagged With: Band 6, num-title-ct-corea, num-title-qs-hsc, smc-4331-50-Tax tables, smc-6277-10-Tax Tables, smc-831-10-Tax Tables

Measurement, STD2 M1 2005 HSC 23b

A clay brick is made in the shape of a rectangular prism with dimensions as shown.
 

  1. Calculate the volume of the clay brick.  (1 mark)

    --- 2 WORK AREA LINES (style=lined) ---

Three identical cylindrical holes are made through the brick as shown. Each hole has a radius of 1.4 cm.  
 

  1. What is the volume of clay remaining in the brick after the holes have been made? (Give your answer to the nearest cubic centimetre.)  (3 marks)

    --- 6 WORK AREA LINES (style=lined) ---

  2. What percentage of clay is removed by making the holes through the brick? (Give your answer correct to one decimal place.)  (1 mark)

    --- 2 WORK AREA LINES (style=lined) ---

Show Answers Only
  1. `text(1512 cm)^3`
  2. `text{1364 cm}^3`
  3. `text{9.8%}`
Show Worked Solution
i.    `V` `= l × b × h`
    `= 21 × 8 × 9`
    `= 1512\ text(cm)^3`


ii.  `text(Volume of each hole)`

`= pir^2h`

`= pi × 1.4^2 × 8`

`= 49.260…\ text(cm)^3`


`:.\ text(Volume of clay still in brick)`

`= 1512 − (3 × 49.260…)`

`= 1364.219…`

`= 1364\ text{cm}^3\ text{(nearest whole)}`


iii. `text(Percentage of clay removed)`

`= ((3 × 49.260…))/1512 × 100`

`= 9.773…`

`= 9.8 text{%   (1 d.p.)}`

Filed Under: Areas and Volumes (Harder), Perimeter, Area and Volume (Std 2), Perimeter, Area and Volume (Std2-2027), Volume Tagged With: Band 3, Band 4, Band 5, num-title-ct-corea, num-title-qs-hsc, smc-4235-10-Prisms, smc-4235-20-Cylinders, smc-6304-50-Volume (Circular Measure), smc-798-50-Volume (Circular Measure)

Statistics, STD2 S1 2005 HSC 22 MC

Two groups of people were surveyed about their weekly wages. The results are shown in the box-and-whisker plots.
 

Which of the following statements is true for the people surveyed?

  1. The same percentage of people in each group earned more than $325 per week.
  2. Approximately 75% of people under 21 years earned less than $350 per week.
  3. Approximately 75% of people 21 years and older earned more than $350 per week.
  4. Approximately 50% of people in each group earned between $325 and $350 per week.
Show Answers Only

`B`

Show Worked Solution

`text{Option A: 50% of Under 21 group earned over $325 and 75%}`

`text{of Over 21 group did. NOT TRUE.}`
 

`text{Option B: 75% of Under 21 group earned below $350 is TRUE.}`
 

`text{Options C and D: can both be proven to be untrue using their}`

`text{median and quartile values.}`

`=>  B`

Filed Under: Box Plots and 5-Number Summary, Stem & Leaf, Box & Whisker, Summary Statistics - Box Plots (Std 2), Summary Statistics - Box Plots (Std2-2027), Summary Statistics - Box Plots (Y12) Tagged With: Band 6, common-content, num-title-ct-corea, num-title-qs-hsc, smc-1000-20-Parallel Box-Plots, smc-5021-60-Box plots (parallel), smc-6313-20-Parallel Box Plots, smc-825-20-Parallel Box-Plots

Algebra, STD2 A2 2005 HSC 17 MC

The total cost, `$C`, of a school excursion is given by  `C = 2n + 5`, where `n` is the number of students.

If three extra students go on the excursion, by how much does the total cost increase?

  1. `$6`
  2. `$11`
  3. `$15`
  4. `$16`
Show Answers Only

`A`

Show Worked Solution

`C = 2n + 5`

`text(If)\ n\ text(increases to)\ n + 3`

`C` `= 2(n + 3) + 5`
  `= 2n + 6 + 5`
  `= 2n + 11`


`:.\ text(Total cost increases by $6)`

`=>  A`

Filed Under: Linear and Other Equations, Linear Applications, Linear Equations and Basic Graphs (Std 1), Linear Equations and Basic Graphs (Std 2), Linear Relationships and Basic Graphs (Std2-2027) Tagged With: Band 5, num-title-ct-coreb, num-title-qs-hsc, smc-1118-40-Other problems, smc-6255-40-Other, smc-792-40-Other

Probability, STD2 S2 2005 HSC 16 MC

On a television game show, viewers voted for their favourite contestant. The results were recorded in the two-way table.

\begin{array} {|l|c|c|}
\hline
\rule{0pt}{2.5ex} \rule[-1ex]{0pt}{0pt} & \textbf{Male viewers} & \textbf{Female viewers} \\
\hline
\rule{0pt}{2.5ex}\textbf{Contestant 1}\rule[-1ex]{0pt}{0pt} & 1372 & 3915\\
\hline
\rule{0pt}{2.5ex}\textbf{Contestant 2}\rule[-1ex]{0pt}{0pt} & 2054 & 3269\\
\hline
\end{array}

One male viewer was selected at random from all of the male viewers.

What is the probability that he voted for Contestant 1?

  1. `1372/(10\ 610)`
  2. `1372/5287`
  3. `1372/3426`
  4. `1372/2054`
Show Answers Only

`C`

Show Worked Solution

`text(Total male viewers)\ = 1372 + 2054= 3426`

  
`P\ text{(Male viewer chosen voted for C1)}`

`= text(Males who voted for C1)/text(Total male viewers)`

`= 1372/3426`
 

`=>  C`

Filed Under: Relative Frequency, Relative Frequency (Std 1), Relative Frequency (Std 2), Relative Frequency (Y11), Relative Frequency and Venn Diagrams Tagged With: Band 4, common-content, num-title-ct-pathb, num-title-qs-hsc, smc-1133-10-Surveys/Two-Way Tables, smc-4815-10-2-Way tables, smc-4815-50-Conditional probability, smc-827-10-Surveys/Two-Way Tables, smc-990-10-Surveys/Two-Way Tables

Probability, STD2 S2 2005 HSC 11 MC

The diagram shows a spinner.


The arrow is spun and will stop in one of the six sections.

What is the probability that the arrow will stop in a section containing a number greater
than 4?

  1.    `2/5`
  2.    `2/3`
  3.    `1/3`
  4.    `1/2`
Show Answers Only

`D`

Show Worked Solution

`P\ text((number greater than 4))`

`= P(7) + P (9)`

`= 2/6 + 1/6`

`= 1/2`

`=>  D`

Filed Under: Combinations and Single Stage Events (Std 2), Probability, Single and Multi-Stage Events (Std 1), Single stage events Tagged With: Band 3, num-title-ct-core, num-title-qs-hsc, smc-1135-05-Simple Probability, smc-4225-15-Single-stage events, smc-828-10-Simple Probability

Probability, STD2 S2 2004 HSC 25c

Lie detector tests are not always accurate. A lie detector test was administered to 200 people.

The results were:

• 50 people lied. Of these, the test indicated that 40 had lied;
• 150 people did NOT lie. Of these, the test indicated that 20 had lied.

  1. Complete the table using the information above   (2 marks)


    --- 0 WORK AREA LINES (style=lined) ---

  2. For how many of the people tested was the lie detector test accurate?   (1 mark)

    --- 2 WORK AREA LINES (style=lined) ---

  3. For what percentage of the people tested was the test accurate?   (1 mark)

    --- 2 WORK AREA LINES (style=lined) ---

  4. What is the probability that the test indicated a lie for a person who did NOT lie?   (1 mark)

    --- 2 WORK AREA LINES (style=lined) ---

Show Answers Only
  1. `text(See Worked Solutions)`
  2. `170`
  3. `text(85%)`
  4. `2/15`
Show Worked Solution

i.

ii.  `text(# Accurate readings)`

`= 40 + 130`

`= 170`
 

iii.  `text(Percentage of people with accurate readings)`

`= text(# Accurate readings)/text(Total readings) xx 100`

`= 170/200`

`= 85 text(%)`
 

iv.  `text{P(lie detected when NOT a lie)}`

`= 20/150`

`= 2/15`

Filed Under: Relative Frequency, Relative Frequency (Std 1), Relative Frequency (Std 2), Relative Frequency (Y11), Relative Frequency and Venn Diagrams Tagged With: Band 4, Band 5, common-content, num-title-ct-pathb, num-title-qs-hsc, smc-1133-10-Surveys/Two-Way Tables, smc-4815-10-2-Way tables, smc-827-10-Surveys/Two-Way Tables, smc-990-10-Surveys/Two-Way Tables

Statistics, STD2 S1 2006 HSC 12 MC

The mean of a set of 5 scores is 62.

What is the new mean of the set of scores after a score of 14 is added?

  1.   38
  2.   54
  3.   62
  4.   76
Show Answers Only

`B`

Show Worked Solution

`text(Mean of 5 scores) = 62`

`:.\ text(Total of 5 scores) = 62 xx 5 = 310`

`text(Add a score of 14)`

`text(Total of 6 scores) = 310 + 14 = 324`

`:.\ text(New mean)` `= 324/6`
  `= 54`

`=>  B`

Filed Under: Data Analysis, Measures of Centre and Spread (Std2-2027), Summary Statistics - No Graph (Std 2), Summary Statistics - No graph (Y12), Summary Statistics (no graph), Summary Statistics (Std 1) Tagged With: Band 4, common-content, num-title-ct-core, num-title-qs-hsc, smc-1131-10-Mean, smc-4224-25-Mean, smc-4224-50-Add/remove data, smc-6312-10-Mean, smc-824-10-Mean, smc-999-10-Mean

Probability, STD2 S2 2006 HSC 10 MC

Kay randomly selected a marble from a bag of marbles, recorded its colour and returned it to the bag. She repeated this process a number of times.


Based on these results, what is the best estimate of the probability that Kay will choose a green marble on her next selection?

  1.   `5/24`
  2.   `1/24`
  3.   `1/6`
  4.   `1/5`
Show Answers Only

`C`

Show Worked Solution
`text{P(Green)}` `= text(# Green chosen) / text(Total Selections)`
  `= 4/24`
  `= 1/6`

`=>  C`

Filed Under: Multi-stage Events, Multi-Stage Events (Std 2), Probability, Single and Multi-Stage Events (Std 1) Tagged With: Band 4, num-title-ct-core, num-title-qs-hsc, smc-1135-20-Other Multi-Stage Events, smc-4225-35-Relative frequency, smc-829-20-Other Multi-Stage Events

Measurement, STD2 M6 2006 HSC 9 MC

What is the area of this triangle, to the nearest square metre?


  1. `text(152 m²)`
  2. `text(283 m²)`
  3. `text(328 m²)`
  4. `text(351 m²)`
Show Answers Only

`C`

Show Worked Solution

`text(Using the Sine rule)`

`A` `= 1/2 ab\ sin C`
  `= 1/2 xx 39 xx 47 xx sin 21^@`
  `=\ text(328.44… m²)`

 
`=>  C`

Filed Under: Non Right-Angled Trig, Non-Right Angled Trig, Non-Right Angled Trig (Std2) Tagged With: Band 3, num-title-ct-pathc, num-title-qs-hsc, smc-804-30-Sine Rule (Area)

Functions, 2ADV F1 2004 HSC 1d

 Find integers  `a`  and  `b`  by showing working to expand and simplify 

`(3-sqrt2)^2 = a-b sqrt2`.  (2 marks)

--- 4 WORK AREA LINES (style=lined) ---

Show Answers Only

`a = 11,\ b = 6`

Show Worked Solution
`(3-sqrt2)^2` `= 9-6 sqrt2 + (sqrt2)^2`
  `= 9-6 sqrt2 + 2`
  `= 11-6 sqrt2`
   
`:.\ a = 11, \ \ b = 6`

Filed Under: Algebraic Techniques (Adv-2027), Algebraic Techniques (Y11), Factors and Other Equations, Indices, Surds and Rounding Tagged With: Band 4, num-title-ct-pathc, num-title-qs-hsc, smc-4228-70-Surds, smc-6213-20-Surds (general), smc-983-20-Surds (General)

Functions, 2ADV F1 2004 HSC 1c

Solve   `(x-5)/3-(x+1)/4 = 5`.   (2 marks)

Show Answers Only

`83`

Show Worked Solution
`(x-5)/3-(x+1)/4` `= 5`
`12((x-5)/3)-12((x+1)/4)` `= 12 xx 5`
`4x-20-3x-3` `= 60`
`x-23` `= 60`
`:. x` `= 83`

Filed Under: Algebraic Fractions, Algebraic Techniques (Adv-2027), Algebraic Techniques (Y11), Factors and Other Equations Tagged With: Band 3, common-content, num-title-ct-pathc, num-title-qs-hsc, smc-4402-40-Multiple fractions, smc-6213-10-Algebraic Fractions, smc-983-40-Algebraic Fractions

Probability, STD2 S2 2006 HSC 6 MC

Marcella is planning to roll a standard six-sided die 60 times.

How many times would she expect to roll the number 4?

  1.   6
  2.   10
  3.   15
  4.   20
Show Answers Only

`B`

Show Worked Solution

`P(4) = 1/6`

`:.\ text(Expected times to roll 4)`

`= 1/6 xx text(number of rolls)`

`= 1/6 xx 60`

`= 10`

`=>  B`

Filed Under: Probability, Relative Frequency, Relative Frequency (Std 1), Relative Frequency (Std 2), Relative Frequency (Y11) Tagged With: Band 4, common-content, num-title-ct-core, num-title-qs-hsc, smc-1133-20-Games of Chance, smc-1133-30-Expected Frequency (np), smc-4225-35-Relative frequency, smc-827-20-Games of Chance, smc-827-40-Expected Frequency (np), smc-990-20-Games of Chance, smc-990-40-Expected Frequency (np)

Financial Maths, STD2 F1 2006 HSC 5 MC

A salesman earns $200 per week plus $40 commission for each item he sells.

How many items does he need to sell to earn a total of $2640 in two weeks?

  1. 33
  2. 56
  3. 61
  4. 66
Show Answers Only

`B`

Show Worked Solution

`text(Let items sold) = n`

`text{Wages over 2 weeks}\ (w)`

`= (2 xx 200) + 40n`

`= 400 + 40n`
 

`text(Find)\ n\ text(when)\ w = 2640:`

`2640` `= 400 + 40n`
`40n` `= 2240`
`n` `= 56`

 
`=>  B`

Filed Under: Earning and Spending Money, Earning Money and Budgeting (Std 1), Earning Money and Budgeting (Std 2), FM1 - Earning money, Ways of Earning (Std2-2027) Tagged With: Band 3, num-title-ct-corea, num-title-qs-hsc, smc-1126-20-Commission, smc-4331-20-Commission, smc-6276-20-Commission, smc-810-20-Commission

Statistics, STD2 S1 2006 HSC 4 MC

A set of scores is displayed in a stem-and-leaf plot.
 

 2UG-2006-4MC

 
What is the median of this set of scores?

  1.   28
  2.   30
  3.   33
  4.   47
Show Answers Only

`C`

Show Worked Solution

`text(10 scores)`

`text(Median)` `= text{5th + 6th}/2`
  `= (28 + 38)/2`
  `= 33`

`=>  C`

Filed Under: Bar Charts, Histograms and Other Graphs (Std 1), Other Chart Types (Y12), Other Charts (Std 2), Other Charts (Std2-2027), Stem & Leaf, Box & Whisker Tagged With: Band 4, common-content, num-title-ct-core, num-title-qs-hsc, smc-1128-24-Stem and Leaf, smc-4224-20-Median, smc-4224-40-Stem and Leaf, smc-6311-10-Stem-and-Leaf, smc-822-20-Stem and Leaf, smc-998-20-Stem and Leaf

Measurement, STD2 M6 2006 HSC 3 MC

The angle of depression of the base of the tree from the top of the building is 65°. The height of the building is 30 m.

How far away is the base of the tree from the building, correct to one decimal place?


  1. 12.7 m
  2. 14.0 m
  3. 33.1 m
  4. 64.3 m
Show Answers Only

`B`

Show Worked Solution
 

`text(Let)\ d =\ text(distance from base to tree)`

`tan25^@` `=d/30`  
`:.d` `=30 xx tan25^@`  
  `=13.98…\ text{m}`  

 
`=>  B`

Filed Under: M3 Right-Angled Triangles (Y12), Pythagoras and basic trigonometry, Pythagoras and Right-Angled Trig (Std2), Right-Angled Trig Tagged With: Band 3, num-title-ct-coreb, num-title-qs-hsc, smc-1103-20-Right-angled Trig, smc-1103-30-Angle of Depression, smc-4552-40-Real world applications, smc-4552-50-Angle of depression, smc-802-20-Right-Angled Trig, smc-802-30-Angle of Depression

Probability, STD2 S2 2006 HSC 1 MC

The probability of an event occurring is `9/10.`

Which statement best describes the probability of this event occurring?

  1.    The event is likely to occur.
  2.    The event is certain to occur.
  3.    The event is unlikely to occur.
  4.    The event has an even chance of occurring.
Show Answers Only

`A`

Show Worked Solution

`text(The event is highly likely to occur)`

`text(but not certain.)`

`=>  A`

Filed Under: Fundamental understanding, Fundamental Understanding (Std 1), Fundamental Understanding (Std 2), Probability Tagged With: Band 3, num-title-ct-core, num-title-qs-hsc, smc-4225-05-Core concepts

Probability, STD2 S2 2005 HSC 23a

There are 100 tickets sold in a raffle. Justine sold all 100 tickets to five of her friends. The number of tickets she sold to each friend is shown in the table.
 

  1. Justine claims that each of her friends is equally likely to win first prize.


    Give a reason why Justine’s statement is NOT correct.   (1 mark)

    --- 2 WORK AREA LINES (style=lined) ---

  2. What is the probability that first prize is NOT won by Khalid or Herman?   (2 marks)

    --- 4 WORK AREA LINES (style=lined) ---

Show Answers Only
  1. `text(The claim is incorrect because each of her friends)`
    `text(bought a different number of tickets and therefore)`
    `text(their chances of winning are different.)`
  2. `69/100`
Show Worked Solution

i.    `text(The claim is incorrect because each of her friends bought)`

`text(a different number of tickets and therefore their chances of)`

`text(winning are different.)`


ii.  `text(Number of tickets not sold to K or H)`

`= 45 + 10 + 14`

`= 69`
 

`:.\ text(Probability 1st prize NOT won by K or H)`

`= 69/100`

Filed Under: Combinations and Single Stage Events (Std 2), Fundamental understanding, Fundamental Understanding (Std 1), Fundamental Understanding (Std 2), Multi-Stage Events, Single and Multi-Stage Events (Std 1), Single stage events Tagged With: Band 3, Band 4, num-title-ct-corea, num-title-qs-hsc, smc-1135-05-Simple Probability, smc-4238-70-Complementary events, smc-828-10-Simple Probability

Algebra, 2UG 2005 HSC 7 MC

Simplify  `2m^2 × 3m p^2`

  1. `5m^2p^2`
  2. `5m^3p^2`
  3. `6m^2p^2`
  4. `6m^3p^2`
Show Answers Only

`D`

Show Worked Solution
`2m^2 × 3m p^2` `= 6m^((2+1))p^2`  
  `=6m^3p^2`  

 
`=> D`

Filed Under: Index and Log Laws, Indices Tagged With: Band 4, num-title-ct-pathb, num-title-qs-hsc, smc-4228-10-Positive integers

Measurement, STD2 M6 2005 HSC 5 MC

Which formula should be used to calculate the distance between Toby and Frankie?

  1. `a/(sin A) = b/(sin B)`
  2. `c^2 = a^2 + b^2`
  3. `A = 1/2 ab\ sinC`
  4. `c^2 = a^2 + b^2 − 2ab\ cosC`
Show Answers Only

`A`

Show Worked Solution

`text(The triangle is not a right-angled triangle,)`

`:.\ text(Not)\ B`

`text(Given the information on the diagram provides)`

`text(2 angles and 1 side, the sine rule will work best.)`

`a/sinA = b/sinB`

`=> A`

Filed Under: Non Right-Angled Trig, Non-Right Angled Trig, Non-Right Angled Trig (Std2) Tagged With: Band 4, num-title-ct-pathc, num-title-qs-hsc, smc-4553-20-Sine Rule, smc-804-10-Cosine Rule, smc-804-20-Sine Rule

Probability, STD2 S2 2005 HSC 3 MC

Four radio stations reported the probability of rain as shown in the table.
 

Which radio station reported the highest probability of rain?

  1.    `text(2AT)`
  2.    `text(2BW)`
  3.    `text(2CZ)`
  4.    `text(2DL)`
Show Answers Only

`D`

Show Worked Solution

`text(Converting all probabilities to decimals)`

`2AT` `= 0.53`
`2BW` `= 0.17`
`2CZ` `= 0.52`
`2DL` `= 0.60`

`=> D`

Filed Under: Fundamental understanding, Fundamental Understanding (Std 1), Fundamental Understanding (Std 2), Probability Tagged With: Band 4, num-title-ct-core, num-title-qs-hsc, smc-4225-05-Core concepts

Algebra, STD2 A1 2005 HSC 2 MC

What is the value of  `(a-b)/4`, if  `a = 240`  and  `b = 56`?

  1. `4`
  2. `46`
  3. `226`
  4. `736`
Show Answers Only

`B`

Show Worked Solution
`(a-b)/4` `= (240-56)/4`
  `= 46`

 
`=> B`

Filed Under: AM1 - Algebra (Prelim), Linear, Substitution and Other Equations (Std 1), Substitution and Other Equations (Std2-2027) Tagged With: Band 2, num-title-ct-corea, num-title-qs-hsc, smc-1116-10-Substitution, smc-4362-10-Substitute, smc-6234-10-Substitution, smc-789-10-Substitution

Statistics, STD2 S1 2005 HSC 1 MC

What is the mean of the set of scores?

`3, \ 4, \ 5, \ 6, \ 6, \ 8, \ 8, \ 8, \ 15`
 

  1. 6
  2. 7
  3. 8
  4. 9
Show Answers Only

`B`

Show Worked Solution
`text(Mean)` `= ((3 + 4 + 5 +6 + 6 + 8 + 8 + 8 + 15))/9`
  `= 63/9`
  `= 7`

 
`=> B`

Filed Under: Data Analysis, Measures of Centre and Spread (Std2-2027), Summary Statistics - No Graph (Std 2), Summary Statistics (Std 1) Tagged With: Band 2, common-content, num-title-ct-core, num-title-qs-hsc, smc-1131-10-Mean, smc-4224-25-Mean, smc-6312-10-Mean, smc-824-10-Mean

Algebra, STD2 A1 2004 HSC 11 MC

If  `d = 6t^2`, what is a possible value of `t` when  `d = 2400`?

  1. `0.05`
  2. `20`
  3. `120`
  4. `400`
Show Answers Only

`B`

Show Worked Solution
`d` `= 6t^2`
`t^2` `= d/6`
`t` `= +- sqrt(d/6)`

 
`text(When)\ \ d = 2400:`

`t` `= +- sqrt(2400/6)`
  `= +- 20`

 
`=> B`

Filed Under: AM1 - Algebra (Prelim), Formula Rearrange, Formula Rearrange (Std 1), Formula Rearrange (Std 2), Formula Rearrange (Std2-2027), Quadratics and Cubics, Substitution and Other Equations (Std 1), Substitution and Other Equations (Std 2), Substitution and Other Equations (Std2-2027) Tagged With: Band 4, num-title-ct-pathc, num-title-qs-hsc, smc-1116-20-Rearrange and Substitute, smc-1200-20-Non-Linear, smc-1201-20-Non-Linear, smc-4386-10-Rearrange equation, smc-4386-15-Substitution, smc-6234-20-Rearrange and Substitute, smc-6236-20-Non-Linear, smc-789-20-Rearrange and Substitute

Measurement, STD2 M6 2004 HSC 9 MC

What is the area of the triangle to the nearest square metre?


  1. `text(102 m²)`
  2. `text(153 m²)`
  3. `text(172 m²)`
  4. `text(178 m²)`
Show Answers Only

`C`

Show Worked Solution

`text(Using sine rule,)`

`text(Area)` `= 1/2 ab sin C`
  `= 1/2 xx 30 xx 20 xx sin 35^@`
  `=172.072…\ text(m²)`

`=> C`

Filed Under: Non Right-Angled Trig, Non-Right Angled Trig, Non-Right Angled Trig (Std2) Tagged With: Band 3, num-title-ct-pathc, num-title-qs-hsc, smc-4553-30-Sine Rule (Area), smc-804-30-Sine Rule (Area)

Statistics, STD2 S1 2004 HSC 8 MC

This sector graph shows the distribution of 116 prizes won by three schools: X, Y and Z.


How many prizes were won by School X?

  1.   26
  2.   32
  3.   81
  4.   99
Show Answers Only

`B`

Show Worked Solution

`text(Centre angle of School X sector)`

`= 100^@\ text{(by measurement)}`
 

`:.\ text(Prizes won by school X)`

`= 100/360 xx 116`

`= 32.22\ …`

`=> B`

Filed Under: Bar Charts, Histograms and Other Graphs (Std 1), Displaying Data, Other Chart Types (Y12), Other Charts (Std 2), Other Charts (Std2-2027), Other Graphs Tagged With: Band 3, common-content, num-title-ct-core, num-title-qs-hsc, smc-1128-28-Other Charts, smc-5076-15-Sector graphs and Divided Bar graphs, smc-6311-30-Other Charts, smc-822-40-Other Charts, smc-998-40-Other Charts

Statistics, STD2 S1 2004 HSC 6-7 MC

Use the set of scores  1, 3, 3, 3, 4, 5, 7, 7, 12  to answer Questions 6 and 7.
 

Question 6

What is the range of the set of scores?

  1. 6
  2. 9
  3. 11
  4. 12


Question 7

What are the median and the mode of the set of scores?

  1. Median 3, mode 5
  2. Median 3, mode 3
  3. Median 4, mode 5
  4. Median 4, mode 3
Show Answers Only

`text(Question 6:)\ C`

`text(Question 7:)\ D`

Show Worked Solution

`text(Question 6)`

`text(Range)` `= text(High) – text(Low)`
  `= 12 – 1`
  `= 11`

`=> C`


`text(Question 7)`

`text(9 scores)`

`:.\ text(Median)` `= (9 + 1) / 2`
  `=5 text(th score)`
  `= 4`

`text(Mode) = 3`

`=> D`

Filed Under: Data Analysis, Measures of Centre and Spread (Std2-2027), Summary Statistics - No Graph (Std 2), Summary Statistics - No graph (Y12), Summary Statistics (no graph), Summary Statistics (Std 1) Tagged With: Band 3, Band 4, common-content, num-title-ct-core, num-title-qs-hsc, smc-1131-20-Median and Mode, smc-1131-70-Other, smc-4224-45-Mean/median/mode/range, smc-6312-20-Median and Mode, smc-6312-70-Other, smc-824-20-Median and Mode, smc-824-70-Other, smc-999-20-Median and Mode, smc-999-70-Other

Algebra, STD2 A2 2004 HSC 2 MC

Susan drew a graph of the height of a plant.
  

What is the gradient of the line?

  1. `1`
  2. `5`
  3. `7.5`
  4. `10`
Show Answers Only

`B`

Show Worked Solution

`text(2 points on graph)\ \ (0, 10),\ (1, 15)`

`text(Gradient)` `= (y_2-y_1) / (x_2-x_1)`
  `= (15-10) / (1-0)`
  `= 5`

`=> B`

Filed Under: AM2 - Linear Relationships (Prelim), Cartesian Plane, Linear Equations and Basic Graphs (Std 1), Linear Equations and Basic Graphs (Std 2), Linear Relationships and Basic Graphs (Std2-2027) Tagged With: Band 3, num-title-ct-pathc, num-title-qs-hsc, smc-1118-10-Gradient, smc-4422-20-Gradient, smc-6255-10-Find Gradient/Intercept, smc-792-10-Gradient

Probability, STD2 S2 2004 HSC 1 MC

Which fraction is equal to a probability of `text(25%)`?

  1.   `1/25`
  2.   `1/4`
  3.   `1/3`
  4.   `1/2`
Show Answers Only

`B`

Show Worked Solution

`P=25/100=1/4`

`=> B`

Filed Under: Fundamental understanding, Fundamental Understanding (Std 1), Fundamental Understanding (Std 2), Probability Tagged With: Band 2, num-title-ct-core, num-title-qs-hsc, smc-4225-05-Core concepts

Probability, STD2 S2 2007 HSC 25c

In a stack of 10 DVDs, there are 5 rated PG, 3 rated G and 2 rated M.

  1. A DVD is selected at random. What is the probability that it is rated M?   (1 mark)

    --- 2 WORK AREA LINES (style=lined) ---

Grant chooses two DVDs at random from the stack. Copy or trace the tree diagram into your writing booklet.
 

  1. Complete the tree diagram by writing the correct probability on each branch.   (2 marks)

    --- 0 WORK AREA LINES (style=lined) ---

  2. Calculate the probability that Grant chooses two DVDs with the same rating.   (2 marks)

    --- 4 WORK AREA LINES (style=lined) ---

Show Answers Only
  1. `1/5`
  2.  
  3. `14/45`
Show Worked Solution

i.    `text(5 PG, 3 G, 2 M)`

`P text{(M)} = 2/10 = 1/5` 


ii.   


iii.  `P text{(same rating)}`

`= P text{(PG, PG)} + P text{(G, G)} + P text{(M, M)}`

`= (1/2 xx 4/9) + (3/10 xx 2/9) + (1/5 xx 1/9)`

`= 2/9 + 1/15 + 1/45`

`= 14/45`

Filed Under: Multi-stage Events, Multi-Stage Events, Multi-Stage Events (Std 2), Single and Multi-Stage Events (Std 1) Tagged With: Band 3, Band 5, num-title-ct-corea, num-title-qs-hsc, smc-1135-10-Probability Trees, smc-4238-10-Dependent events, smc-4238-50-Probability trees, smc-829-10-Probability Trees

Probability, STD2 S2 2007 HSC 25a

Give an example of an event that has a probability of exactly  `3/4`.   (1 mark)

--- 2 WORK AREA LINES (style=lined) ---

Show Answers Only

`text(Choosing a red ball out of a bag that)`

`text(contains 3 red balls and 1 green ball.)`

`text {(} text(An infinite amount of examples are)`

`text(possible) text{).}`

Show Worked Solution

`text(Choosing a red ball out of a bag that contains)`

`text(3 red balls and 1 green ball.)`

`text {(} text(An infinite amount of examples are)`

`text(possible) text{).}`

Filed Under: Fundamental understanding, Fundamental Understanding (Std 1), Fundamental Understanding (Std 2), Probability Tagged With: Band 4, num-title-ct-core, num-title-qs-hsc, smc-4225-05-Core concepts

Algebra, STD2 A2 2007 HSC 24c

Sandy travels to Europe via the USA. She uses this graph to calculate her currency conversions.


  1. After leaving the USA she has US$150 to add to the A$600 that she plans to spend in Europe.


    She converts all of her money to euros. How many euros does she have to spend in Europe?    (3 marks)

    --- 6 WORK AREA LINES (style=lined) ---

  2. If the value of the euro falls in comparison to the Australian dollar, what will be the effect on the gradient of the line used to convert Australian dollars to euros?   (1 mark)

    --- 2 WORK AREA LINES (style=lined) ---

Show Answers Only
  1. `480\ €`
  2. `text(If the value of the euro falls against the)`
  3.  

    `text(A$, then 1 A$ will buy more euros than)`

  4.  

    `text(before and the gradient used to convert)`

  5.  

    `text{the currencies will steepen (increase).}`

Show Worked Solution

i.   `text(From graph:)`

`75\ text(US$)` `=\ text(100 A$)`
`=> 150\ text(US$)` `=\ text(200 A$)`

 
`:.\ text(Sandy has a total of 800 A$)`
 

`text(Converting A$ to €:)`

`text(100 A$)` `= 60\ €`
`:.\ text(800 A$)` `= 8 xx 60`
  `= 480\ €`


ii.   `text(If the value of the euro falls against the)`

`text(A$, then 1 A$ will buy more euros than)`

`text(before and the gradient used to convert)`

`text{the currencies will steepen (increase).}`

Filed Under: AM2 - Linear Relationships (Prelim), Applications: Currency, Fuel and Other Problems (Std 1), Applications: Currency, Fuel and Other Problems (Std 2), Applications: Currency, Fuel and Other Problems (Std2-2027), Variation and Rates of Change Tagged With: Band 4, num-title-ct-patha, num-title-qs-hsc, smc-1119-10-Currency Conversion, smc-4239-70-Currency convert, smc-6256-10-Currency Conversion, smc-793-10-Currency Conversion

Algebra, STD2 A1 2007 HSC 24b

The distance in kilometres (`D`) of an observer from the centre of a thunderstorm can be estimated by counting the number of seconds (`t`) between seeing the lightning and first hearing the thunder.

Use the formula  `D = t/3`  to estimate the number of seconds between seeing the lightning and hearing the thunder if the storm is 1.2 km away.   (1 mark)

--- 2 WORK AREA LINES (style=lined) ---

Show Answers Only

`3.6\ text(seconds)`

Show Worked Solution

`D = t/3`

`text(When)\ \ D = 1.2,`

`t/3` `= 1.2`
`t` `= 3.6\ text(seconds)`

Filed Under: AM1 - Algebra (Prelim), Linear, Substitution and Other Equations (Std 1), Substitution and Other Equations (Std 2), Substitution and Other Equations (Std2-2027) Tagged With: Band 3, num-title-ct-corea, num-title-qs-hsc, smc-1116-20-Rearrange and Substitute, smc-4362-30-Rearrange and substitute, smc-6234-20-Rearrange and Substitute, smc-789-20-Rearrange and Substitute

Statistics, STD2 S1 2007 HSC 24a

Consider the following set of scores:

`3, \ 5, \ 5, \ 6, \ 8, \ 8, \ 9, \ 10, \ 10, \ 50.` 

  1. Calculate the mean of the set of scores.   (1 mark)

    --- 1 WORK AREA LINES (style=lined) ---

  2. What is the effect on the mean and on the median of removing the outlier?   (2 marks)

    --- 5 WORK AREA LINES (style=lined) ---

Show Answers Only
  1. `11.4`
  2. `text{If the outlier (50) is removed, the mean}`


    `text(would become lower.)`

  3.  

    `text(Median will NOT change.)`

Show Worked Solution

i.  `text(Total of scores)`

`= 3 + 5 + 5 + 6 + 8 + 8 + 9 + 10 + 10 +50`

`= 114`
 

`:.\ text(Mean) = 114/10 = 11.4`


ii.  `text(Mean)`

`text{If the outlier (50) is removed, the mean}`

`text(would become lower.)`
 

`text(Median)`

`text(The current median (10 data points))`

`= text(5th + 6th)/2 = (8 + 8)/2 = 8`

`text(The new median (9 data points))`

`=\ text(5th value)`

`= 8`
 

`:.\ text(Median will NOT change.)`

Filed Under: Data Analysis, Measures of Centre and Spread (Std2-2027), Summary Statistics - No Graph (Std 2), Summary Statistics - No graph (Y12), Summary Statistics (no graph), Summary Statistics (Std 1) Tagged With: Band 3, Band 4, common-content, num-title-ct-core, num-title-qs-hsc, smc-1131-10-Mean, smc-1131-20-Median and Mode, smc-4224-25-Mean, smc-4224-30-Outliers, smc-4224-50-Add/remove data, smc-6312-10-Mean, smc-6312-20-Median and Mode, smc-824-10-Mean, smc-824-20-Median and Mode, smc-999-10-Mean, smc-999-20-Median and Mode

Algebra, STD2 A1 2007 HSC 19 MC

Which of the following correctly expresses  `T`  as the subject of  `B = 2pi (R + T/2)`?

  1. `T = B/pi-2R`
  2. `T = B/pi-R`
  3. `T = 2R-B/pi`
  4. `T = B/(4pi)-R/2`
Show Answers Only

`A`

Show Worked Solution
`B` `= 2pi (R + T/2)`
`B/(2pi)` `= R + T/2`
`T/2` `= B/(2pi)-R`
`T` `= B/pi-2R`

 
`=>  A`

Filed Under: Formula Rearrange, Formula Rearrange (Std 1), Formula Rearrange (Std 2), Formula Rearrange (Std2-2027), Linear Tagged With: Band 5, num-title-ct-pathc, num-title-qs-hsc, smc-1200-10-Linear, smc-1201-10-Linear, smc-4362-20-Formula rearrange, smc-6236-10-Linear

Probability, STD2 S2 2007 HSC 16 MC

Leanne copied a two-way table into her book.


Leanne made an error in copying one of the values in the shaded section of the table.

Which value has been incorrectly copied?

  1. The number of males in full-time work
  2. The number of males in part-time work
  3. The number of females in full-time work
  4. The number of females in part-time work
Show Answers Only

`D`

Show Worked Solution

`text(By checking row and column total, the number)`

`text(of females part-time work is incorrect)`

`=>  D`

Filed Under: Relative Frequency (Std 1), Relative Frequency (Std 2), Relative Frequency (Y11), Relative Frequency and Venn Diagrams, Summary Statistics (no graph) Tagged With: Band 4, common-content, num-title-ct-pathb, num-title-qs-hsc, smc-1133-10-Surveys/Two-Way Tables, smc-4815-10-2-Way tables, smc-827-10-Surveys/Two-Way Tables, smc-990-10-Surveys/Two-Way Tables

Algebra, STD2 A4 2007 HSC 15 MC

If pressure (`p`) varies inversely with volume (`V`), which formula correctly expresses  `p`  in terms of  `V`  and  `k`, where  `k`  is a constant?

  1. `p = k/V`
  2. `p = V/k`
  3. `p = kV`
  4. `p = k + V`
Show Answers Only

`A`

Show Worked Solution

`p prop 1/V`

`p = k/V`

`=>  A`

Filed Under: Inverse, Non-Linear: Inverse and Other Problems (Std 2), Variation and Rates of Change Tagged With: Band 5, num-title-ct-patha, num-title-qs-hsc, smc-4239-30-a prop 1/b, smc-795-10-Inverse, smc-795-40-Proportional

  • « Previous Page
  • 1
  • …
  • 3
  • 4
  • 5
  • 6
  • 7
  • 8
  • Next Page »

Copyright © 2014–2025 SmarterEd.com.au · Log in