What is `2.49572` correct to three significant figures?
- `2.49`
- `2.50`
- `2.495`
- `2.496`
Aussie Maths & Science Teachers: Save your time with SmarterEd
What is `2.49572` correct to three significant figures?
What is `7.85179` correct to three significant figures?
A fitness index, `F`, is calculated by dividing a person’s weight, `w`, in kilograms by the square of the person’s height, `h`, in metres.
--- 3 WORK AREA LINES (style=lined) ---
In the next few years, Albert expects to grow 20 cm taller. By then he wants his fitness index to be 23. How much weight should he gain or lose to achieve this? Justify your answer with mathematical calculations. (2 marks)
--- 5 WORK AREA LINES (style=lined) ---
A golf club hires an entire course for a charity event at a total cost of `$40\ 000`. The cost will be shared equally among the players, so that `C` (in dollars) is the cost per player when `n` players attend.
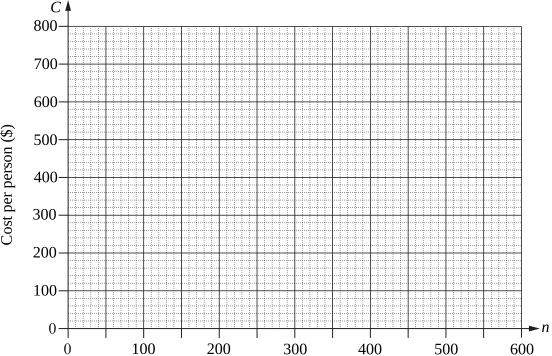
--- 1 WORK AREA LINES (style=lined) ---
--- 2 WORK AREA LINES (style=lined) ---
--- 4 WORK AREA LINES (style=lined) ---
a.
\begin{array} {|l|c|c|c|c|c|c|}
\hline
\rule{0pt}{2.5ex}\text{Number of players} (n) \rule[-1ex]{0pt}{0pt} & \ 500\ & \ 1000 \ & 1500 \ & 2000 \ & 2500\ & 3000 \ \\
\hline
\rule{0pt}{2.5ex}\text{Cost per person} (C)\rule[-1ex]{0pt}{0pt} & 240 & 120 & 80 & 60 & 48\ & 40 \ \\
\hline
\end{array}
| b. | 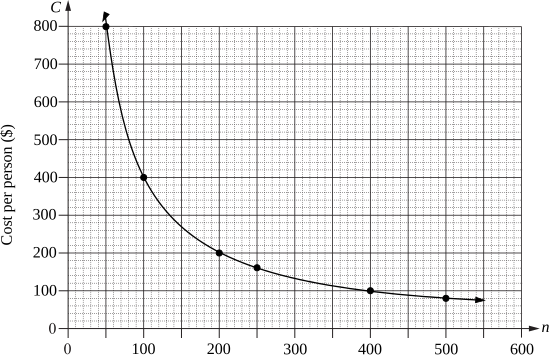 |
c. `C = (40\ 000)/n`
`n\ text(must be a whole number)`
d. `text(Limitations can include:)`
`•\ n\ text(must be a whole number)`
`•\ C > 0`
e. `text(If)\ C = 94:`
| `94` | `= (120\ 000)/n` |
| `94n` | `= 120\ 000` |
| `n` | `= (120\ 000)/94` |
| `= 1276.595…` |
`:.\ text(C)text(ost cannot be $94 per person, because)\ n\ text(isn’t a whole number.)`
a.
\begin{array} {|l|c|c|c|c|c|c|}
\hline
\rule{0pt}{2.5ex}\text{Number of players} (n) \rule[-1ex]{0pt}{0pt} & \ 50\ & \ 100 \ & 200 \ & 250 \ & 400\ & 500 \ \\
\hline
\rule{0pt}{2.5ex}\text{Cost per person} (C)\rule[-1ex]{0pt}{0pt} & 800 & 400 & 200 & 160 & 100\ & 80 \ \\
\hline
\end{array}
b.
c. `C = (40\ 000)/n`
d. `text(Limitations can include:)`
`•\ n\ text(must be a whole number)`
`•\ C > 0`
e. `text(If)\ C = 120`
| `120` | `= (40\ 000)/n` |
| `120n` | `= 40\ 000` |
| `n` | `= (40\ 000)/120` |
| `= 333.33..` |
`:.\ text{Cost cannot be $120 per person because the required}\ n\ \text{is not a whole number.}`
A chef believes that the time it takes to defrost a turkey (`D` hours) varies inversely with the room temperature (`T^\circ \text{C}`). The chef observes that at a room temperature of `20^\circ \text{C}`, it takes 15 hours for the turkey to fully defrost.
--- 4 WORK AREA LINES (style=lined) ---
\begin{array} {|l|c|c|c|c|c|}
\hline
\rule{0pt}{2.5ex} \ \ T\ \ \rule[-1ex]{0pt}{0pt} & \ \ \ 10\ \ \ & \ \ 15\ \ \ & \ \ \ 20\ \ \ & \ \ \ 25\ \ \ & \ \ \ 30\ \ \ \\
\hline
\rule{0pt}{2.5ex} \ \ D\ \ \rule[-1ex]{0pt}{0pt} & \ \ \ \ & \ \ \ & \ \ \ \ & \ \ \ \ & \ \ \ \\
\hline
\end{array}
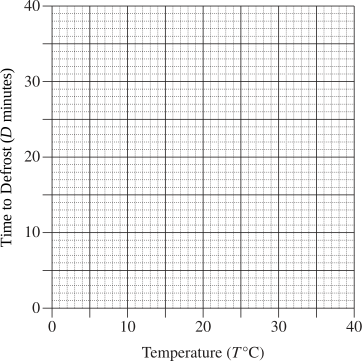
--- 0 WORK AREA LINES (style=lined) ---
a. `D \prop 1/T\ \ =>\ \ D=k/T`
| `15` | `=k/20` | |
| `k` | `=15 xx 20=300` |
`:.D=300/T`
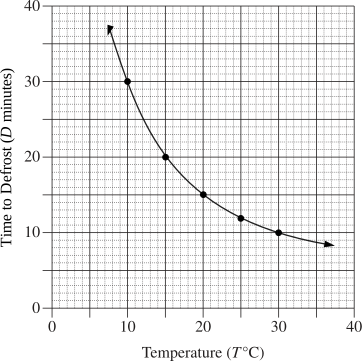
b.
\begin{array} {|l|c|c|c|c|c|}
\hline
\rule{0pt}{2.5ex} \ \ T\ \ \rule[-1ex]{0pt}{0pt} & \ \ \ 10\ \ \ & \ \ 15\ \ \ & \ \ \ 20\ \ \ & \ \ \ 25\ \ \ & \ \ \ 30\ \ \ \\
\hline
\rule{0pt}{2.5ex} \ \ D\ \ \rule[-1ex]{0pt}{0pt} & \ \ \ 30\ \ \ & \ \ 20\ \ \ & \ \ \ 15\ \ \ & \ \ \ 12\ \ \ & \ \ \ 10\ \ \ \\
\hline
\end{array}
a. `D \prop 1/T\ \ =>\ \ D=k/T`
| `15` | `=k/20` | |
| `k` | `=15 xx 20=300` |
`:.D=300/T`
b.
\begin{array} {|l|c|c|c|c|c|}
\hline
\rule{0pt}{2.5ex} \ \ D\ \ \rule[-1ex]{0pt}{0pt} & \ \ \ 10\ \ \ & \ \ 15\ \ \ & \ \ \ 20\ \ \ & \ \ \ 25\ \ \ & \ \ \ 30\ \ \ \\
\hline
\rule{0pt}{2.5ex} \ \ T\ \ \rule[-1ex]{0pt}{0pt} & 30 & 20 & 15 & 12 & 10 \\
\hline
\end{array}
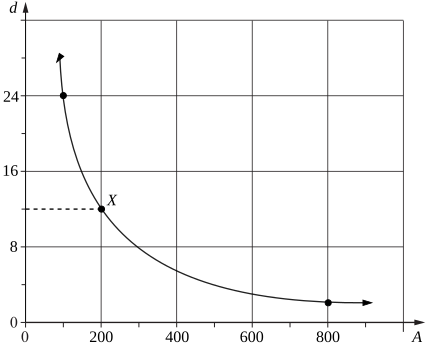
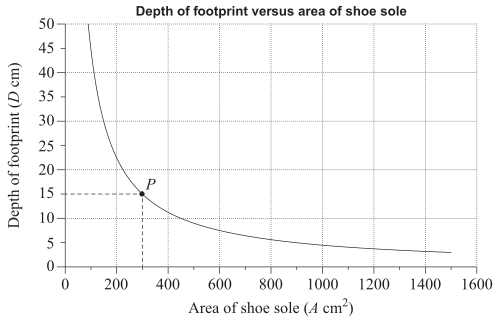
Snowhound makes snow shoes of various sizes. In its design phase, Snowhound collect data on the different footprint depths of snow shoes of different sizes, all worn by the same person.
The footprint depth (`d` cm) is then graphed against the area of the sole of the snow shoe (`A` cm).
Find the equation relating `d` and `A`. (2 marks)
--- 4 WORK AREA LINES (style=lined) ---
Use your equation from part (a) to calculate the area of his shoe sole. (1 mark)
--- 1 WORK AREA LINES (style=lined) ---
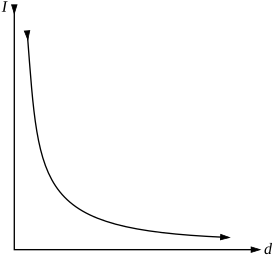
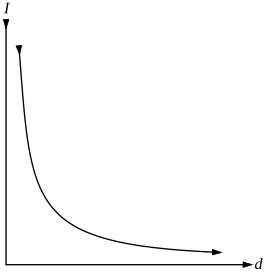
The intensity of light, `I`, from a lamp varies inversely with the square of the distance, `d`, from the lamp.
Write an equation relating `I`, `d` and `k`, where `k` is a constant. (1 mark)
--- 2 WORK AREA LINES (style=lined) ---
By finding the value of the constant, `k`, find the value of `I` when `d = 5`. (2 marks)
--- 4 WORK AREA LINES (style=lined) ---
Use the horizontal axis to represent distance and the vertical axis to represent light intensity. (2 marks)
--- 8 WORK AREA LINES (style=lined) ---
The time taken to harvest a field varies inversely with the number of workers employed.
It takes 12 workers 36 hours to harvest the field.
Working at the same rate, how many hours would it take 27 workers to harvest the same field?
If the speed `(s)` of a journey varies inversely with the time `(t)` taken, which formula correctly expresses `s` in terms of `t` and `k`, where `k` is a constant?
The time taken to charge a battery varies inversely with the charging voltage. At 24 volts \((V)\) it takes 15 hours to fully charge a battery.
How long will it take the same battery to fully charge at 40 volts?
The time taken to fill a swimming pool varies inversely with the number of hoses being used.
Using 4 hoses, it takes 18 hours to fill the pool.
How many hours would it take 9 hoses to fill the same pool?
An object is projected vertically into the air. Its height, \(h\) metres, above the ground after \(t\) seconds is given by \(h=-5 t^2+80 t\).
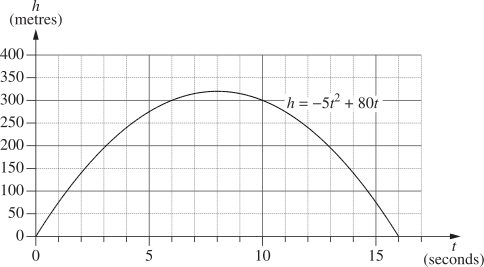
How far does the object travel in the first 10 seconds?
Which graph best represents the equation \(y = 2-x^2\) ?
| A. | 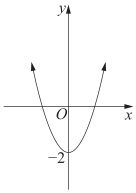 |
B. | 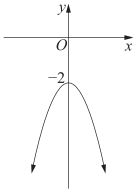 |
| C. | 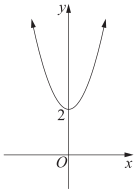 |
D. | 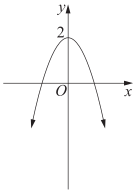 |
What is the gradient of the line \(6x+7y-1 = 0\)?
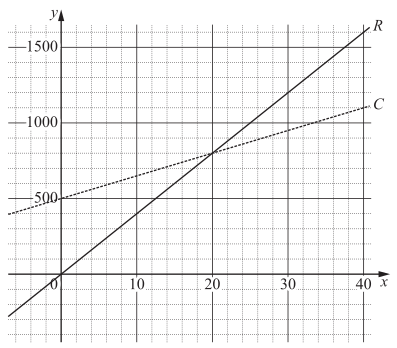
Damo hires paddle boats in summertime as part of his water sports business. To calculate the cost, \(C\), in dollars, of hiring \(x\) paddle boats, he uses the equation \(C=40+25x\).
He hires the paddle boats for $35 per hour and determines his income, \(I\), in dollars, using the equation \(I=35x\).
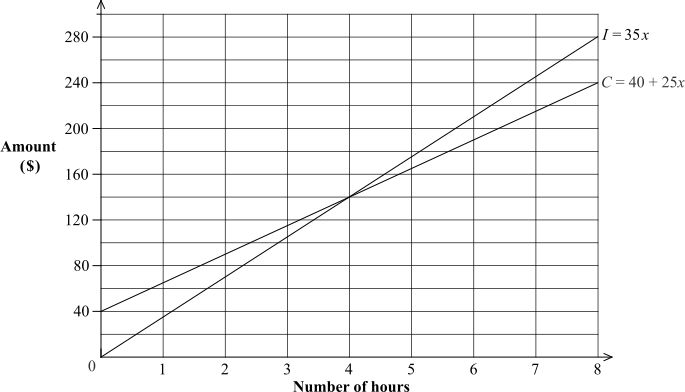
Use the graph to solve the two equations simultaneously for \(x\) and explain the significance of this solution for Damo's business. (2 marks)
--- 4 WORK AREA LINES (style=lined) ---
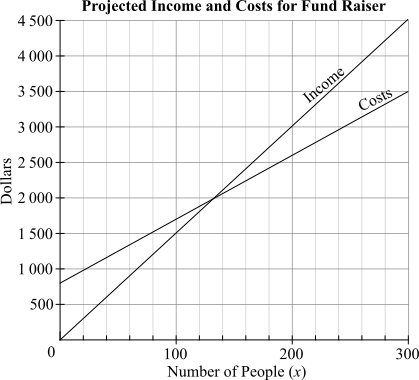
Jake and Preston are planning a fund-raising event at the local swim centre. They can have access to the giant pool float for $550 and the party room hire for $250. A sausage sizzle and drinks will cost them $9 per person.
--- 2 WORK AREA LINES (style=lined) ---
The graph shows planned income and costs when the ticket price is $15.
--- 1 WORK AREA LINES (style=lined) ---
--- 2 WORK AREA LINES (style=lined) ---
Jake and Preston have 300 tickets to sell. They want to make a profit of $1510.
--- 6 WORK AREA LINES (style=lined) ---
There are two tanks at an industrial plant, Tank A and Tank B. Initially, Tank A holds 2520 litres of liquid fertiliser and Tank B is empty.
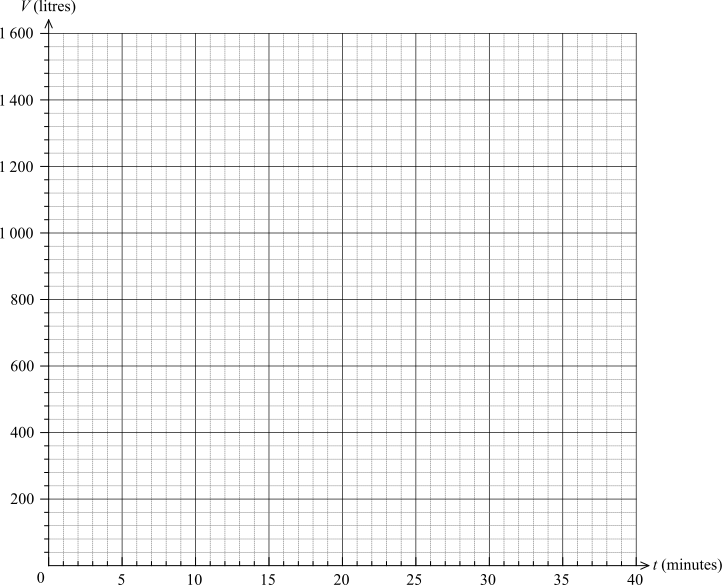
The volume of liquid fertiliser in Tank A is modelled by \(V=1400-40t\) where \(V\) is the volume in litres and \(t\) is the time in minutes from when the tank begins to drain the fertiliser.
On the grid below, draw the graph of this model and label it as Tank A. (1 mark)
--- 2 WORK AREA LINES (style=lined) ---
--- 1 WORK AREA LINES (style=lined) ---
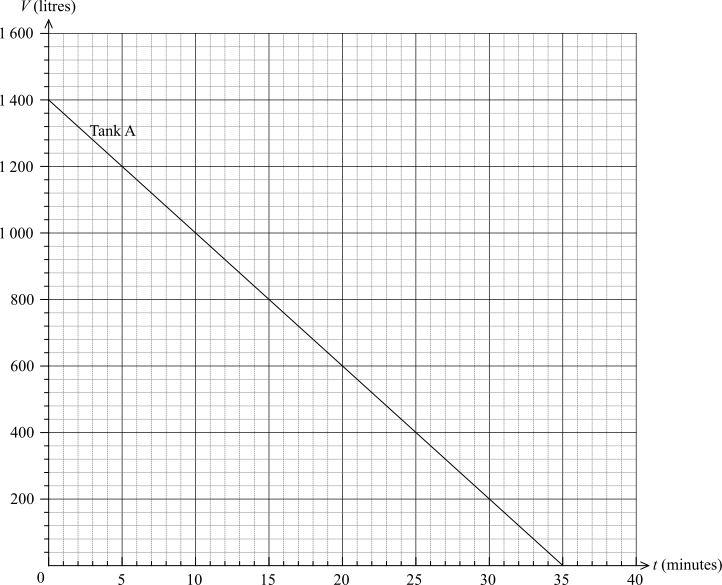
a. \(\text{Tank} \ A \ \text{will pass through (0, 1400) and (35, 0)}\)
b. \(\text{Tank} \ B \ \text{will pass through (10, 0) and (30, 1200)}\)
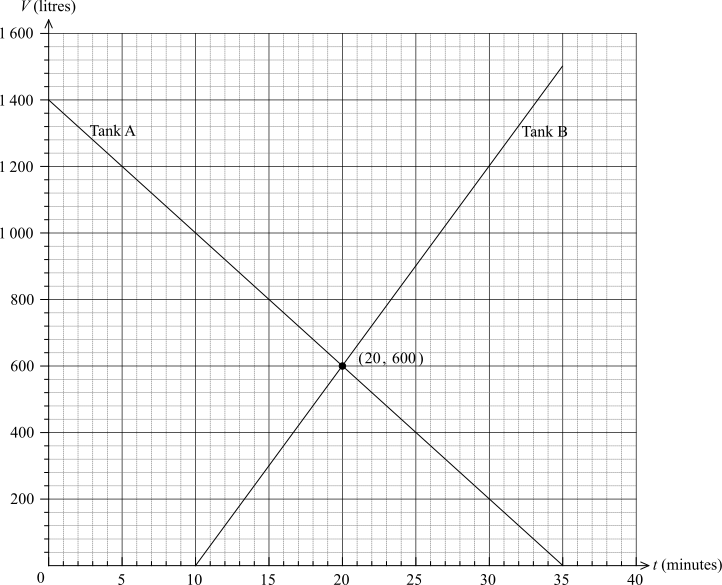
\(\text{By inspection, the two graphs intersect at} \ \ t = 20 \ \text{minutes}\)
c. \(\text{Strategy 1}\)
\(\text{By inspection of the graph, consider} \ \ t = 30\)
\(\text{Tank A} = 200 \ \text{L} , \ \text{Tank B} =1200 \ \text{L}\)
\(\therefore\ \text{Total volume = 1400 L when t = 30}\)
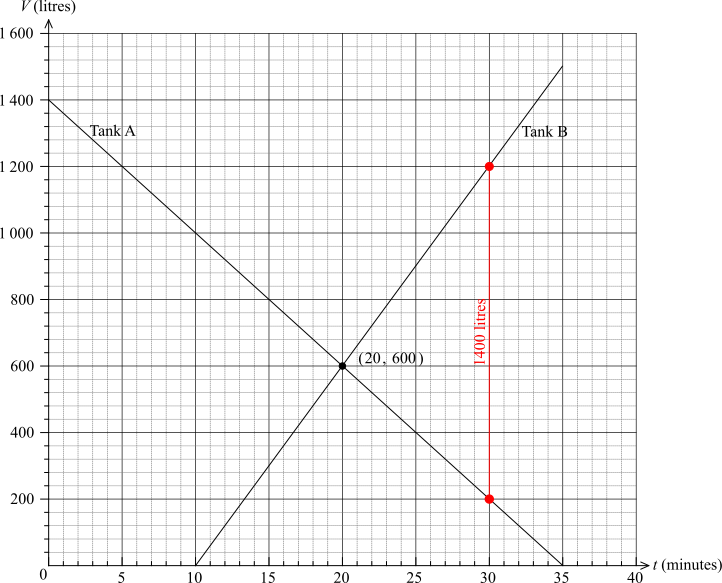
\(\text{Strategy 2}\)
| \(\text{Total Volume}\) | \(=\text{Tank A} + \text{Tank B}\) |
| \(1400\) | \(=1400-40t+(t-10)\times 60\) |
| \(1400\) | \(=1400-40t+60t-600\) |
| \(20t\) | \(= 600\) |
| \(t\) | \(= 30 \ \text{minutes}\) |
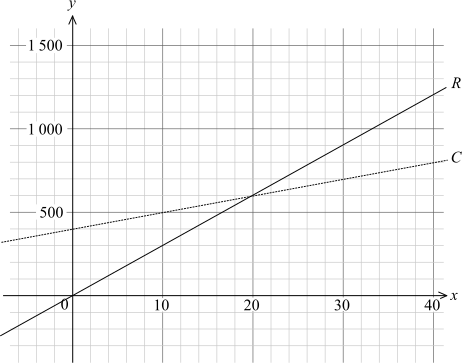
A small business makes and dog kennels.
Technology was used to draw straight-line graphs to represent the cost of making the dog kennels \((C)\) and the revenue from selling dog kennels \((R)\). The \(x\)-axis displays the number of dog kennels and the \(y\)-axis displays the cost/revenue in dollars.
--- 1 WORK AREA LINES (style=lined) ---
--- 6 WORK AREA LINES (style=lined) ---
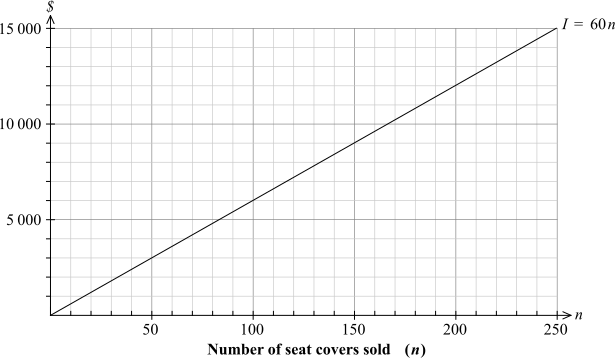
Noah's business manufactures car seat covers.
The monthly oncome, \(I\), in dollars, from selling \(n\) seat covers is given by
\(I=60n\)
This relationship is shown on the graph below.
The monthly cost, \(C\), in dollars, of making \(n\) seat covers is given by
\(C=35n+5000\)
--- 3 WORK AREA LINES (style=lined) ---
a.
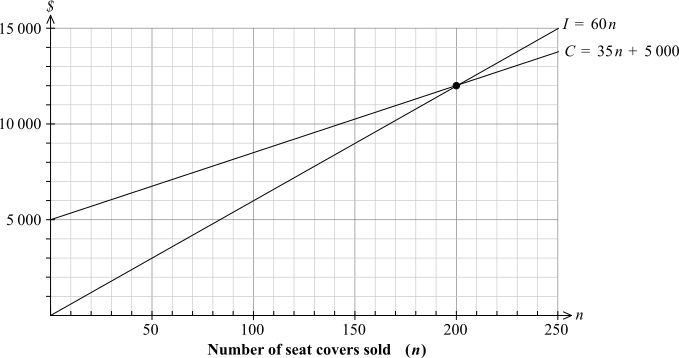
b. \(\text{200 seat covers and zero profit at this point}\)
a. \(\text{Draw graph through points (0, 5000) and (250, 13 750)}\)
b. \(C=35n+5000\ \text{and }I=60n\)
\(\text{Break-even occurs when} \ \ I=C\)
\(\text{Method 2: Graphically}\)
\(\text{Point of intersection is }\rightarrow (200, 12\ 000)\)
\(\text{Method 2: Algebraically}\)
\(\text{Solve for} \ n:\)
| \(60n\) | \(=35n+5000\) |
| \(25n\) | \(=5000\) |
| \(n\) | \(=200\) |
\(\therefore\ \text{200 seat covers must be sold to break even}\)
\(\text{and the profit at this point is zero}\)
Draw each graph on the grid below and hence solve the simultaneous equations. (3 marks)
\(y=2x-6\)
\(y-x+2=0\)
--- 6 WORK AREA LINES (style=lined) ---
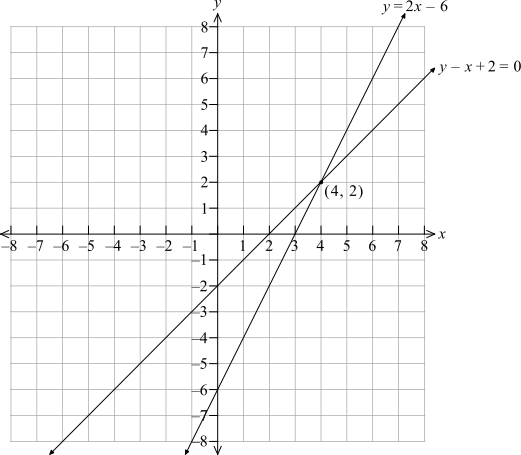
\(x=4,\ y=2\)
\(\text{Solution is at the intersection:}\ \ x=4,\ y=2\)
| \(y\) | \(=x-3\) |
| \(y+3x\) | \(=1\) |
Draw these two linear graphs on the number plane below and determine their intersection. (3 marks)
--- 2 WORK AREA LINES (style=lined) ---
\(\text{Table of values:}\ \ y=x-3\)
\begin{array} {|c|c|c|c|c|}
\hline x & -2 & -1 & 0 & \colorbox{lightblue}{ 1 } \\
\hline \ \ y \ \ & \ \ -5 \ \ & \ \ -4 \ \ & \ \ -3 \ \ & \ \colorbox{lightblue}{ – 2} \\
\hline \end{array}
\(\text{Table of values:}\ \ y+3x=1 \ \rightarrow \ y=-3x+1\)
\begin{array} {|c|c|c|c|c|}
\hline x & -1 & 0 & \colorbox{lightblue}{ 1 } & 2 \\
\hline \ \ y \ \ & \ \ \ 4\ \ \ & \ \ \ 1\ \ \ & \ \colorbox{lightblue}{ – 2} & \ \ -5 \ \ \\
\hline \end{array}
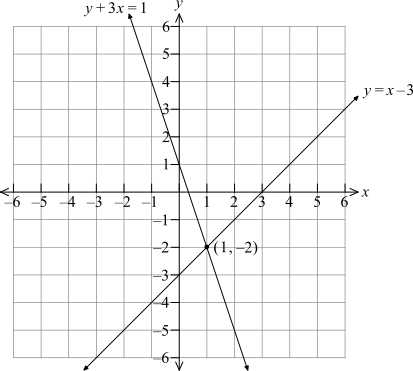
\(\text{From graph (and table), intersection occurs}\)
\(\text{at}\ \ (1, -2).\)
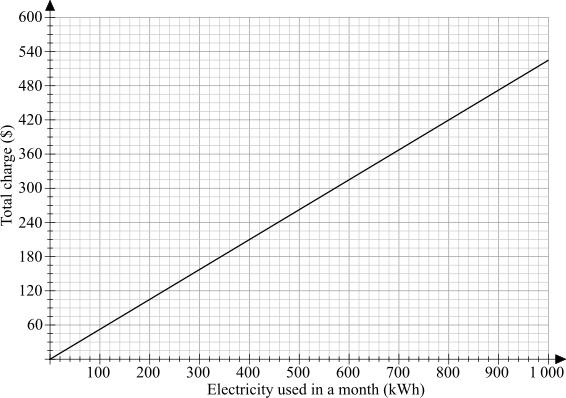
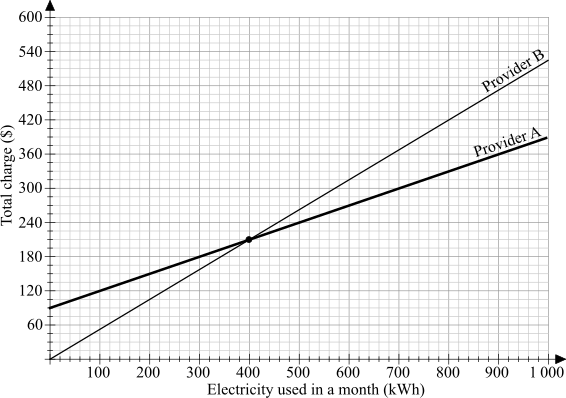
Electricity provider \(A\) charges 30 cents per kilowatt hour (kWh) for electricity, plus a fixed monthly charge of $90. Complete the table showing Provider \(A\)'s monthly charges for different levels of electricity usage. (1 mark) --- 1 WORK AREA LINES (style=lined) --- --- 4 WORK AREA LINES (style=lined) --- a. \(\text{When kWh} =400\) \(\text{Monthly charge}\ =$90+0.30\times 400=$210\) \begin{array} {|l|c|} b. c. \(\text{400 kWh}\) d. \(\text{Provider}\ A\ \text{is cheaper by \$45.}\) a. \(\text{When kWh} =400\) \(\text{Monthly charge}\ =$90+0.30\times 400=$210\) \begin{array} {|l|c|} b. c. \(A_{\text{charge}} = B_{\text{charge}}\ \text{at intersection.}\) \(\therefore\ \text{Same charge at 400 kWh}\) d. \(\text{Cost at 600 kWh:}\) \(\text{Method 1: Using graph}\rightarrow\ $315-270=$45\) \(\text{Method 2: Algebraically}:\) \(\text{Provider}\ A: \ 90 + 0.30 \times 600 = $270\) \(\text{Provider}\ B: \ 0.525 \times 600 = $315\) \(\therefore \text{Provider}\ A\ \text{is cheaper by \$45.}\)
\begin{array} {|l|c|}
\hline
\rule{0pt}{2.5ex} \textit{Electricity used in a month (kWh)} \rule[-1ex]{0pt}{0pt} & \ \ 0 \ \ & \ \ 400 \ \ & \ \ 1000 \ \ \\
\hline
\rule{0pt}{2.5ex} \textit{Monthly Charge (\$)} \rule[-1ex]{0pt}{0pt} & \ \ 90 \ \ & \ \ 210 \ \ & \ \ 390 \ \ \\
\hline
\end{array}
Provider \(B\) charges 52.5 cents per kWh, with no fixed monthly charge. The graph shows how Provider \(B\)'s charges vary with the amount of electricity used in a month.
Show Answers Only
\hline
\rule{0pt}{2.5ex} \textit{Electricity used in a month (kWh)} \rule[-1ex]{0pt}{0pt} & \ \ 0 \ \ & \ \ 400 \ \ & \ 1000 \ \\
\hline
\rule{0pt}{2.5ex} \textit{Monthly Charge (\$)} \rule[-1ex]{0pt}{0pt} & \ \ 90 \ \ & \ \ 210 \ \ & \ \ 390 \ \ \\
\hline
\end{array}
 Show Worked Solution
\hline
\rule{0pt}{2.5ex} \textit{Electricity used in a month (kWh)} \rule[-1ex]{0pt}{0pt} & \ \ 0 \ \ & \ \ 400 \ \ & \ 1000 \ \\
\hline
\rule{0pt}{2.5ex} \textit{Monthly Charge (\$)} \rule[-1ex]{0pt}{0pt} & \ \ 90 \ \ & \ \ 210 \ \ & \ \ 390 \ \ \\
\hline
\end{array}
The graph displays the cost (\($c\)) charged by two companies for the hire of a jetski for \(x\) hours.
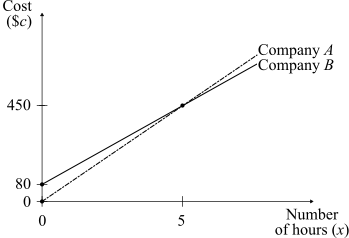
Both companies charge $450 for the hire of a jetski for 5 hours.
--- 1 WORK AREA LINES (style=lined) ---
Write a formula, in the of \(c=b+mx\), for the cost of hiring a jetski from Company B for \(x\) hours. (2 marks)
--- 4 WORK AREA LINES (style=lined) ---
Calculate how much cheaper this is than hiring from Company A. (2 marks)
--- 4 WORK AREA LINES (style=lined) ---
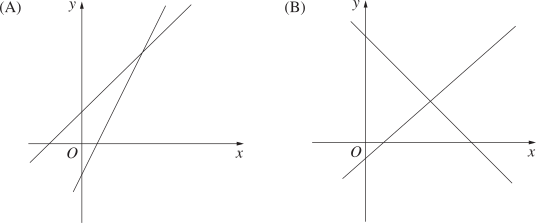
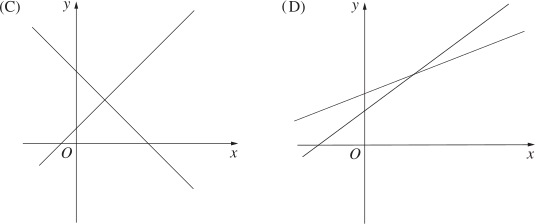
Uri drew a correct diagram that gave the solution to the simultaneous equations
\(y=2x+3\) and \(y=x+4\).
Which diagram did he draw?
A function centre hosts events for up to 500 people. The cost \(C\), in dollars, for the centre
to host an event, where \(x\) people attend, is given by:
\(C=20\ 000+40x\)
The centre charges $120 per person. Its income \(I\), in dollars, is given by:
\(I=120x\)
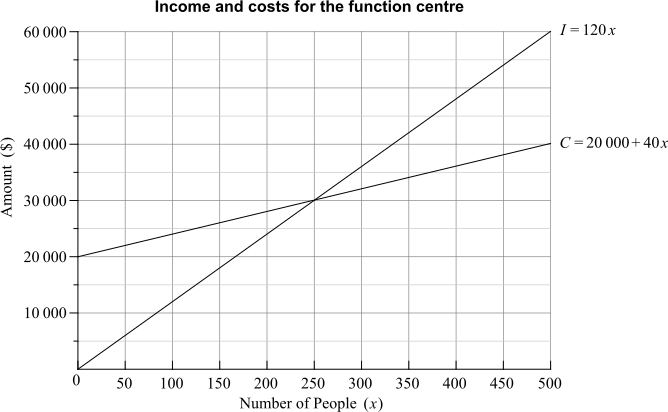
How much greater is the income of the function centre when 500 people attend an event, than its income at the breakeven point?
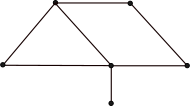
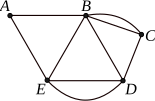
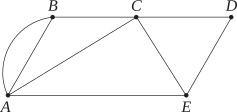
The sum of the degrees of all the vertices in the graph above is
A. `6`
B. `7`
C. `9`
D. `14`
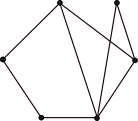
The number of edges in the graph above is
Conversion graphs can be used to convert from one currency to another.
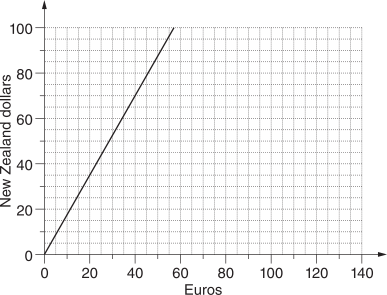
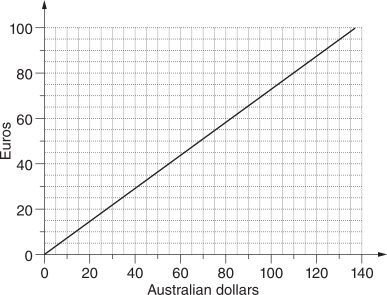
Abbie converted 70 New Zealand dollars into Euros. She then converted all of these Euros into Australian dollars.
How much money, in Australian dollars, should Abbie have?
The volume of water in a tank changes over six months, as shown in the graph.
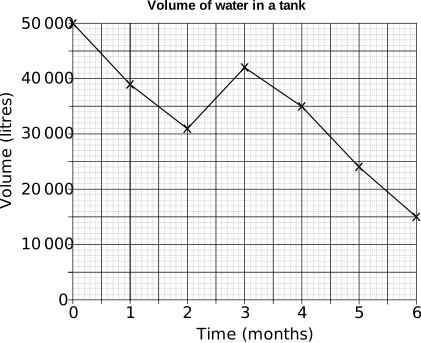
Consider the overall decrease in the volume of water.
What is the average percentage decrease in the volume of water per month over this time, to the nearest percent?
A factory makes both cloth and leather lounges. In any week
• the total number of cloth lounges and leather lounges that are made is 400
• the maximum number of leather lounges made is 270
• the maximum number of cloth lounges made is 325.
The factory manager has drawn a graph to show the numbers of leather lounges (\(x\)) and cloth lounges (\(y\)) that can be made.
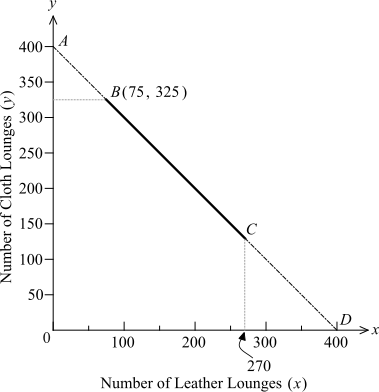
--- 2 WORK AREA LINES (style=lined) ---
--- 3 WORK AREA LINES (style=lined) ---
Compare the profits at \(B\) and \(C\). (2 marks)
--- 6 WORK AREA LINES (style=lined) ---
The graph shows tax payable against taxable income, in thousands of dollars.
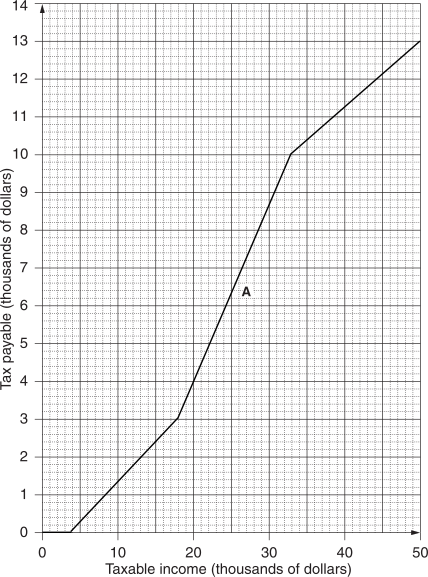
--- 1 WORK AREA LINES (style=lined) ---
--- 3 WORK AREA LINES (style=lined) ---
--- 2 WORK AREA LINES (style=lined) ---
--- 4 WORK AREA LINES (style=lined) ---
| a. | 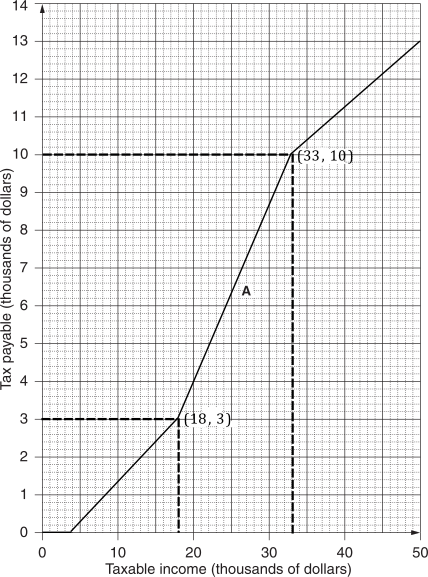 |
\(\text{Income on}\ $18\ 000=$3000\ \ \text{(from graph)}\)
b. \(\text{Using the points}\ (18, 3)\ \text{and}\ (33, 10)\)
| \(\text{Gradient at}\ A\) | \(=\dfrac{y_2-y_1}{x_2-x_1}\) |
| \(=\dfrac{10\ 000-3000}{33\ 000-18\ 000}\) | |
| \(=\dfrac{7000}{15\ 000}\) | |
| \(=\dfrac{7}{15}\ \ \ \ \text{… as required}\) |
c. \(\text{The gradient represents the tax applicable on each dollar}\)
| \(\text{Tax}\) | \(=\dfrac{7}{15}\ \text{of each dollar earned}\) |
| \(=46\frac{2}{3}\approx 47\ \text{cents per dollar earned (nearest whole number)}\) |
d. \(\text{Tax payable up to }$18\ 000 = $3000\)
\(\text{Tax payable on income between }$18\ 000\ \text{and }$33\ 000\)
\(=\dfrac{7}{15}(I-18\ 000)\)
| \(\therefore\ \text{Tax payable →}\ \ T\) | \(=3000+\dfrac{7}{15}(I-18\ 000)\) |
| \(=3000+\dfrac{7}{15} I-8400\) | |
| \(=\dfrac{7}{15}I-5400\) |
Clara is comparing the costs of two different ways of travelling to work.
Clara’s motor scooter uses one litre of fuel for every 22 km travelled. The cost of fuel is $2.24/L and the distance from her home to the work car park is 33 km. The cost of travelling by bus and light rail is $35.80 for 10 single trips.
Which way of travelling is cheaper and by how much? Support your answer with calculations. (2 marks)
--- 4 WORK AREA LINES (style=lined) ---
Blythe travels to France via the USA. She uses this graph to calculate her currency conversions.
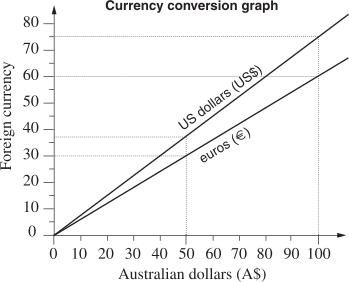
She converts all of her money to euros. How many euros does she have to spend in France? (3 marks)
--- 6 WORK AREA LINES (style=lined) ---
--- 2 WORK AREA LINES (style=lined) ---
Lisa’s motorbike uses fuel at the rate of 1.8 L per 100 km for long-distance driving and 2.3 L per 100 km for short-distance driving.
She used the motorbike to make a journey of 840 km, which included 108 km of short-distance driving.
Approximately how much fuel did Lisa’s motorbike use on the journey?
The weight of an object on the moon varies directly with its weight on Earth. An astronaut who weighs 63 kg on Earth weighs only 9 kg on the moon.
A lunar landing craft weighs 2449 kg when on the moon. Calculate the weight of this landing craft when on Earth. (2 marks)
--- 4 WORK AREA LINES (style=lined) ---
A cafe uses eight long-life light globes for 7 hours every day of the year. The purchase price of each light globe is $11.00 and they each cost \($f\) per hour to run.
--- 4 WORK AREA LINES (style=lined) ---
--- 2 WORK AREA LINES (style=lined) ---
--- 2 WORK AREA LINES (style=lined) ---
Mary-Anne knows that
• one Australian dollar (AUD) is worth 0.64 euros, and
• one Canadian dollar (CAD) is worth 0.97 euros.
Mary-Anne changes 75 AUD to Canadian dollars.
How many Canadian dollars will she get?
Bonn’s car uses fuel at the rate of 6.1 L /100 km for country driving and 8.3 L /100 km for city driving. On a trip, he drives 350 km in the country and 40 km in the city.
Calculate the amount of fuel he used on this trip. (2 marks)
--- 4 WORK AREA LINES (style=lined) ---
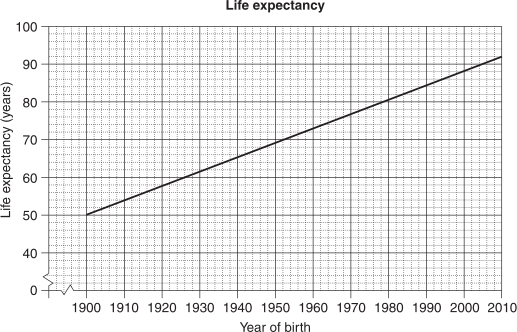
The graph shows the life expectancy of people born between 1900 and 2010.
--- 1 WORK AREA LINES (style=lined) ---
--- 4 WORK AREA LINES (style=lined) ---
The driving distance from Burt's home to his work is 15 km. He drives to and from work five times each week. His car uses fuel at the rate of 12 L/100 km.
How much fuel does he use driving to and from work each week?
The graph shows the relationship between infant mortality rate (deaths per 1000 live births) and life expectancy at birth (in years) for different countries.
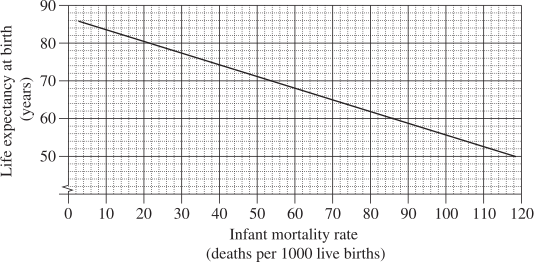
What is the life expectancy at birth in a country which has an infant mortality rate of 80?
\(\text{When infant mortality rate is 80, life expectancy}\)
\(\text{at birth is 62 years (see below).}\)
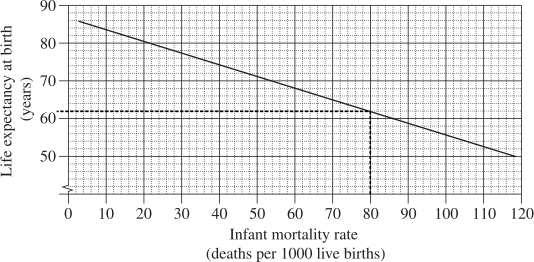
\(\Rightarrow D\)
Christopher is comparing two different models of 4WD cars. Car A uses fuel at the rate of 11.4 L/100 km. Car B uses 9.6 L/100 km.
Suppose Christopher plans on driving \(11\ 000\) km in the next year.
How much less fuel will he use driving car B instead of car A?
Last Friday, Jake had 98 marbles and Jack had 79 Marbles. On average, Jake wins 5 marbles per day and Jack loses 4 marbles per day.
If \(x\) represents the number of days since last Friday and \(y\) represents the number of marbles, which pair of equations model this situation?
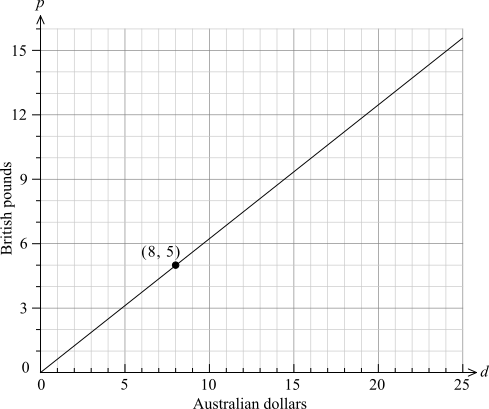
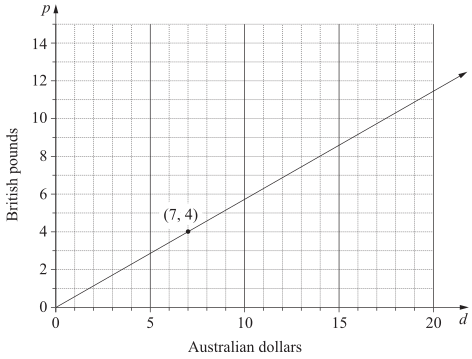
The relationship between British pounds \((p)\) and Australian dollars \((d)\) on a particular day is shown in the graph.
--- 2 WORK AREA LINES (style=lined) ---
Convert \(107\ 520\) Japanese yen to British pounds. (2 marks)
--- 4 WORK AREA LINES (style=lined) ---
The diagram shows a container which consists of a large hexagonal prism on top of a smaller hexagonal prism.
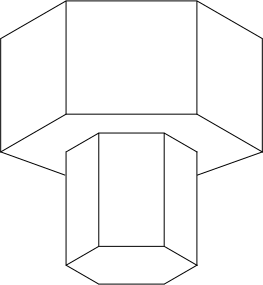
The container is filled with water at a constant rate into the top of the larger hexagonal prism.
The smaller prism is totally filled before the larger prism begins to fill.
It takes 5 minutes to fill the smaller cylinder.
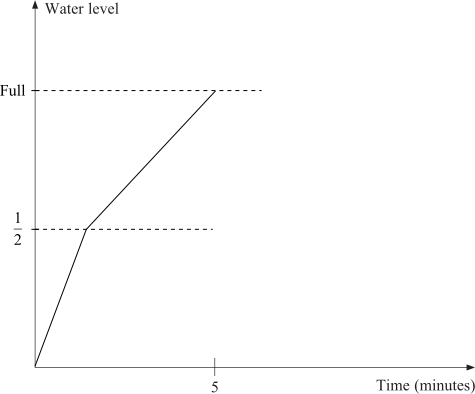
Draw a possible graph of the water level in the container against time. (2 marks)
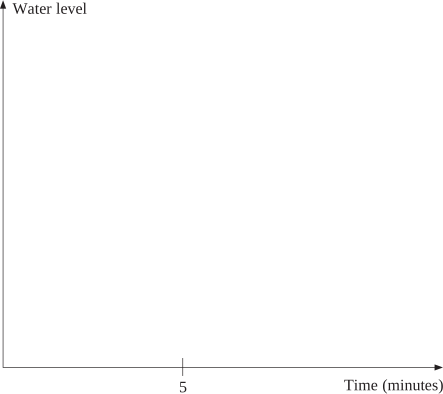
--- 0 WORK AREA LINES (style=lined) ---
An electrician charges a call-out fee of $75 as well as $1.50 per minute while working.
Suppose the electrician works for \(t\) hours.
Which equation expresses the amount the plumber charges ($\(C\)) as a function of time (\(t\) hours)?
The height of a bundle of photographic paper (\(H\) mm) varies directly with the number of sheets (\(N\)) of photographic paper that the bundle contains.
This relationship is modelled by the formula \(H=kN\), where \(k\) is a constant.
The height of a bundle containing 150 sheets of photographic paper is 2.7 centimetres.
--- 2 WORK AREA LINES (style=lined) ---
--- 4 WORK AREA LINES (style=lined) ---
The fuel consumption for a medium SUV vehicle is 7.2 litres/100 km. On a road trip, the SUV travels a distance of 1325 km and the fuel cost is $2.15 per litre.
What is the total fuel cost for the trip? (2 marks)
--- 5 WORK AREA LINES (style=lined) ---
Rhonda is 38 years old, and likes to keep fit by doing cross-fit classes.
--- 2 WORK AREA LINES (style=lined) ---
--- 4 WORK AREA LINES (style=lined) ---
The formula \(C=80n+b\) is used to calculate the cost of producing desktop computers, where \(C\) is the cost in dollars, \(n\) is the number of desktop computers produced and \(b\) is the fixed cost in dollars.
--- 2 WORK AREA LINES (style=lined) ---
--- 4 WORK AREA LINES (style=lined) ---
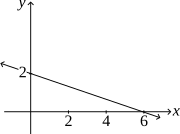
The line below has intercepts \(m\) and \(n\), where \(m\) and \(n\) are positive integers.
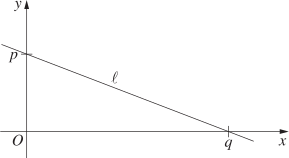
What is the gradient of the line?
Dots were used to create a pattern. The first three shapes in the pattern are shown.

The number of dots used in each shape is recorded in the table.
\begin{array} {|l|c|}
\hline
\rule{0pt}{2.5ex} \text{Shape $(S)$} \rule[-1ex]{0pt}{0pt} &\;\;\; 1 \;\;\; & \;\; \;2 \;\;\; & \;\;\; 3 \;\;\; \\
\hline
\rule{0pt}{2.5ex} \text{Number of dots $(N)$} \rule[-1ex]{0pt}{0pt} &\;\;\; 8 \;\;\; & \;\; \;10 \;\;\; & \;\; \;12\; \;\; \\
\hline
\end{array}
How many dots would be required for Shape 182?
If \(C=5x+4\), and \(x\) is increased by 3, what will be the corresponding increase in \(C\) ?
Sketch the graph of \(y+\dfrac{x}{3} = 2\), showing the intercepts on both axes. (2 marks)
--- 8 WORK AREA LINES (style=blank) ---
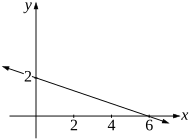
Which of the following is the graph of \(y=-3x-3\)?
| A. | 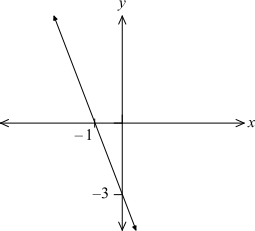 |
B. | 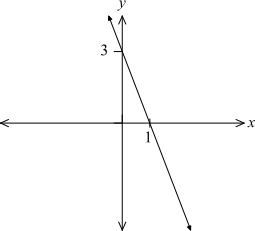 |
| C. | 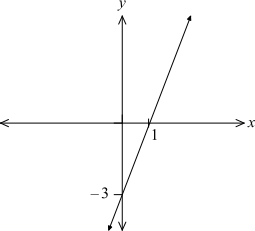 |
D. | 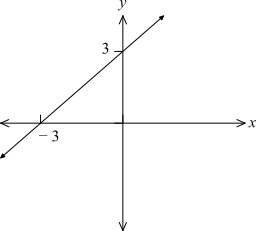 |
Art started to make this pattern of shapes using matchsticks.
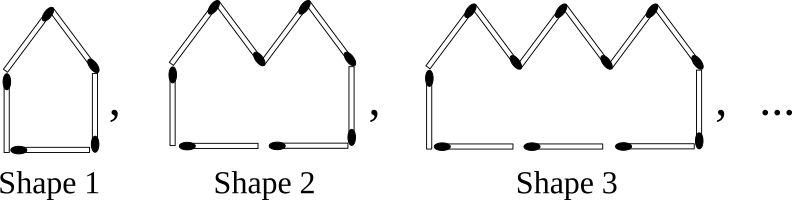
If the pattern of shapes is continued, which shape would use exactly 416 matchsticks?
Sticks were used to create the following pattern.
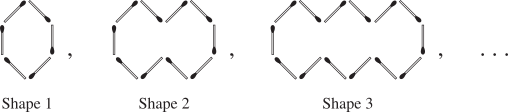
The number of sticks used is recorded in the table.
\begin{array} {|l|c|}
\hline
\rule{0pt}{2.5ex} \text{Shape $(S)$} \rule[-1ex]{0pt}{0pt} & \;\;\; 1 \;\;\; & \;\;\; 2 \;\;\; & \;\;\; 3 \;\;\; \\
\hline
\rule{0pt}{2.5ex} \text{Number of sticks $(N)$}\; \rule[-1ex]{0pt}{0pt} & \;\;\; 6 \;\;\; & \;\;\; 10 \;\;\; & \;\;\; 14 \;\;\; \\
\hline
\end{array}
--- 3 WORK AREA LINES (style=blank) ---
--- 3 WORK AREA LINES (style=lined) ---
Show suitable calculations to support your answer. (2 marks)
--- 5 WORK AREA LINES (style=lined) ---
a. \(\text{Shape 4 is shown below:}\)
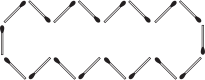
b. \(\text{Since}\ \ N=2+4S\)
| \(\text{If }S\) | \(=128\) |
| \(N\) | \(=2+(4\times 128)\) |
| \(=514\) |
| c. | \(609\) | \(=2+4S\) |
| \(4S\) | \(=607\) | |
| \(S\) | \(=151.75\) |
\(\text{Since}\ S\ \text{is not a whole number, 609 sticks}\)
\(\text{will not create a shape in this pattern.}\)
Which equation represents the relationship between \(x\) and \(y\) in this table?
\begin{array} {|c|c|c|}
\hline \ \ x\ \ & \ \ 0\ \ &\ \ 2\ \ & \ \ 4\ \ & \ \ 6\ \ & \ \ 8\ \ \\
\hline y & 3 & 4 & 5 & 6 & 7 \\
\hline \end{array}