Let `A = [(-2), (0)], B = [(0, 9)]` and `C = [2]`
Using these matrices, the matrix product that is not defined is
A. `AB`
B. `AC`
C. `BA`
D. `BC`
E. `CB`
Aussie Maths & Science Teachers: Save your time with SmarterEd
Let `A = [(-2), (0)], B = [(0, 9)]` and `C = [2]`
Using these matrices, the matrix product that is not defined is
A. `AB`
B. `AC`
C. `BA`
D. `BC`
E. `CB`
The matrix `[(12, 36), (0, 24)]` is equal to
| A. | `12[(0,3),(0,2)]` | B. | `12[(1,3),(0,2)]` |
| C. | `12[(0,24),(−12,12)]` | D. | `12[(0,24),(0,12)]` |
| E. | `12[(1,3),(−12,2)]` |
A small city is divided into four regions: Northern (`N`), Eastern (`E`), Southern (`S`) and Western (`W`).
The number of adult males (`M`) and the number of adult females (`F`) living in each of the regions in 2013 is shown in matrix `V` below.
`{:(qquadqquadqquadqquadMqquadqquadF),(V = [(1360,1460), (1680,1920), (900,1060), (1850,1770)]):}{:(),(N), (E), (S), (W):}`
--- 1 WORK AREA LINES (style=lined) ---
--- 1 WORK AREA LINES (style=lined) ---
--- 2 WORK AREA LINES (style=lined) ---
An election is to be held in the city.
All of the adults in each of the regions of the city will vote in the election.
One of the election candidates, Ms Aboud, estimates that she will receive 45% of the male votes and 55% of the female votes in the election.
This information is shown in matrix `P` below.
`P = [(0.45), (0.55)]{:(M), (F):}`
--- 2 WORK AREA LINES (style=lined) ---
The product of matrices `V` and `P` is shown below.
`V xx P = [(1360 1460), (1680 1920), ( 900 1060), (1850 1770)] xx [(0.45),(0.55)] = [(w), (1812), (988), (1806)]`
--- 2 WORK AREA LINES (style=lined) ---
--- 2 WORK AREA LINES (style=lined) ---
The cost, `C`, in dollars, of making `n` phones, is shown by the line in the graph below.

a.i. `text{Using (0, 20 000) and (300, 35 000)}`
| `text(Gradient)` | `= (y_2 – y_1)/(x_2 – x_1)` |
| `= (35\ 000 – 20\ 000)/(300 – 0)` | |
| `= 50` |
a.ii. `C = 50n + 20\ 000`
| b.i. |  |
| b.ii. | `54\ 000` | `= 150n` |
| `:. n` | `= (54\ 000)/150` | |
| `= 360` |
`:. 360\ text(planes need to be sold.)`
c. `text(Breakeven occurs when)`
| `text(Revenue)` | `=\ text(C)text(osts)` |
| `150n` | `= 50n + 20\ 000` |
| `100n` | `= 20\ 000` |
| `:. n` | `= 200\ text(phones)` |
`OABCD` has three triangular sections, as shown in the diagram below.
Triangle `OAB` is a right-angled triangle.
Length `OB` is 10 m and length `OC` is 14 m.
Angle `AOB` = angle `BOC` = angle `COD` = 30°

Write your answer, in metres, correct to two decimal places. (1 mark)
Write your answer, in m², correct to one decimal place. (1 mark)
The area of triangle `OBC` is 35 m².
Find the area of triangle `OCD`, in m². (2 marks)
Write your answer, correct to the nearest degree. (2 marks)
A rectangular block of land has width 50 metres and length 85 metres.
Write your answer in m². (1 mark)
In order to build a house, the builders dig a hole in the block of land.
The hole has the shape of a right-triangular prism, `ABCDEF`.
The width `AD` = 20 m, length `DC` = 25 m and height `EC` = 4 m are shown in the diagram below.

Write your answer in m³. (1 mark)
Once the right-triangular prism shape has been dug, a fence will be placed along the two sloping edges, `AF` and `DE`, and along the edges `AD` and `FE`.

Write your answer, in metres, correct to one decimal place. (1 mark)
| a. | `text(Area)` | `= 50 xx 85` |
| `= 4250\ text(m²)` |
| b. | `V` | `= Ah` |
| `A` | `= 1/2 xx 4 xx 25` | |
| `= 50\ text(m²)` |
| `:. V` | `= 50 xx 20` |
| `= 1000\ text(m³)` |
c. `text(Using Pythagoras in)\ DeltaECD,`

| `ED` | `= sqrt(25^2 + 4^2)` |
| `= sqrt(641)` | |
| `= 25.317…` |
`:.\ text(Total length of fencing)`
`= 2 xx 20 + 2 xx 25.317…`
`= 90.635…`
`= 90.6\ text(m)`
Hugo is a professional bike rider. The value of his bike will be depreciated over time using the flat rate method of depreciation. The graph below shows his bike’s initial purchase price and its value at the end of each year for a period of three years. --- 1 WORK AREA LINES (style=lined) --- --- 3 WORK AREA LINES (style=lined) --- --- 4 WORK AREA LINES (style=lined) --- The unit cost method of depreciation can also be used to depreciate the value of the bike. In a two-year period, the total depreciation calculated at $0.25 per kilometre travelled will equal the depreciation calculated using the flat rate method of depreciation as described above. --- 5 WORK AREA LINES (style=lined) ---

Assume that the bike’s value continues to depreciate by $1500 each year.
Determine its value five years after it was purchased. (1 mark)
Students at the camp can participate in two different watersport activities: canoeing and surfing.
The cost of canoeing is $30 per hour and the cost of surfing is $20 per hour.
The budget allows each student to spend up to $200, in total, on watersport activities.
The way in which a student decides to spend the $200 is described by the following inequality.
30 × hours canoeing + 20 × hours surfing ≤ 200
Calculate the maximum number of hours she could spend surfing. (1 mark)
If he spent a total of $200 on these activities, determine the maximum number of hours he could spend on each activity. (1 mark)
The distance-time graph below shows the first two stages of a bus journey from a school to a camp.

The third stage of the journey is missing from the graph.
During stage 3, the bus continued its journey to the camp and travelled at a constant speed of 60 km/h for one hour.
Write your answer in kilometres per hour. (1 mark)
The distance, `D` km, of the bus from the school, `t` hours after departure is given by
`D = {(100t 0 ≤ t ≤ 1.5), (150 1.5 ≤ t ≤ 2), (60t + k 2≤ t ≤ 3):}`
a. `text(100 km/hr)`
b. `text(30 minutes)`
| c. |  |
d. `text(Average speed over 3 hours)`
`= (text(Total distance))/3`
`= 210/3`
`= 70\ text(km/hr)`
e. `text(When)\ t = 2,`
`D = 150,\ text(and)`
`D = 60 xx 2 + k`
| `:. 120 + k` | `= 150` |
| `:. k` | `= 30` |
A spectator, `S`, in the grandstand of an athletics ground is 13 m vertically above point `G`.
Competitor `X`, on the athletics ground, is at a horizontal distance of 40 m from `G`.

Competitor `X` is 40 m from `G` and competitor `Y` is 52 m from `G`.
The angle `XGY` is 113°.


a. `text(Using Pythagoras:)`
| `SX^2` | `= 40^2 + 13^2` |
| `= 1769` | |
| `:. SX` | `= 42.05…` |
| `= 42\ text{m (nearest m)}` |
b.i. `text(Using the cosine rule:)`
| `XY^2` | `= 40^2 + 52^2 – 52^2 xx 40 xx 52cos113^@` |
| `= 5929.44…` | |
| `:. XY` | `= 77.00…` |
| `= 77\ text{m (nearest m)}` |
b.ii. `text(Using the sine rule:)`
| `text(Area)` | `= 1/2ab sinC` |
| `= 1/2 xx 40 xx 52 xx sin113^@` | |
| `= 957.32…` | |
| `= 957\ text{m² (nearest m²)}` |
| c. |  |
| `theta` | `= text(angle of elevation of)\ S\ text(from)\ Y` |
| `tantheta` | `= 13/52` |
| `:. theta` | `= tan^(−1)\ 1/4` |
| `= 14.036…` | |
| `= 14^@\ \ text{(nearest degree)}` |
A sponsor of the cricket club has invested $20 000 in a perpetuity. The annual interest from this perpetuity is $750. The interest from the perpetuity is given to the best player in the club every year, for a period of 10 years. --- 3 WORK AREA LINES (style=lined) --- --- 1 WORK AREA LINES (style=lined) --- --- 3 WORK AREA LINES (style=lined) --- --- 3 WORK AREA LINES (style=lined) ---
What is the 2014 value of cricket equipment that could be bought for $750 in 2024? Write your answer, correct to the nearest dollar. (1 mark)
Fastgrow and Booster are two tomato fertilisers that contain the nutrients nitrogen and phosphorus.
The amount of nitrogen and phosphorus in each kilogram of Fastgrow and Booster is shown in the table below.

Arthur is a farmer who grows tomatoes.
He mixes quantities of Booster and Fastgrow to make his own fertiliser.
Let `x` be the number of kilograms of Booster in Arthur’s fertiliser.
Let `y` be the number of kilograms of Fastgrow in Arthur’s fertiliser.
Inequalities 1 to 4 represent the nitrogen and phosphorus requirements of Arthur’s tomato field.
| Inequality 1 | `x` | `≥ 0` |
| Inequality 2 | `y` | `≥ 0` |
| Inequality 3 (nitrogen) | `0.05x + 0.05y` | `≥ 200` |
| Inequality 4 (phosphorus) | `0.02x + 0.06y` | `≥ 120` |
Arthur’s tomato field also requires at least 180 kg of the nutrient potassium.
Each kilogram of Booster contains 0.06 kg of potassium.
Each kilogram of Fastgrow contains 0.04 kg of potassium.
Write down Inequality 5 in terms of `x` and `y`. (1 mark)
The lines that represent the boundaries of Inequalities 3, 4 and 5 are shown in the graph below.

(Answer on the graph above.)
Arthur would like to use the least amount of his own fertiliser to meet the nutrient requirements of his tomato field and still satisfy Inequalities 1 to 5.
(Answer on the graph above.)
a. `text(Phosphorous in 2 kg of Booster)`
`=0.02× 2`
`= 0.04\ text(kg)`
b. `text(Total Phosphorous)`
`=0.05×100 + 0.05× 400`
`= 25\ text(kg)`
c. `text(Inequality 5,)`
`0.06x + 0.04y >= 180`
d.i. `text(Line)\ A\ text(is the boundary of Inequality 4.)`
`:.\ text(It can be expressed)`
`0.02x + 0.06y = 120`
| d.ii. |
|
e.i. `text(The minimum amount is on the boundary)`
`x+y=4000`
`:.\ text(Arthur will have to make at least 4000 kg.)`
e.ii. `text(All points on the bold line are solutions,)`
`text{including (1000, 3000) and (3000, 1000).}`

Jane and Michael decide to set up an annual music scholarship.
To fund the scholarship, they invest in a perpetuity that pays interest at a rate of 3.68% per annum.
The interest from this perpetuity is used to provide an annual $460 scholarship.
--- 3 WORK AREA LINES (style=lined) ---
--- 1 WORK AREA LINES (style=lined) ---
Jane and Michael have started a business that provides music at parties.
The business charges customers $88 per hour.
The $88 per hour includes a 10% goods and services tax (GST).
Jane and Michael’s first booking was a party where they provided music for four hours.
After six months of regular work, Jane and Michael decided to increase the hourly rate they charge by 12.5%.
The airline that Ben uses to travel to Japan charges for the seat and luggage separately.
The charge for luggage is based on the weight, in kilograms, of the luggage.
If the luggage is paid for at the airport, the graph below can be used to determine the cost, in dollars, of luggage of a certain weight, in kilograms.

If the luggage is paid for online prior to arriving at the airport, the equation for the relationship between the online cost, in dollars, and the weight, in kilograms, would be
`text(online cost) = {{:(75),(22.5 xx text(weight) - 375):} qquad {:(\ \ 0 < text(weight) <= 20),(20 < text(weight ≤ 40)):} :}`
(Answer on the graph above.)

a. `$250`
| b. | `text(Online cost)` | `= 22.5 xx 30 – 375` |
| `= 300\ text(dollars)` |
| c. | `text{Online cost (40 kg)}` | `= 22.5 xx 40 – 375` |
| `= 525` |
`:.\ text(End points are)\ \ (0, 75) and (40, 525)`
d. `text(From the graph, the intersection`
`text(occurs when)`
| `22.5 xx text(weight) – 375` | `= 250` |
| `text(weight)` | `= 625/22.5` |
| `= 27.77…` | |
| `= 27.8\ text(kg)` |
The graph below shows the relationship between the yen and the dollar on the same day at a different currency exchange agency.

The points `(100, 8075)` and `(200, 17\ 575)` are labelled.
The equation for the relationship between the yen and the dollar is
yen = 95 × dollars – k
Ben will use a currency exchange agency to buy some Japanese yen (the Japanese currency unit).
The graph below shows the relationship between Japanese yen and Australian dollars on a particular day.
This graph can be used to calculate a conversion between dollars and yen on that day.

How many yen does he receive for $200? (1 mark)
How many yen will Ben receive for each dollar? (1 mark)
Ben is flying to Japan for a school cultural exchange program.
The graph below shows the cost of a particular flight to Japan, in dollars, on each day in February.

In a controlled experiment, Juan took some medicine at 8 pm. The concentration of medicine in his blood was then measured at regular intervals. The concentration of medicine in Juan’s blood is modelled by the function `c(t) = 5/2 te^(-(3t)/2), t >= 0`, where `c` is the concentration of medicine in his blood, in milligrams per litre, `t` hours after 8 pm. Part of the graph of the function `c` is shown below.

--- 2 WORK AREA LINES (style=lined) ---
--- 2 WORK AREA LINES (style=lined) ---
--- 3 WORK AREA LINES (style=lined) ---
--- 5 WORK AREA LINES (style=lined) ---
--- 3 WORK AREA LINES (style=lined) ---
Alicia took part in a similar controlled experiment. However, she used a different medicine. The concentration of this different medicine was modelled by the function `n(t) = Ate^(-kt),\ t >= 0` where `A` and `k in R^+`.
--- 6 WORK AREA LINES (style=lined) ---
On 1 January 2010, Tasmania Jones was walking through an ice-covered region of Greenland when he found a large ice cylinder that was made a thousand years ago by the Vikings.
A statue was inside the ice cylinder. The statue was 1 m tall and its base was at the centre of the base of the cylinder.

The cylinder had a height of `h` metres and a diameter of `d` metres. Tasmania Jones found that the volume of the cylinder was 216 m³. At that time, 1 January 2010, the cylinder had not changed in a thousand years. It was exactly as it was when the Vikings made it.
--- 4 WORK AREA LINES (style=lined) ---
--- 3 WORK AREA LINES (style=lined) ---
Tasmania found that the Vikings made the cylinder so that `S` is a minimum.
--- 5 WORK AREA LINES (style=lined) ---
--- 3 WORK AREA LINES (style=lined) ---
The population of wombats in a particular location varies according to the rule `n(t) = 1200 + 400 cos ((pi t)/3)`, where `n` is the number of wombats and `t` is the number of months after 1 March 2013.
--- 3 WORK AREA LINES (style=lined) ---
--- 2 WORK AREA LINES (style=lined) ---
--- 1 WORK AREA LINES (style=lined) ---
--- 6 WORK AREA LINES (style=lined) ---
Mani is a fruit grower. After his oranges have been picked, they are sorted by a machine, according to size. Oranges classified as medium are sold to fruit shops and the remainder are made into orange juice. The distribution of the diameter, in centimetres, of medium oranges is modelled by a continuous random variable, `X`, with probability density function `f(x) = {(3/4(x-6)^2(8-x), 6 <= x <= 8), (\ \ \ \ \ \ \ 0, text(otherwise)):}` --- 5 WORK AREA LINES (style=lined) --- --- 5 WORK AREA LINES (style=lined) --- --- 3 WORK AREA LINES (style=lined) --- For oranges classified as large, the quantity of juice obtained from each orange is a normally distributed random variable with a mean of 74 mL and a standard deviation of 9 mL. --- 5 WORK AREA LINES (style=lined) --- Mani also grows lemons, which are sold to a food factory. When a truckload of lemons arrives at the food factory, the manager randomly selects and weighs four lemons from the load. If one or more of these lemons is underweight, the load is rejected. Otherwise it is accepted. It is known that 3% of Mani’s lemons are underweight. --- 5 WORK AREA LINES (style=lined) --- --- 5 WORK AREA LINES (style=lined) ---
Harry operates a mobile pet care service. The call-out fee charged depends on the distance he has to travel to tend to a pet. The call-out fees for distances up to 30 km are shown on the graph below.

A call-out fee of $50 is charged to travel distances of more than 30 km but less than or equal to 40 km.

a.i. `$30`
a.ii. `text(5 km)`
| b. | |
Let `f: R -> R,\ \ f(x) = 1/5 (x-2)^2 (5-x)`. The point `P(1, 4/5)` is on the graph of `f`, as shown below.
The tangent at `P` cuts the y-axis at `S` and the x-axis at `Q.`

--- 3 WORK AREA LINES (style=lined) ---
--- 5 WORK AREA LINES (style=lined) ---
ii. Find the coordinates of points `Q` and `S`. (2 marks)
--- 6 WORK AREA LINES (style=lined) ---
--- 4 WORK AREA LINES (style=lined) ---

--- 4 WORK AREA LINES (style=lined) ---
A farmer owns a flat allotment of land in the shape of triangle `ABC` shown below.
Boundary `AB` is 251 metres.
Boundary `AC` is 142 metres.
Angle `BAC` is 45°.

A straight track, `XY`, runs perpendicular to the boundary `AC`.
Point `Y` is 55 m from `A` along the boundary `AC`.
Write your answer, in metres, correct to one decimal place. (1 mark)
Determine the bearing of `B` from `A`. (1 mark)
Write your answer, in metres, correct to one decimal place. (2 marks)
The length of the boundary `BC` is 181 metres (correct to the nearest metre).
A farmer plans to build a fence, `MN`, perpendicular to the boundary `AC`.
The land enclosed by triangle `AMN` will have an area of 3200 m².

| a. | `/_ AXY` | `= 180 – (90 + 45)` |
| `= 45^@` |
b. `text(In)\ Delta AXY,`
| `cos 45^@` | `= 55/(AX)` |
| `:. AX` | `= 55/(cos 45^@` |
| `= 77.78…` | |
| `= 77.8\ text{m (1 d.p.)}` |
| c. |  |
`text(Bearing of)\ B\ text(from)\ A`
`= 78 – 45`
`= 033^@`
| d. |  |
`text(Using the cosine rule,)`
| `XC^2` | `= 77.8^2 + 142^2 – 2 xx 77.8 xx 142 xx cos 45^@` |
| `= 10\ 593.17…` | |
| `:. XC` | `=sqrt (10\ 593.17…)` |
| `= 102.92…` | |
| `= 102.9\ text{m (1 d.p.)}` |
e. `text(Using sine rule,)`
| `text(Area)\ Delta ABC` | `= 1/2 bc sin A` |
| `= 1/2 xx 142 xx 251 xx sin 45^@` | |
| `= 12601.34…` | |
| `= 12\ 601\ text{m² (nearest m²)}` |
f.i. `text(Using the cosine rule,)`
| `BC^2` | `= 142^2 + 251^2 – 2 xx 142 xx 251 xx cos 45^@` |
| `= 32\ 759.60…` | |
| `:. BC` | `= 180.99…` |
| `= 181\ text{m (nearest m) … as required}` |
f.ii. `text(Using the cosine rule,)`
| `cos /_ ABC` | `= (251^2 + 181^2 – 142^2)/(2 xx 251 xx 181)` |
| `= 0.832…` | |
| `:. /_ ABC` | `= 33.69…` |
| `= 33.7^@\ text{(1 d.p.)}` |
g. `/_ AMN = 180 – (90 + 45) = 45^@`
`:. Delta AMN\ text(is isosceles.)`
| `text(Area)\ Delta AMN` | `= 1/2 xx AN xx MN` |
| `3200` | `= 1/2 xx MN xx MN\ (AN = MN)` |
| `MN^2` | `= 6400` |
| `:. MN` | `= 80\ text(m)` |
Question 1
Tessa is a student in a woodwork class.
The class will construct geometrical solids from a block of wood.
Tessa has a piece of wood in the shape of a rectangular prism.
This prism, `ABCDQRST`, shown in Figure 1, has base length 24 cm, base width 28 cm and height 32 cm.

On the front face of Figure 1, `ABRQ`, Tessa marks point `W` halfway between `Q` and `R` as shown in Figure 2 below. She then draws line segments `AW` and `BW` as shown.

Question 2
Tessa carves a triangular prism from her block of wood.
Using point `V`, halfway between `T` and `S` on the back face, `DCST`, of Figure 1, she constructs the triangular prism shown in Figure 3.

Question 3
Tessa's next task is to carve the right rectangular pyramid `ABCDY` shown in Figure 4 below.
She marks a new point, `Y`, halfway between points `W` and `V` in Figure 3. She uses point `Y` to construct this pyramid.

`text(Question 1)`
| a. | `QW` | `= 1/2 xx QR` |
| `= 1/2 xx 24` | ||
| `= 12\ text(cm)` |
| b. |  |
| `tan\ /_ WAQ` | `= 12/32` |
| `:. /_ WAQ` | `= tan^-1\ 3/8` |
| `= 20.55…` | |
| `= 20.6^@\ text{(1 d.p.)}` |
| c. | `/_ AWB` | `= 2 xx /_ WAG` |
| `= 2 xx 20.6` | ||
| `= 41.2^@\ text{(1 d.p.)}` |
| d. | `text(Area)\ ABRQ` | `= 24 xx 32` |
| `= 768\ text(cm²)` | ||
| `text(Area)\ Delta AWB` | `= 2 xx text(Area)\ Delta AQW` | |
| `= 2 xx 1/2 xx 12 xx 32` | ||
| `= 384\ text(cm²)` |
`:.\ text(Fraction of area)`
`= 384/768`
`= 1/2`
`text(Question 2)`
| a. |  |
`text(Using Pythagoras in)\ Delta AWX,`
| `AW` | `= sqrt (12^2 + 32^2)` |
| `= sqrt 1168` | |
| `= 34.176…` | |
| `= 34\ text{cm (nearest cm) … as required.}` |
b. `text(Total S.A. of triangular prism)`
`= text(area of base) + text(area of sides) + text(area of ends)`
`= 24 xx 28 + 2 xx (34 xx 28) + 2 xx (1/2 xx 24 xx 32)`
`= 672 + 1904 + 768`
`= 3344\ text(cm²)`
`text(Question 3)`
| a. | `V` | `= 1/3 xx b xx h` |
| `= 1/3 xx 24 xx 28 xx 32` | ||
| `= 7168\ text(cm³)` |
| b. |  |
`text(Using Pythagoras in)\ Delta ABC,`
| `AC` | `= sqrt (24^2 + 28^2)` |
| `= 36.878…` |
`text(Let)\ Z\ text(be the midpoint of)\ AC`
`:. AZ = (36.878…)/2 = 18.439…`

`text(Using Pythagoras in)\ Delta AYZ,`
| `AY` | `= sqrt (32^2 + (18.439…)^2)` |
| `= sqrt (1364)` | |
| `= 36.9…` | |
| `= 37\ text{cm (nearest cm) … as required}` |
c. `text(Using Heron’s formula,)`
| `s` | `= (37 + 37 + 24)/2=49` |
`:.\ text(Area of)\ Delta YAB`
`= sqrt (49 (49 – 24) (49 – 37) (49 – 37))`
`= sqrt (49 xx 25 xx 12 xx 12)`
`= 420\ text(cm²)`
Two subjects, Biology and Chemistry, are offered in the first year of a university science course.
The matrix `N` lists the number of students enrolled in each subject.
`N = [(460),(360)]{:(text(Biology)),(text(Chemistry)):}`
The matrix `P` lists the proportion of these students expected to be awarded an `A`, `B`, `C`, `D` or `E` grade in each subject.
`{:((qquadqquadqquadA,qquad\ B,qquadquadC,qquad\ D,qquadE)),(P = [(0.05,0.125,0.175,0.45,0.20)]):}`
--- 1 WORK AREA LINES (style=lined) ---
--- 3 WORK AREA LINES (style=lined) ---
--- 2 WORK AREA LINES (style=lined) ---
--- 2 WORK AREA LINES (style=lined) ---
--- 3 WORK AREA LINES (style=lined) ---
A tree, 12 m tall, is growing at point `T` near a shed.
The distance, `CT`, from corner `C` of the shed to the centre base of the tree is 13 m.

Write your answer, in degrees, correct to one decimal place. (1 mark)

`N` and `C` are two corners at the base of the shed. `N` is due north of `C`.
The angle, `TCN`, is 65°.
Explain your answer showing appropriate calculations. (2 marks)
| a. |  |
| `text(Let)\ \ theta` | `=\ text(angle of elevation)` |
| `= 12/13` | |
| `:. theta` | `= 42.709…` |
| `= 42.7^@\ text{(1 d.p.)}` |
| b. |  |
`text(Using the cosine rule:)`
| `NT^2` | `= 10^2 + 13^2 – 2 xx 10 xx 13 xx cos65^@` |
| `= 159.11…` | |
| `:. NT` | `= sqrt(159.11…)` |
| `= 12.61…` | |
| `= 12.6\ text{m (1 d.p.) … as required}` |
c. `text(Using the sine rule:)`
| `(sin /_ CNT)/13` | `= (sin 65^@)/12.6` |
| `sin /_ CNT` | `= (13 xx sin 65^@)/12.6` |
| `= 0.935…` | |
| `:. /_ CNT` | `= 69.24…` |
| `= 69^@\ text{(nearest degree)}` |
| d. |  |
`text(Bearing of)\ T\ text(from)\ N`
`= 180 – 69`
`= 111^@`
| e. |  |
`ST\ text(is the shortest distance between the)`
`text(tree and the shed.)`
`text(In)\ \ Delta NST,`
| `sin 69^@` | `= (ST)/12.6` |
| `:. ST` | `= 12.6 xx sin 69^@` |
| `= 11.76…\ text(m)` |
`:.\ text(S) text(ince the tree is 12 m, and 12 m) > 11.76\ text(m),`
`text(it could hit the shed if it falls.)`
The chicken coop has two spaces, one for nesting and one for eating.
The nesting and eating spaces are separated by a wall along the line `AX`, as shown in the diagrams below.

`DX = 3.16\ text(m), ∠ADX = 45^@ and ∠AXD = 60^@.`
Fill in the missing numbers below. (1 mark)

Write your answer in metres, correct to two decimal places. (1 mark)
Write your answer in square metres, correct to one decimal place. (1 mark)
The height of the chicken coop is 1.8 m.
Wire mesh will cover the roof of the eating space.
The area of the walls along the lines `AB, BC and CX` will also be covered with wire mesh.
Write your answer, correct to the nearest square metre. (2 mark)
| a. | `theta` | `= 180^@ − (45^@ + 60^@)` |
| `= 75^@` |
b. `(AX)/(sin 45^@) = (3.16)/(sin 75^@)`
| c. | `(AX)/(sin 45^@)` | `= (3.16)/(sin 75^@)` |
| `:. AX` | `= (3.16 xx sin45^@)/(sin 75^@)` | |
| `= 2.313…` | ||
| `=2.31\ text{m (2 d.p.)}` |
| d. | `text(Area of)\ \ ΔADX` | `= 1/2 xx b xx h` |
| `= 1/2 xx 3.16 xx 2` | ||
| `= 3.2\ text{m² (1 d.p.)}` |
| e. |  |
| `text(Roof area)` | `=1/2 xx BC xx (AB + XC)` |
| `= 1/2 xx 2 xx (3 + 1.84)` | |
| `= 4.84` |
| `text(Wall area)` | `= (1.8 xx 3) + (1.8 xx 2) + (1.8 xx 1.84)` |
| `= 12.312` |
| `:.\ text(Total area)` | `= 4.84 + 12.312` |
| `=17.152` | |
| `=17\ text{m² (nearest m²)}` |
The floor of a chicken coop is in the shape of a trapezium.
The floor, `ABCD`, and the chicken coop are shown below.

`AB = 3\ text(m), BC = 2\ text(m and)\ \ CD = 5\ text(m.)`
Write your answer in square metres. (1 mark)
Write your answer in metres, correct to one decimal place. (1 mark)
| a. | `A` | `=1/2 h (a+b)` |
| `= 1/2 xx 2 xx (3 + 5)` | ||
| `= 8\ text(m²)` |
| b. |  |
`text(Using Pythagoras,)`
| `AD^2` | `=sqrt(2^2+2^2)` |
| `=2.82…\ text(m)` |
| `:.\ text(Perimeter)` | `= 3 + 2 + 5 + 2.82…` |
| `= 12.8\ text{m (1 d.p.)}` |
A shed has the shape of a prism. Its front face, `AOBCD`, is shaded in the diagram below. `ABCD` is a rectangle and `M` is the mid point of `AB`.

One litre of paint will cover an area of 16 m².
| a. |  |
`text(In)\ Delta AOM,\ text(using Pythagoras:)`
| `OM` | `= sqrt (3.4^2 – 3^2)` |
| `= sqrt 2.56` | |
| `= 1.6\ text(m … as required)` |
b. `text(Area of front face of shed)`
`= text(Area)\ Delta AOB + text(Area)\ ABCD`
`= 1/2 xx 1.6 xx 6 + 2.2 xx 6`
`= 18\ text(m² … as required.)`
| c. | `V` | `= Ah` |
| `= 18 xx 10` | ||
| `= 180\ text(m³)` |
| d.i. | `text(Roof areas)` | `= 2(1/2 xx 1.6 xx 6 + 3.4 xx 10)` |
| `= 2 (4.8 + 34)` | ||
| `= 77.6\ text(m²)` | ||
| `text(Wall areas)` | `= 2 (2.2 xx 6 + 2.2 xx 10)` | |
| `= 2 (13.2 + 22)` | ||
| `= 70.4\ text(m²)` | ||
| `text(Floor area)` | `= 60\ text(m²)` |
`:.\ text(Total Area to be painted)`
`= 77.6 + 70.4 + 60`
`= 208\ text(m²)`
ii. `text(Litres of paint required)`
`= 208/16`
`= 13\ text(litres)`
A shed is built on a concrete slab. The concrete slab is a rectangular prism 6 m wide, 10 m long and 0.2 m deep.

The top surface of the concrete slab shaded in the diagram above has an area of 60 m².
A yacht, `Y`, is 7 km from a lighthouse, `L`, on a bearing of 210° as shown in the diagram below.


| a. | |
b. `text(Angle between)\ LY\ text(and)\ LF\ \ text{(from graph)}`
`= 30 + 45`
`= 75^@`
c. `text(Using the cosine rule,)`
| `FY^2` | `= 7^2 + 3^2 – 2 xx 7 xx 3 xx cos 75^@` |
| `= 47.129…` | |
| `:. FY` | `= 6.865…` |
| `= 6.87\ text{km (2 d.p.)}` |
d. `text(Bearing of)\ L\ text(from)\ F\ text{(from graph)}`
`= 360 – 45`
`= 315^@`
A ferry, `F`, is 400 metres from point `O` at the base of a 50 metre high cliff, `OC`.

Write your answer in degrees, correct to one decimal place. (1 mark)
Tasmania Jones is in Switzerland. He is working as a construction engineer and he is developing a thrilling train ride in the mountains. He chooses a region of a mountain landscape, the cross-section of which is shown in the diagram below.

The cross-section of the mountain and the valley shown in the diagram (including a lake bed) is modelled by the function with rule
`f(x) = (3x^3)/64-(7x^2)/32 + 1/2.`
Tasmania knows that `A (0, 1/2)` is the highest point on the mountain and that `C(2, 0)` and `B(4, 0)` are the points at the edge of the lake, situated in the valley. All distances are measured in kilometres.
--- 5 WORK AREA LINES (style=lined) ---
Tasmania’s train ride is made by constructing a straight railway line `AB` from the top of the mountain, `A`, to the edge of the lake, `B`. The section of the railway line from `A` to `D` passes through a tunnel in the mountain.
--- 4 WORK AREA LINES (style=lined) ---
--- 3 WORK AREA LINES (style=lined) ---
--- 2 WORK AREA LINES (style=lined) ---
In order to ensure that the section of the railway line from `D` to `B` remains stable, Tasmania constructs vertical columns from the lake bed to the railway line. The column `EF` is the longest of all possible columns. (Refer to the diagram above.)
--- 3 WORK AREA LINES (style=lined) ---
--- 2 WORK AREA LINES (style=lined) ---
Tasmania’s train travels down the railway line from `A` to `B`. The speed, in km/h, of the train as it moves down the railway line is described by the function.
`V: [0, 4] -> R, \ V(x) = k sqrt x-mx^2,`
where `x` is the `x`-coordinate of a point on the front of the train as it moves down the railway line, and `k` and `m` are positive real constants.
The train begins its journey at `A (0, 1/2)`. It increases its speed as it travels down the railway line.
The train then slows to a stop at `B(4, 0)`, that is `V(4) = 0.`
--- 3 WORK AREA LINES (style=lined) ---
--- 3 WORK AREA LINES (style=lined) ---
Tasmania is able to change the value of `m` on any particular day. As `m` changes, the relationship between `k` and `m` remains the same.
--- 4 WORK AREA LINES (style=lined) ---
--- 4 WORK AREA LINES (style=lined) ---
Trigg the gardener is working in a temperature-controlled greenhouse. During a particular 24-hour time interval, the temperature `(Ttext{°C})` is given by `T(t) = 25 + 2 cos ((pi t)/8), \ 0 <= t <= 24`, where `t` is the time in hours from the beginning of the 24-hour time interval.
--- 3 WORK AREA LINES (style=lined) ---
--- 2 WORK AREA LINES (style=lined) ---
--- 3 WORK AREA LINES (style=lined) ---
--- 3 WORK AREA LINES (style=lined) ---
Trigg is designing a garden that is to be built on flat ground. In his initial plans, he draws the graph of `y = sin(x)` for `0 <= x <= 2 pi` and decides that the garden beds will have the shape of the shaded regions shown in the diagram below. He includes a garden path, which is shown as line segment `PC.`

--- 3 WORK AREA LINES (style=lined) ---
--- 6 WORK AREA LINES (style=lined) ---
In further planning for the garden, Trigg uses a transformation of the plane defined as a dilation of factor `k` from the `x`-axis and a dilation of factor `m` from the `y`-axis, where `k` and `m` are positive real numbers.
--- 8 WORK AREA LINES (style=lined) ---
--- 3 WORK AREA LINES (style=lined) ---
a. `T_text(max)\ text(occurs when)\ \ cos((pit)/8) = 1,`
`T_text(max)= 25 + 2 = 27^@C`
`text(Max occurs when)\ \ t = 0, or 16\ text(h)`
| b. | `text(Period)` | `= (2pi)/(pi/8)` |
| `= 16\ text(hours)` |
c. `text(Solve:)\ \ 25 + 2 cos ((pi t)/8)=26\ \ text(for)\ t,`
| `t` | `= 8/3,40/3,56/3\ \ text(for)\ t ∈ [0,24]` |
| `t_text(min)` | `= 8/3` |
d. `text(Consider the graph:)`

| `text(Time above)\ 26 text(°C)` | `= 8/3 + (56/3-40/3)` |
| `= 8\ text(hours)` |
e.i. `(dy)/(dx) = cos(x)`
`text(At)\ x = (2pi)/3,`
| `(dy)/(dx)` | `= cos((2pi)/3)=-1/2` |
e.ii. `text(Solution 1)`
`text(Equation of)\ \ PC,`
| `y-sqrt3/2` | `=-1/2(x-(2pi)/3)` |
| `y` | `=-1/2 x +pi/3 +sqrt3/2` |
`PC\ \ text(passes through)\ \ (c,0),`
| `0` | `=-1/2 c +pi/3 + sqrt3/2` |
| `c` | `=sqrt3 + (2 pi)/3\ …\ text(as required)` |
`text(Solution 2)`
`text(Equating gradients:)`
| `- 1/2` | `= (sqrt3/2-0)/((2pi)/3-c)` |
| `-1` | `= sqrt3/((2pi-3c)/3)` |
| `3c-2pi` | `= 3sqrt3` |
| `3c` | `= 3 sqrt3 + 2pi` |
| `:. c` | `= sqrt3 + (2pi)/3\ …\ text(as required)` |
f.i. `X^{′} ((2pi)/3 m,0)qquadP^{′}((2pi)/3 m, sqrt3/2 k)qquadC^{′} ((sqrt3 + (2pi)/3)m, 0)`
| `X^{′}P^{′}` | `= 10` |
| `sqrt3/2 k` | `= 10` |
| `:. k` | `= 20/sqrt3` |
| `=(20sqrt3)/3` |
`X^{′}C^{′}=30`
| `((sqrt3 + (2pi)/3)m)-(2pi)/3 m` | `= 30` |
| `:. m` | `= 30/sqrt3` |
| `=10sqrt3` |
| f.ii. | `P^{′}((2pi)/3 m, sqrt3/2 k)` | `= P^{′}((2pi)/3 xx 10sqrt3, sqrt3/2 xx 20/sqrt3)` |
| `= P^{′}((20pisqrt3)/3,10)` |
The shaded region in the diagram below is the plan of a mine site for the Black Possum mining company.
All distances are in kilometres.
Two of the boundaries of the mine site are in the shape of the graphs of the functions
`f: R -> R,\ f(x) = e^x and g: R^+ -> R,\ g(x) = log_e (x).`

--- 2 WORK AREA LINES (style=lined) ---
--- 2 WORK AREA LINES (style=lined) ---
--- 2 WORK AREA LINES (style=lined) ---
--- 3 WORK AREA LINES (style=lined) ---
--- 3 WORK AREA LINES (style=lined) ---
--- 4 WORK AREA LINES (style=lined) ---
Tasmania Jones is in the jungle, searching for the Quetzalotl tribe’s valuable emerald that has been stolen and hidden by a neighbouring tribe. Tasmania has heard that the emerald has been hidden in a tank shaped like an inverted cone, with a height of 10 metres and a diameter of 4 metres (as shown below).
The emerald is on a shelf. The tank has a poisonous liquid in it.

--- 5 WORK AREA LINES (style=lined) ---
--- 5 WORK AREA LINES (style=lined) ---
The tank has a tap at its base that allows the liquid to run out of it. The tank is initially full. When the tap is turned on, the liquid flows out of the tank at such a rate that the depth, `h` metres, of the liquid in the tank is given by
`h = 10 + 1/1600 (t^3 - 1200t)`,
where `t` minutes is the length of time after the tap is turned on until the tank is empty.
--- 5 WORK AREA LINES (style=lined) ---
--- 5 WORK AREA LINES (style=lined) ---
From the moment the liquid starts to flow from the tank, find how long, in minutes, it takes until `h = 2`.
(Give your answer correct to one decimal place.) (2 marks)
--- 5 WORK AREA LINES (style=lined) ---
--- 5 WORK AREA LINES (style=lined) ---
--- 5 WORK AREA LINES (style=lined) ---
Let `f: R text(\{2}) -> R,\ f(x) = 1/(2x-4) + 3.`
--- 0 WORK AREA LINES (style=lined) ---

--- 1 WORK AREA LINES (style=lined) ---
--- 1 WORK AREA LINES (style=lined) ---
--- 2 WORK AREA LINES (style=lined) ---
--- 5 WORK AREA LINES (style=lined) ---
--- 4 WORK AREA LINES (style=lined) ---
--- 6 WORK AREA LINES (style=lined) ---

a. `text(Asymptotes:)`
`x = 2`
`y = 3`
b.i. `f^{′}(x) = (−2)/((2x-4)^2)`
b.ii. `text(Range) = (−∞,0), or R^-`
| b.iii. | `text(As)\ \ ` | `f^{′}(x) < 0quadtext(for)quadx ∈ R text(\{2})` |
| `f^{′}(x) != 0` |
`:. f\ text(has no stationary points.)`
c. `text(Point of tangency) = P(p,1/(2p-4) + 3)`
| `m_text(tang)` | `= f^{′}(p)` |
| `= (-2)/((2p-4)^2)` |
`text(Equation of tangent using:)`
| `y-y_1` | `= m(x-x_1)` |
| `y-(1/(2p-4) + 3)` | `= (-2)/((2p-4)^2)(x-p)` |
| `y-3` | `= (-2(x-p))/((2p-4)^2) + (2p-4)/((2p-4)^2)` |
| `(2p-4)^2(y-3)` | `=-2x + 2p + 2p-4` |
| `:. (2p-4)^2(y-3)` | `=-2x + 4p-4\ \ text(… as required)` |
d. `text(Substitute)\ \ (−1,7/2)\ text{into tangent (part c),}`
`text(Solve)\ \ (2p-4)^2(7/2-3) = −2(-1) + 4p-4\ \ text(for)\ p:`
`:. p = 1,\ text(or)\ 5`
`text(Substitute)\ \ p = 1\ text(and)\ p = 5\ text(into)\ \ P(p,1/(2p-4) + 3)`
`:. text(Coordinates:)\ (1,5/2)\ text(or)\ (5,19/6)`
e. `text(Determine transformations that that take)\ f -> g:`
`text(Dilate the graph of)\ \ f(x) = 1/(2x-4) + 3\ \ text(by a)`
`text(factor of 2 from the)\ \ ytext(-axis).`
`y = 1/(2(x/2)-4) + 3= 1/(x-4) + 3`
`text(Translate the graph 4 units to the left and 3)`
`text(units down to obtain)\ \ g(x).`
`text(Using the transformation matrix,)`
| `x^{′}` | `=ax+c` |
| `y^{′}` | `=y+d` |
`f -> g:\ \ 1/(2x-4) -> 1/(x^{′})`
`x^{′}=2x-4`
`=> a=2,\ \ c=-4`
`f -> g:\ \ y -> y^{′} + 3`
`y^{′}=y -3`
`=>\ \ d=-3`
Michael is preparing to hike through a national park.
He decides to make some trail mix to eat on the hike.
The trail mix consists of almonds and raisins.
The table below shows some information about the amout of carbohydrate and protein contained in each gram of almonds and raisins.

Michael wants to make some trail mix that contains 72 g of protein. He already has 320 g of almonds.
The trail mix Michael takes on his hike must satisfy his dietary requirements.
Let `x` be the weight, in grams, of almonds Michael puts into the trail mix.
Let `y` be the weight, in grams, of raisins Michael puts into the trail mix.
Inequalities 1 to 4 represents Michael's dietary requirements for the weight of carbohydrate and protein in the trail mix.
| Inequality 1 | `x >= 0` |
| Inequality 2 | `y >= 0` |
| Inequality 3 (carbohydrate) | `0.2x + 0.8y >= 192` |
| Inequality 4 (protein) | `0.2x + 0.04y <= 40` |
Michael also requires a minimum of 16 g of fibre in the trail mix.
Each gram of almonds contains 0.1 g of fibre.
Each gram of raisins contains 0.04 g of fibre.
Inequality 5 (fibre) _________________________ (1 mark)
The graphs of `0.2x + 0.8y = 192` and `0.2x + 0.04y = 40` are shown below.

Michael plans to carry at least 500 g of trail mix on his hike.
He would also like this trail mix to cantain the greatest possible weight of almonds.
The trail mix must satisfy all of Michael's dietary requirements.

| a. | `text(Carbohydrates)` | `= 180 xx 0.2 + 250 xx 0.8` |
| `= 236\ text(grams)` |
b. `text(Almond protein)`
`= 320 xx 0.2`
`= 64\ text(g)`
`=>\ text(8 grams of protein still required.)`
`:.\ text(Amount of raisins needed)`
`= 8/0.04`
`= 200\ text(g)`
c. `text(Inequality 5)`
`0.1x + 0.04y >= 16`
| d.i. & ii. | |
e. `text(Maximum weight to satisfy)`
`= 1000\ text(grams)`
f. `text(New constraint)`
`x + y >= 500`

`text(In the new feasible region, the maximum amount)`
`text(of almonds occurs at the intersection of)`
`x + y = 500\ text{ … (1)}`
`0.2x + 0.04y = 40\ text{ … (2)}`
`text(Substitute)\ \ y = 500 – x\ \ text{from (1) into (2)}`
| `0.2x + 0.04 (500 – x)` | `= 40` |
| `0.2x + 20 – 0.04x` | `= 40` |
| `0.16x` | `= 20` |
| `x` | `= 125` |
`:.\ text(Weight of almonds) = 125\ text(g)`
Rosa uses the following six-digit pin number for her bank account: 216342.
With her knowledge of matrices, she decides to use matrix multiplication to disguise this pin number.
First she writes the six digits in the 2 × 3 matrix `A`.
`A = [(2,6,4),(1,3,2)]`
Next she creates a new matrix by forming the matrix product, `C = BA`,
where `B = [(1,-1),(2,-1)]`
--- 3 WORK AREA LINES (style=lined) ---
Write down the new six-digit number that Rosa uses to disguise her pin number. (1 mark)
--- 2 WORK AREA LINES (style=lined) ---
--- 3 WORK AREA LINES (style=lined) ---
| a.i. | `C` | `= BA` |
| `= [(1,-1),(2,-1)][(2,6,4),(1,3,2)]` | ||
| `= [(1,3,2),(3,9,6)]` |
a.ii. `133926`
`text(The pattern in matrix)\ C\ text(is)`

| b. | `C` | `= BA` |
| `B^-1 C` | `= B^-1 B A` | |
| `:. A` | `= B^-1 C` |
Matrix `F` below shows the flight connections for an airline that serves four cities, Anvil (`A`), Berga (`B`), Cantor (`C`) and Dantel (`D`).
`{:(qquad qquad qquad qquad quad text(from)),((qquad qquad quad\ A,B,C,D)),(F = [(0\ ,1\ ,0\ ,0),(1,0,1,0),(0,0,0,1),(0,1,0,0)]):}{:(),(),(A),(B),(C),(D):}{:(),(qquad text(to)):}`
In this matrix, the `1` in column `C` row `B`, for example, indicates that, using this airline, you can fly directly from Cantor to Berga. The `0` in column `C` row `D`, for example, indicates that you cannot fly directly from Cantor to Dantel.
--- 0 WORK AREA LINES (style=lined) ---
--- 1 WORK AREA LINES (style=lined) ---
--- 3 WORK AREA LINES (style=lined) ---
--- 3 WORK AREA LINES (style=lined) ---
There are three candidates in the election: Ms Aboud (`A`), Mr Broad (`B`) and Mr Choi (`C`).
The election campaign will run for six months, from the start of January until the election at the end of June.
A survey of voters found that voting preference can change from month to month leading up to the election.
The transition diagram below shows the percentage of voters who are expected to change their preferred candidate from month to month.

--- 1 WORK AREA LINES (style=lined) ---
--- 1 WORK AREA LINES (style=lined) ---
In January, 12 000 voters are expected in the city. The number of voters in the city is expected to remain constant until the election is held in June.
The state matrix that indicates the number of voters who are expected to have a preference for each candidate in January, `S_1`, is given below.
`S_1 = [(6000), (3840), (2160)]{:(A), (B), (C):}`
--- 2 WORK AREA LINES (style=lined) ---
The information in the transition diagram has been used to write the transition matrix, `T`, shown below.
`{:(qquadqquadqquadqquadtext(this month)),(qquadqquadqquad{:(\ A,qquadB,qquadC):}),(T = [(0.75,0.10,0.20),(0.05,0.80,0.40),(0.20,0.10,0.40)]{:(A),(B),(C):}qquadtext(next month)):}`
--- 0 WORK AREA LINES (style=lined) ---
--- 2 WORK AREA LINES (style=lined) ---
--- 3 WORK AREA LINES (style=lined) ---
The ability level of students is assessed regularly and classified as beginner (`B`), intermediate (`I`) or advanced (`A`).
After each assessment, students either stay at their current level or progress to a higher level.
Students cannot be assessed at a level that is lower than their current level.
The expected number of students at each level after each assessment can be determined using the transition matrix, `T_1`, shown below.
`{:(qquad qquad text(before assessment)), (qquad qquad qquad quad {:(B, qquad quad I, quad A):}), (T_1 = [(0.50, 0, 0), (0.48, 0.80, 0), (0.02, 0.20, 1)] {:(B), (I), (A):} qquad text(after assessment)):}`
--- 2 WORK AREA LINES (style=lined) ---
Let matrix `S_n` be a state matrix that lists the number of students at beginner, intermediate and advanced levels after `n` assessments.
The number of students in the school, immediately before the first assessment of the year, is shown in matrix `S_0` below.
`S_0 = [(20), (60), (40)] {:(B), (I), (A):}`
--- 3 WORK AREA LINES (style=lined) ---
--- 1 WORK AREA LINES (style=lined) ---
Table 1 shows the heights (in cm) of three groups of randomly chosen boys aged 18 months, 27 months and 36 months respectively.

Write your answer correct to one decimal place. (1 mark)
--- 2 WORK AREA LINES (style=lined) ---
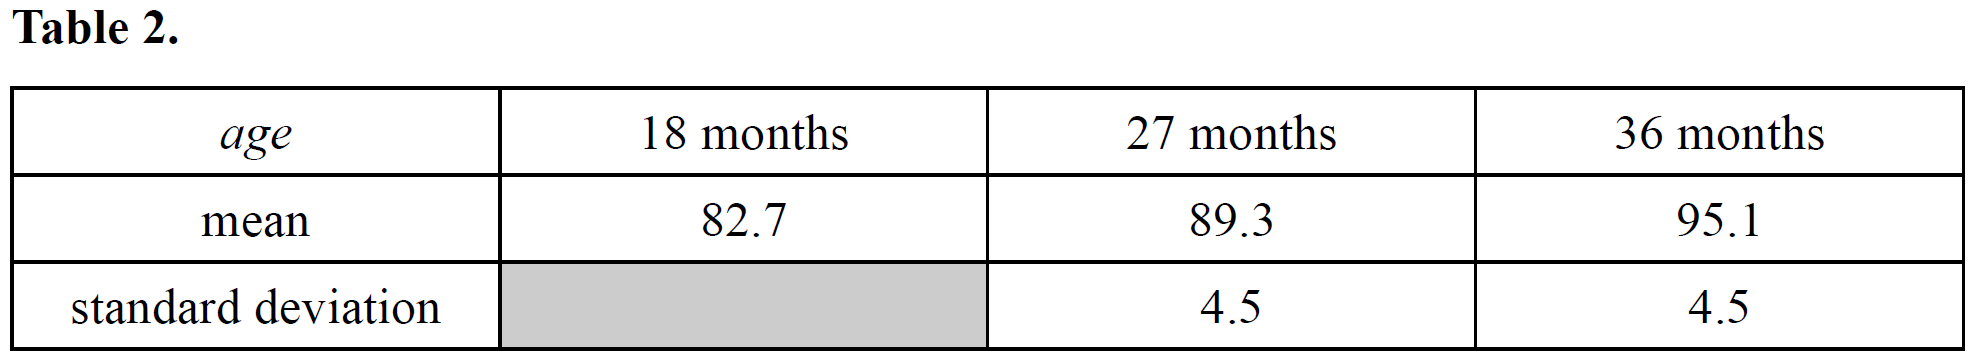
A 27-month-old boy has a height of 83.1 cm.
--- 2 WORK AREA LINES (style=lined) ---
The heights of the 36-month-old boys are normally distributed.
A 36-month-old boy has a standardised height of 2.
--- 2 WORK AREA LINES (style=lined) ---
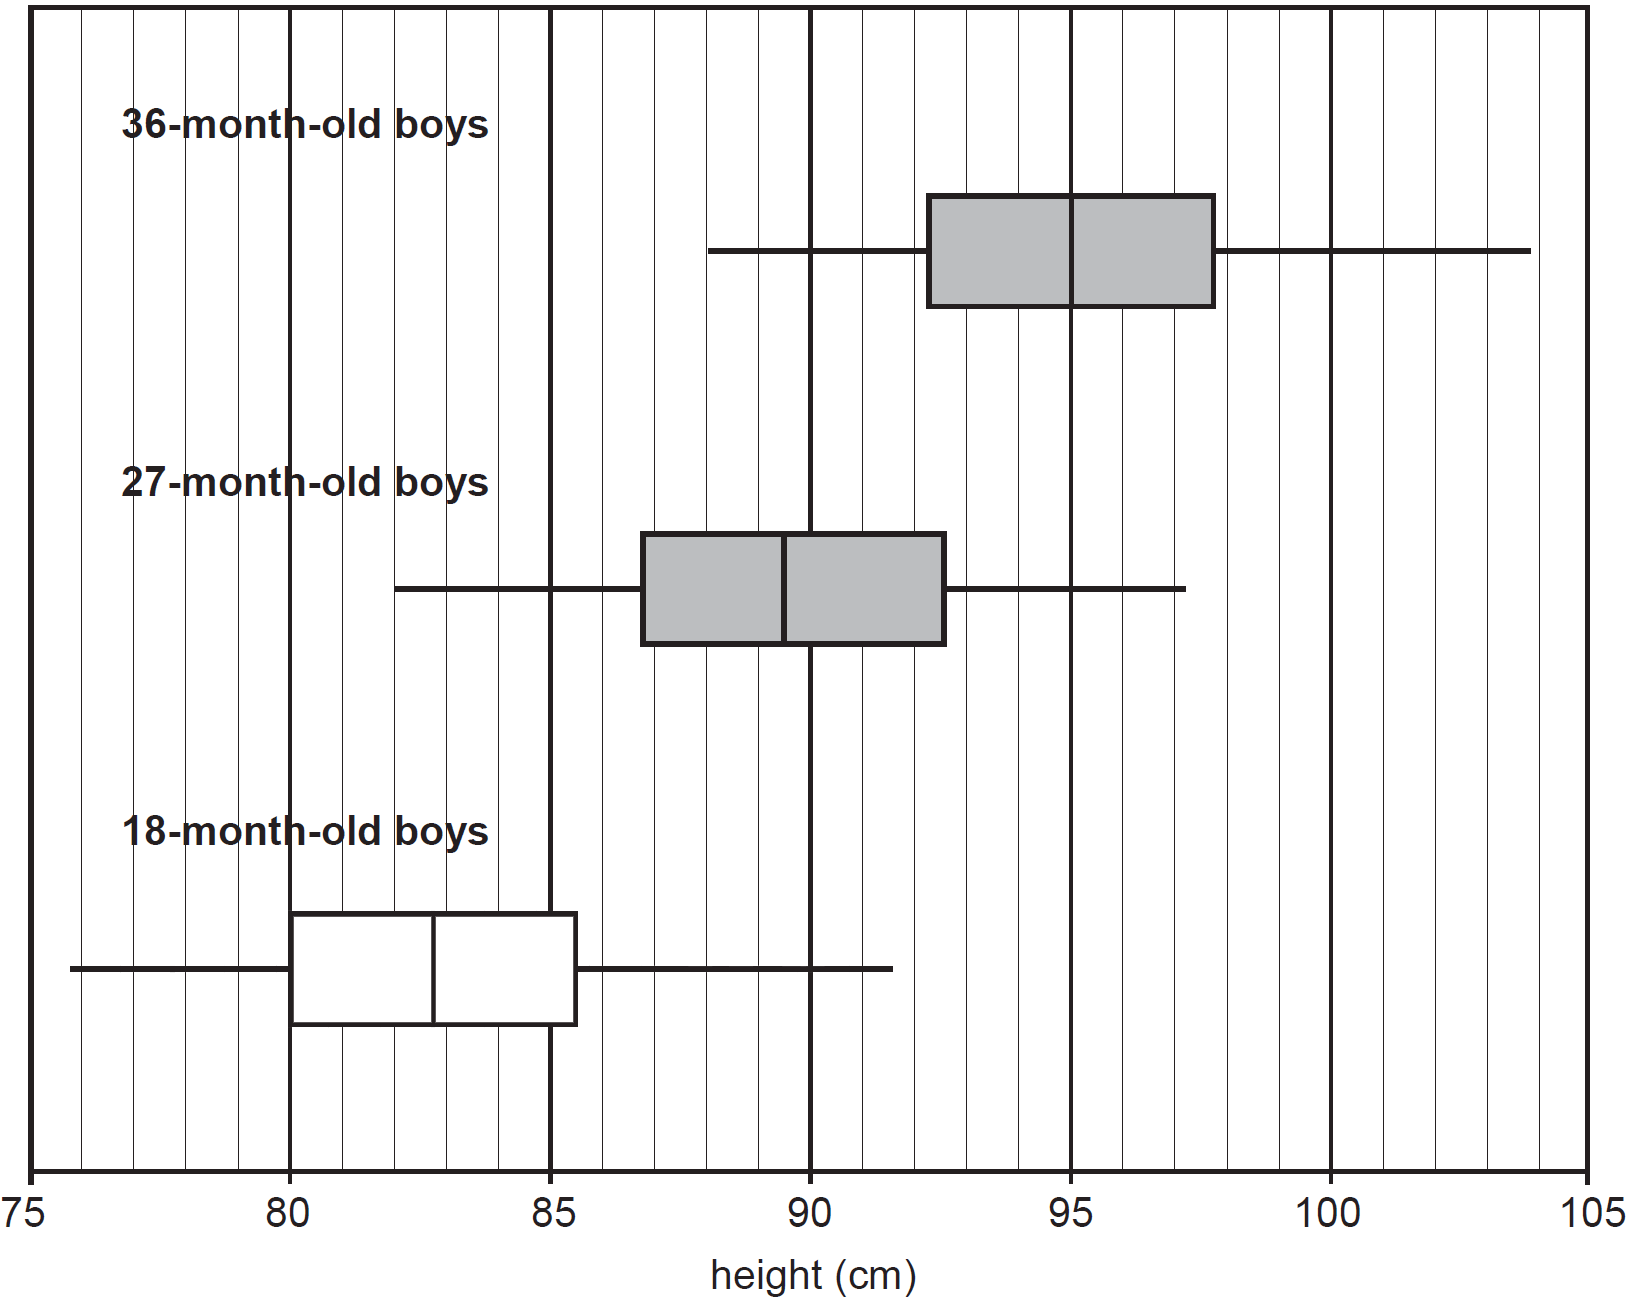
Using the data from Table 1, boxplots have been constructed to display the distributions of heights of 36-month-old and 27-month-old boys as shown below.

--- 0 WORK AREA LINES (style=lined) ---
--- 1 WORK AREA LINES (style=lined) ---
The three parallel boxplots suggest that height and age (18 months, 27 months, 36 months) are positively related.
--- 1 WORK AREA LINES (style=lined) ---
a. `text(By calculator,)`
`text(standard deviation) = 3.8`
| b. | `z` | `= (x – barx)/s` |
| `= (83.1 – 89.3)/(4.5)` | ||
| `=-1.377…` | ||
| `= -1.4\ \ text{(1 d.p.)}` |
c. `text{2.5% (see graph below)}`

d. `text(Range = 76 – 89.8,)\ Q_1 = 80,\ Q_3 = 85.8,\ text(Median = 83,)`
e. `89.5`
f. `text(The median height increases with age.)`
The table below displays the mean surface temperature (in °C) and the mean duration of warm spell (in days) in Australia for 13 years selected at random from the period 1960 to 2005.

This data set has been used to construct the scatterplot below. The scatterplot is incomplete.
--- 0 WORK AREA LINES (style=lined) ---
--- 2 WORK AREA LINES (style=lined) ---
--- 0 WORK AREA LINES (style=lined) ---
The residual plot below was constructed to test the assumption of linearity for the relationship between the variables mean duration of warm spell and the mean surface temperature.

--- 1 WORK AREA LINES (style=lined) ---
--- 1 WORK AREA LINES (style=lined) ---
--- 2 WORK AREA LINES (style=lined) ---
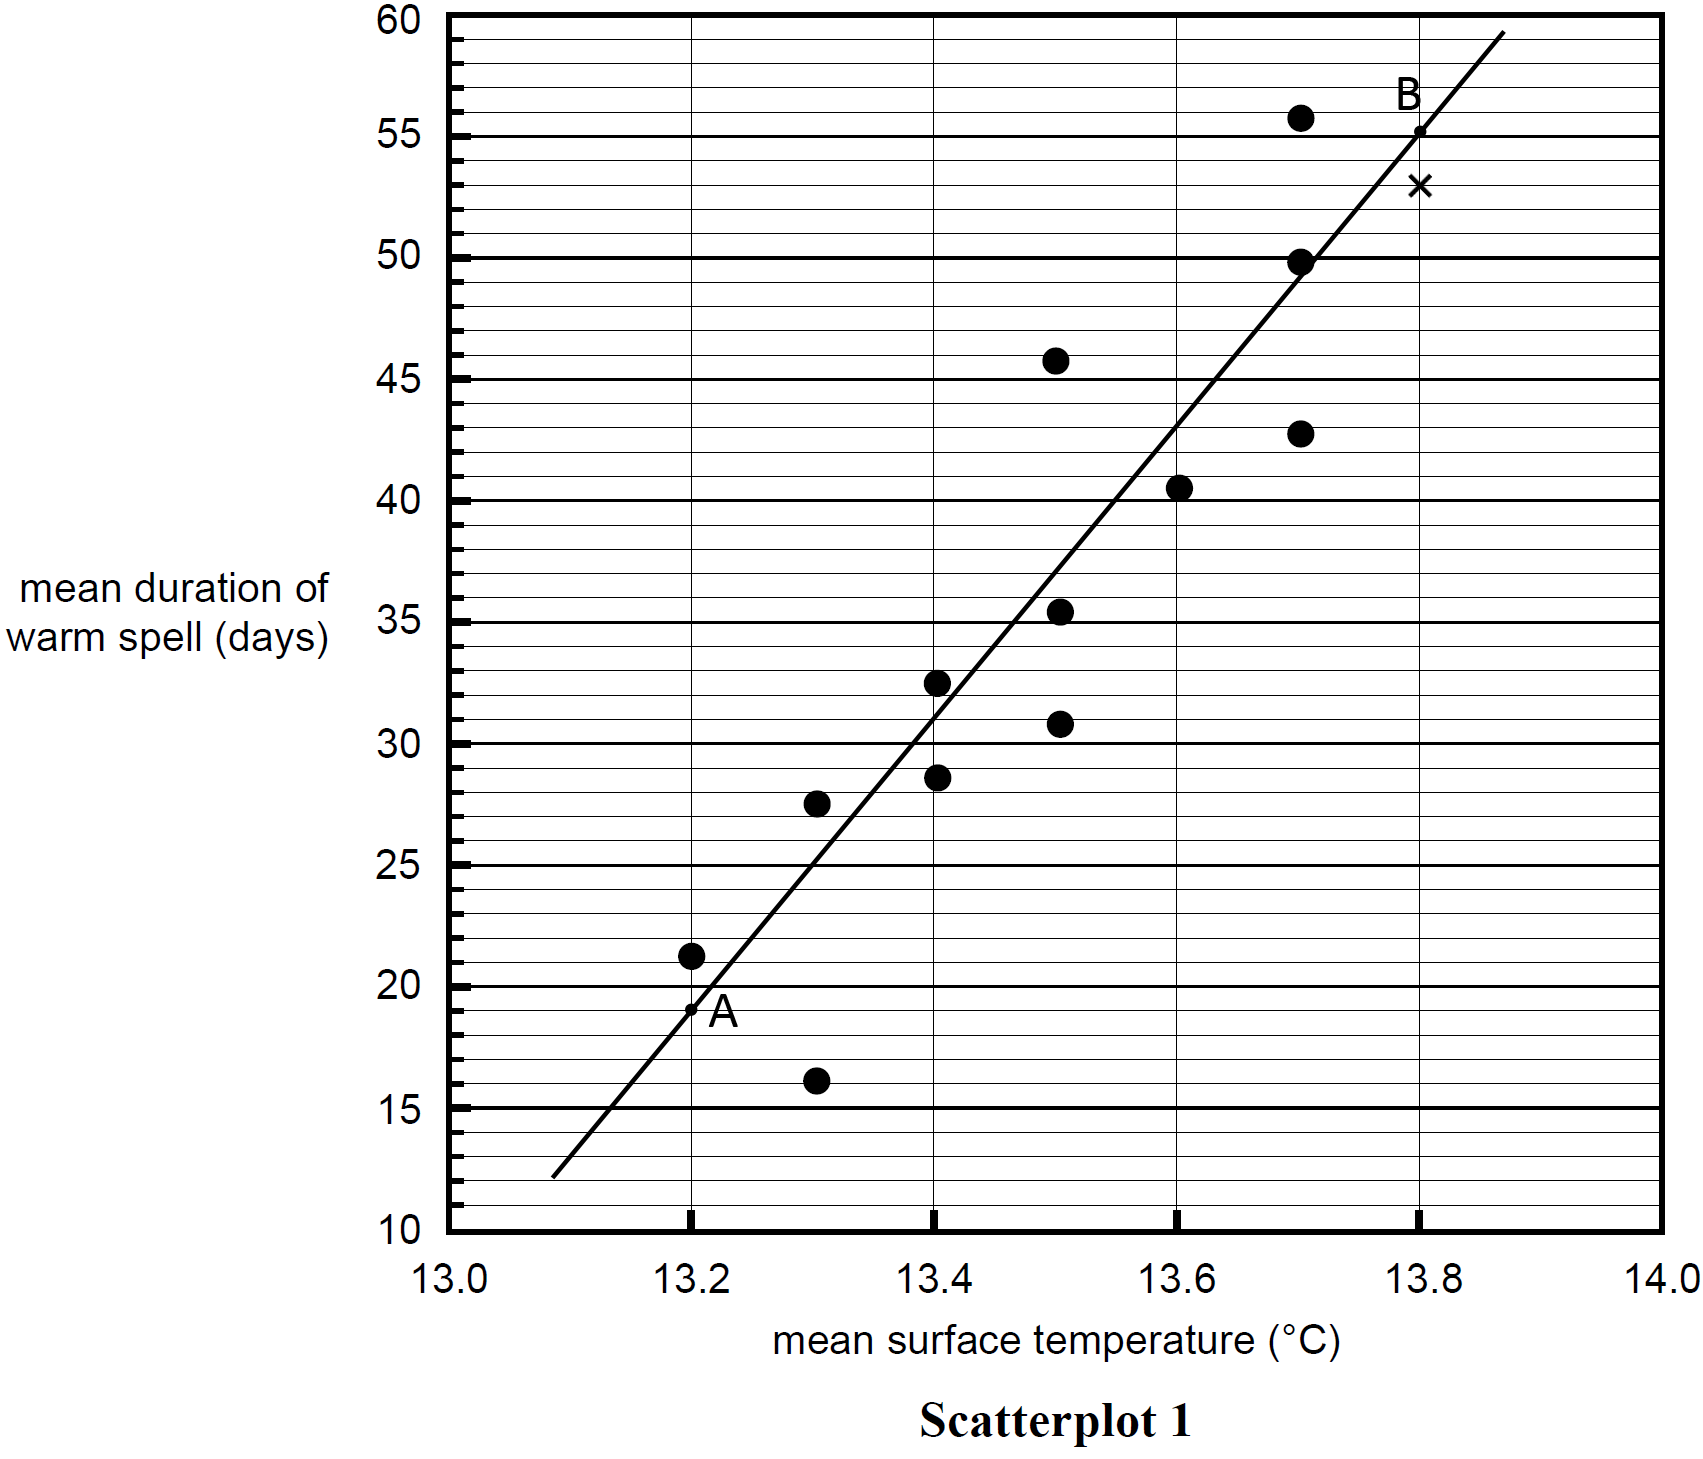
| a. | |
b.i. `text(Mean duration of warm spell)`
`= -776.9 + 60.3 xx text(mean surface temperature)`
b.ii. `text(Taking extreme points on the above graph,)`
`text(When)\ \ x = 13.2, \ y = -776.9 + 60.3 xx 13.2 = 19.06`
`:.\ text(Passes through)\ \ A (13.2, 19.06)`
`text(When)\ x = 13.8, y = -776.9 + 60.3 xx 13.8 = 55.24`
`:.\ text(Passes through)\ \ B (13.8, 55.24)`
`text(*See the regression line plotted above.)`
c. `text(Linearity is supported because there is no)`
`text(pattern to the residual data.)`
d. `text(By Calculator,)`
`r^2 = 0.828… = 83text{% (nearest %)}`
e. `text(Strong, positive, and linear.)`
The mean surface temperature (in °C) of Australia for the period 1960 to 2005 is displayed in the time series plot below.

--- 1 WORK AREA LINES (style=lined) ---
The least squares method is used to fit a trend line to the time series plot.
--- 1 WORK AREA LINES (style=lined) ---
--- 3 WORK AREA LINES (style=lined) ---
--- 2 WORK AREA LINES (style=lined) ---
The histogram below shows the distribution of mean yearly rainfall (in mm) for Australia over 103 years.

--- 1 WORK AREA LINES (style=lined) ---
--- 2 WORK AREA LINES (style=lined) ---
--- 3 WORK AREA LINES (style=lined) ---
The arm spans (in cm) were also recorded for each of the Years 6, 8 and 10 girls in the larger survey. The results are summarised in the three parallel box plots displayed below.

--- 0 WORK AREA LINES (style=lined) ---
--- 3 WORK AREA LINES (style=lined) ---
--- 5 WORK AREA LINES (style=lined) ---
In a larger survey, Years 6, 8 and 10 girls were asked what they did (walked, sat, stood, ran) for most of the time during a typical school lunch time. The results are displayed in the percentage segmented bar chart below.

Does the percentage segmented bar chart support the opinion that, for these girls, the lunch time activity (walked, sat or stood, ran) undertaken is associated with year level? Justify your answer by quoting appropriate percentages. (2 marks)
--- 5 WORK AREA LINES (style=lined) ---

`text(Yes. The table above shows that from year 6)`
`text(to year 8 to year 10, the percentage that ran)`
`text(changed from 78% to 40% to 10%.)`
--- 0 WORK AREA LINES (style=lined) ---

Using the appropriate seasonal index in Table 2, determine the deseasonalised value for the summer rainfall in 2008. Write your answer correct to the nearest millimetre. (1 mark)
--- 3 WORK AREA LINES (style=lined) ---
--- 2 WORK AREA LINES (style=lined) ---
The time series plot below shows the rainfall (in mm) for each month during 2008.

--- 1 WORK AREA LINES (style=lined) ---
--- 0 WORK AREA LINES (style=lined) ---
--- 3 WORK AREA LINES (style=lined) ---
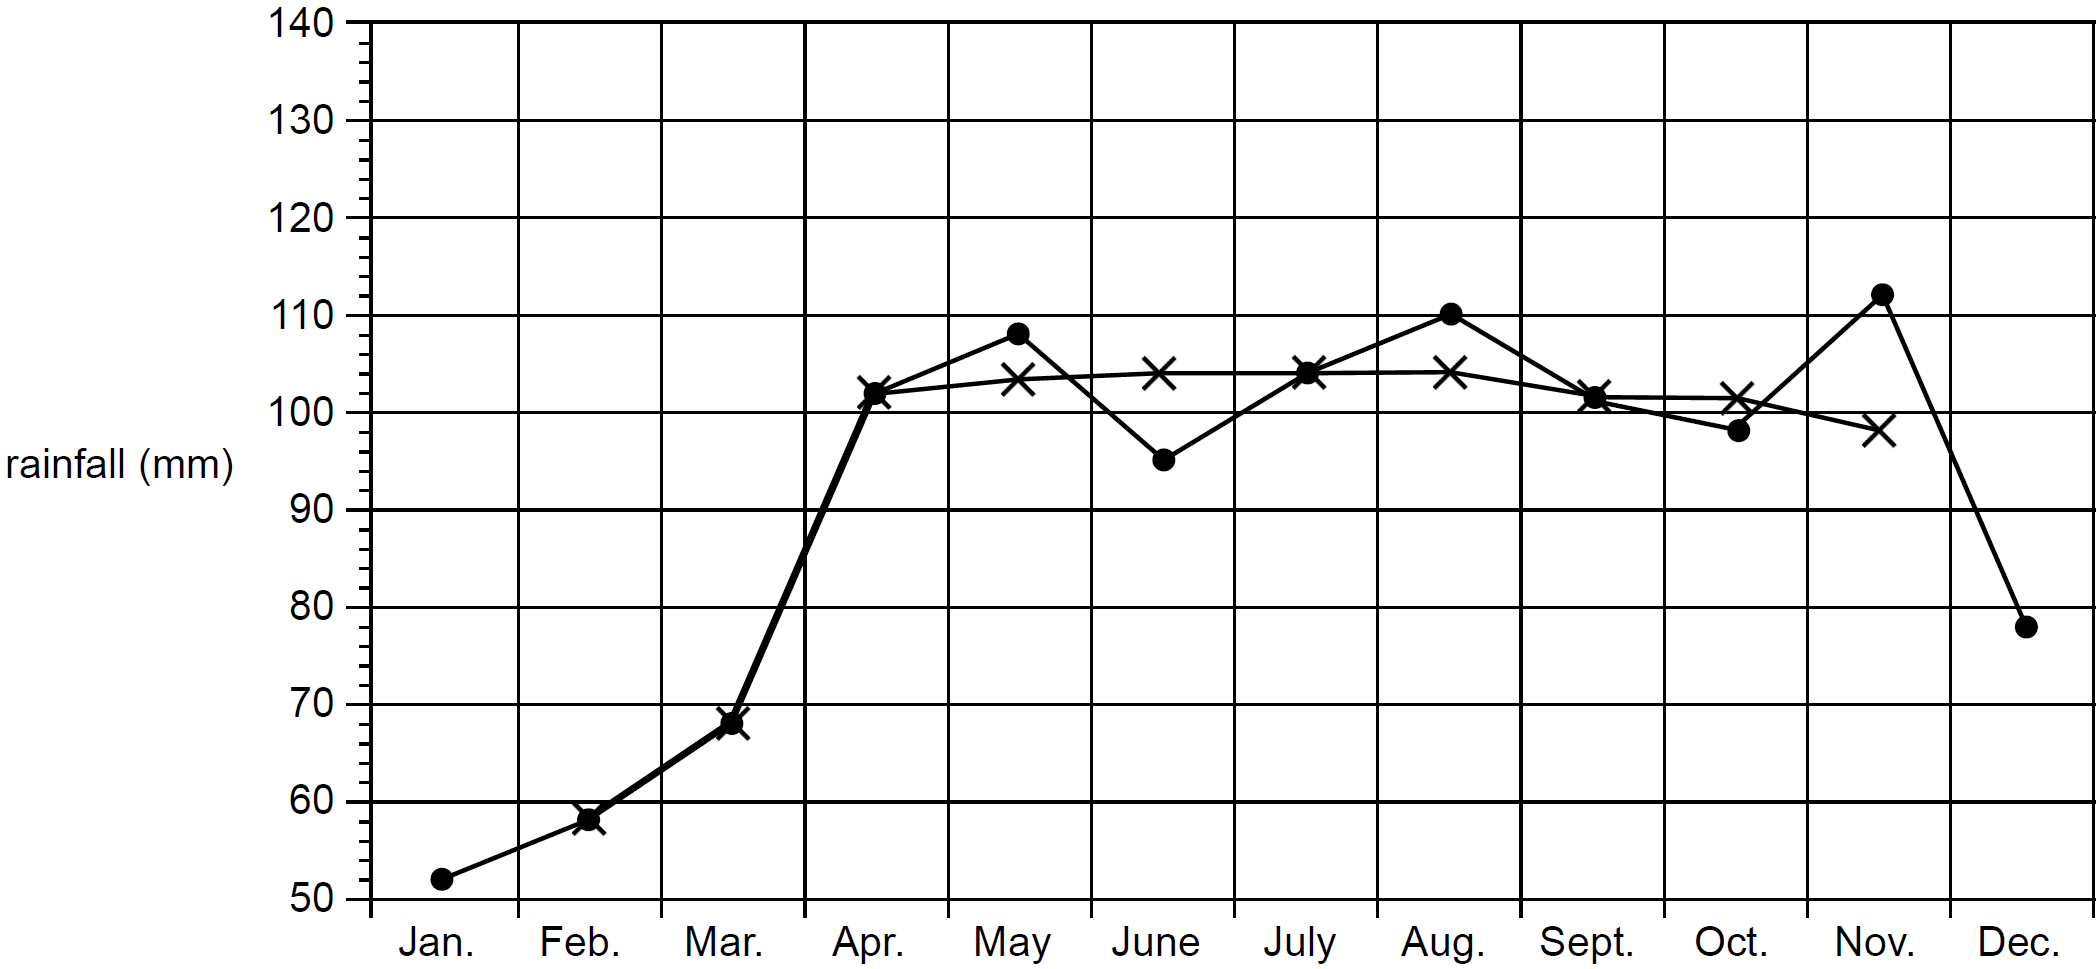
a. `text(November)`
| b. | |
c. `text(Until April, there is an increase in rainfall)`
`text(and then it remains relatively constant until)`
`text(November.)`
Students in a music school are classified according to three ability levels: beginner (`B`), intermediate (`I`) or advanced (`A`).
Matrix `S_0`, shown below, lists the number of students at each level in the school for a particular week.
`S_0 = [(20), (60), (40)] {:(B), (I), (A):}`
--- 1 WORK AREA LINES (style=lined) ---
The music school has four teachers, David (`D`), Edith (`E`), Flavio (`F`) and Geoff (`G`).
Each teacher will teach a proportion of the students from each level, as shown in matrix `P` below.
`{:(qquadqquadqquad{:(Dquad,Eqquad,Fqquad,G):}),(P = [(0.25,0.5,0.15,0.1)]):}`
The matrix product, `Q = S_0P`, can be used to find the number of students from each level taught by each teacher.
--- 0 WORK AREA LINES (style=lined) ---

--- 1 WORK AREA LINES (style=lined) ---
The music school pays the teachers $15 per week for each beginner student, $25 per week for each intermediate student and $40 per week for each advanced student.
These amounts are shown in matrix `C` below.
`{:(qquad qquad quad{:(B quad, I quad,A):}),(C = [(15, 25, 40)]):}`
The amount paid to each teacher each week can be found using a matrix calculation.
--- 1 WORK AREA LINES (style=lined) ---
--- 3 WORK AREA LINES (style=lined) ---
Table 1 shows the number of rainy days recorded in a high rainfall area for each month during 2008.

The dot plot below displays the distribution of the number of rainy days for the 12 months of 2008.

--- 0 WORK AREA LINES (style=lined) ---
--- 2 WORK AREA LINES (style=lined) ---
--- 3 WORK AREA LINES (style=lined) ---

| a. | |
| b.i. | `text(Median)` | `= text{(6th + 7th)}/2` |
| `=(15+16)/2` | ||
| `=15.5` |
b.ii. `text(Months with more than 10 rainy days)`
`=11/12 xx text(100%)`
`=91.66…`
`=92text(%)\ \ text{(nearest %)}`
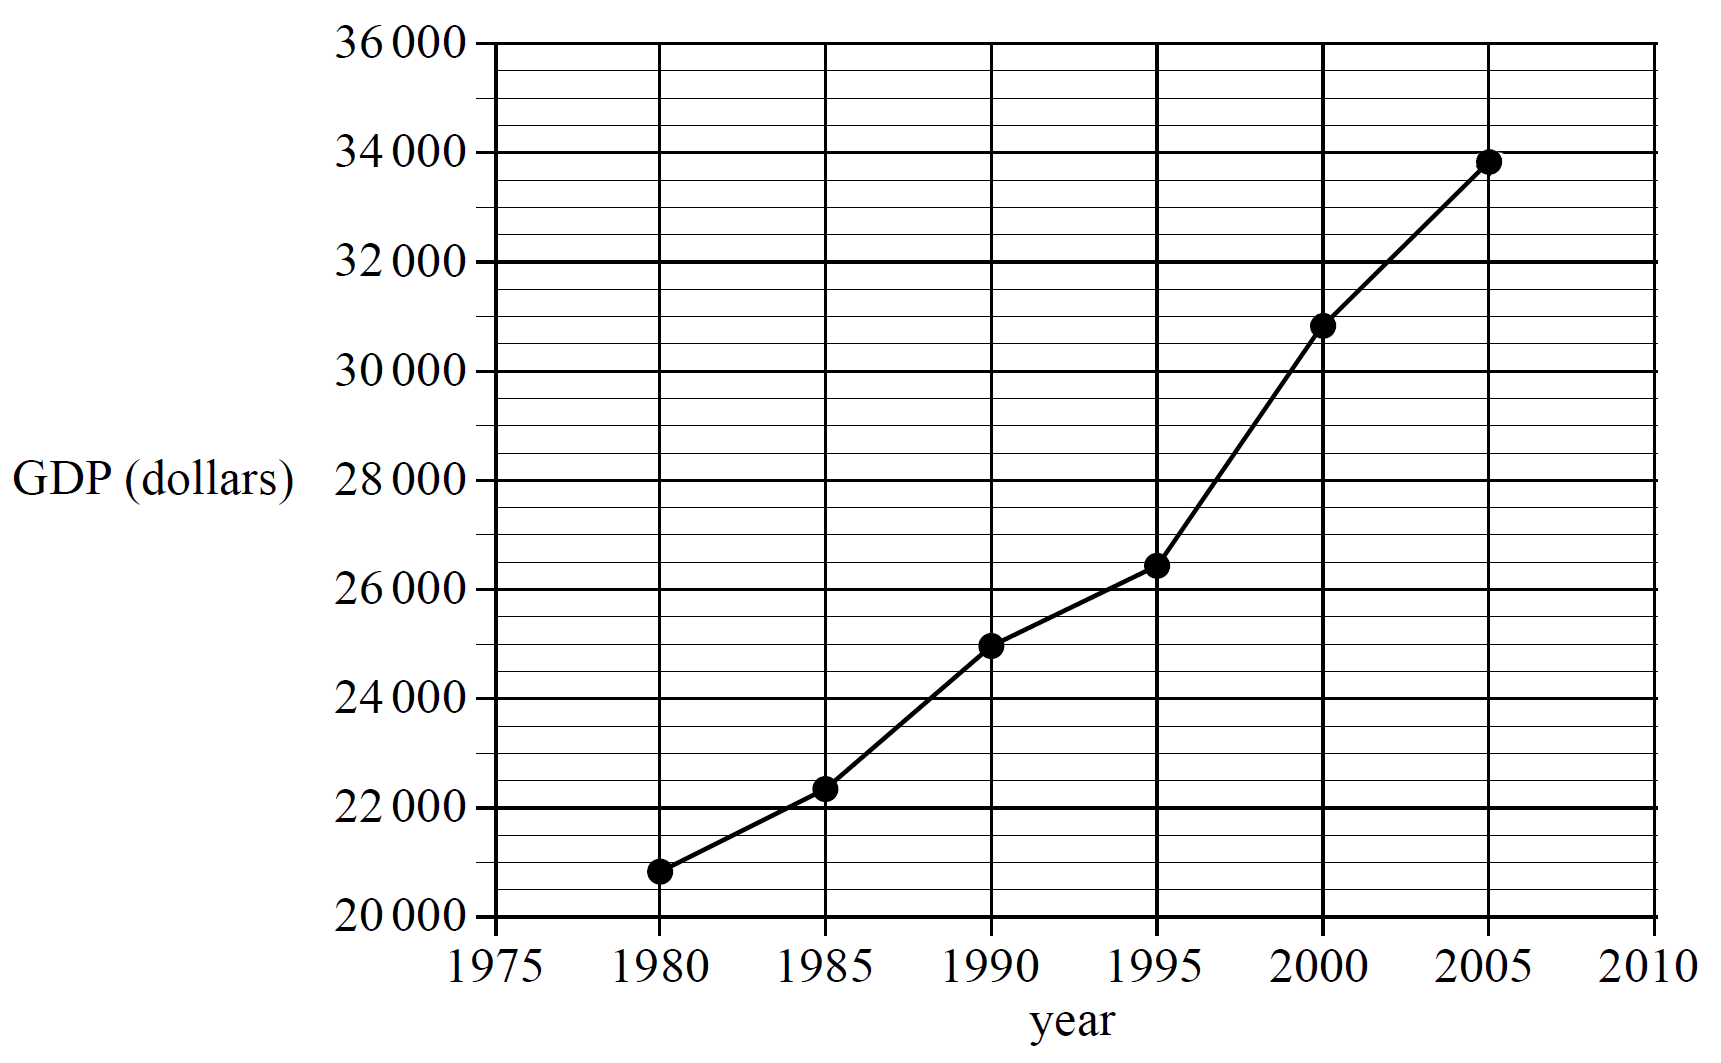
Table 2 shows the Australian gross domestic product (GDP) per person, in dollars, at five yearly intervals for the period 1980 to 2005.

--- 0 WORK AREA LINES (style=lined) ---
--- 1 WORK AREA LINES (style=lined) ---
In Table 3, the variable year has been rescaled using 1980 = 0, 1985 = 5 and so on. The new variable is time.

--- 4 WORK AREA LINES (style=lined) ---
--- 3 WORK AREA LINES (style=lined) ---
| a. | |
b. `text(An increasing trend.)`
c. `text(By calculator,)`
`text(GDP) = 20\ 000 + 524 × text(time)`
d. `text(In 2007, time = 27,)`
`text{GDP (Predicted)}\ = 20\ 000 + 524 xx 27= 34\ 148`
`:.\ text(Error)\ = 34\ 900-34\ 148= 752\ \ text{(less than real GDP)}`
In the scatterplot below, average annual female income, in dollars, is plotted against average annual male income, in dollars, for 16 countries. A least squares regression line is fitted to the data. The equation of the least squares regression line for predicting female income from male income is female income = 13 000 + 0.35 × male income --- 1 WORK AREA LINES (style=lined) --- From the least squares regression line equation it can be concluded that, for these countries, on average, female income increases by `text($________)` for each $1000 increase in male income. (1 mark) --- 0 WORK AREA LINES (style=lined) --- --- 1 WORK AREA LINES (style=lined) --- Explain why. (1 mark) --- 2 WORK AREA LINES (style=lined) ---
Table 1 shows the percentage of women ministers in the parliaments of 22 countries in 2008. --- 1 WORK AREA LINES (style=lined) --- --- 5 WORK AREA LINES (style=lined) --- The ordered stemplot below displays the distribution of the percentage of women ministers in parliament for 21 of these countries. The value of Canada is missing. --- 1 WORK AREA LINES (style=lined) --- --- 1 WORK AREA LINES (style=lined) ---


Table 1 shows information about a particular country. It shows the percentage of women by age at first marriage, for the years 1986, 1996 and 2006.

--- 2 WORK AREA LINES (style=lined) ---
--- 4 WORK AREA LINES (style=lined) ---
The stemplot in Figure 1 shows the distribution of the average age, in years, at which women first marry in 17 countries. --- 1 WORK AREA LINES (style=lined) --- --- 1 WORK AREA LINES (style=lined) --- The stemplot in Figure 2 shows the distribution of the average age, in years, at which men first marry in 17 countries. --- 3 WORK AREA LINES (style=lined) --- --- 4 WORK AREA LINES (style=lined) ---


The dot plot below displays the maximum daily temperature (in °C) recorded at a weather station on each of the 30 days in November 2011. --- 2 WORK AREA LINES (style=lined) --- --- 3 WORK AREA LINES (style=lined) --- Records show that the minimum daily temperature for November at this weather station is approximately normally distributed with a mean of 9.5 °C and a standard deviation of 2.25 °C. --- 4 WORK AREA LINES (style=lined) ---

a.i. `text(The median is the average of the 15th and 16th)` `\ \ text{data points (30 data points in total).}`. `:.\ text(Median = 20 °C)` a.ii. `text{Percentage of days less than 16 °C}` `= 7/30 xx 100text(%)` `=23.333…` `=23.3text{% (to 1 d.p.)}` `text(Percentage of days with a minimum below 14 °C)` `= 95text(%) + 2.5text(%)` `= 97.5text(%)`Show Worked Solution
b.
`z text{-score (14)}`
`=(x-barx)/s`
`=(14-9.5)/2.25`
`=2`


