Find the exact gradient of the tangent to the curve `y = x tan x` at the point where `x = pi/3`. (3 marks)
Financial Maths, STD2 F1 2021 HSC 22
The table shows the income tax rates for the 2020-2021 financial year.

William has a gross annual salary of $84 000. He has allowable tax deductions of $900 for home-office equipment and $474 for union fees. William must also pay a Medicare Levy of 2% of his taxable income.
Calculate the total tax payable by William including the Medicare Levy. (3 marks)
--- 6 WORK AREA LINES (style=lined) ---
Measurement, STD2 M1 2021 HSC 16
The volume, `V`, of a sphere is given by the formula
`V = frac{4}{3} pi r^3,`
where `r` is the radius of the sphere.
A tank consists of the bottom half of a sphere of radius 2 metres, as shown.

Find the volume of the tank in cubic metres, correct to one decimal place. (2 marks)
Functions, 2ADV F1 2021 HSC 8 MC
The graph of `y = f(x)` is shown.

Which of the following could be the equation of this graph?
- `y = (1 - x)(2 + x)^3`
- `y = (x + 1)(x - 2)^3`
- `y = (x + 1)(2 - x)^3`
- `y = (x - 1)(2 + x)^3`
Calculus, 2ADV C3 2021 HSC 7 MC
The diagram shows part of `y = f(x)` which has a local minimum at `x = –2` and a local maximum at `x = 3`.

Which of the following shows the correct relationship between `f^(″)(–2), \ f(0)` and `f^(′)(3)`?
- `f(0) < f^(′)(3) < f^(″)(–2)`
- `f(0) < f^(″)(–2) < f^(′)(3)`
- `f^(″)(–2) < f^(′)(3) < f(0)`
- `f^(″)(–2) < f(0) < f^(′)(3)`
Functions, 2ADV 2021 HSC 3 MC
Which of the following represents the domain of the function `f(x)=ln(1-x)`?
- `[1,oo)`
- `(1, oo)`
- `(–oo, 1]`
- `(–oo, 1)`
Probability, 2ADV S1 2021 HSC 2 MC
The probability distribution table for a discrete random variable `X` is shown.
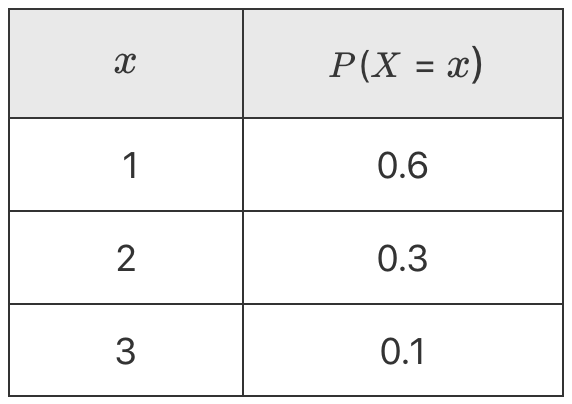
What is the expected value of `X`?
- 0.6
- 1.0
- 1.5
- 2.0
Measurement, STD2 M1 2021 HSC 12 MC
A block of land is represented by the shaded region on the number plane. All measurements are in kilometres.

Which of the following is the approximation for the area of this block of land in square kilometres, using two applications of the trapezoidal rule?
- 99
- 19.8
- 39.6
- 72
Show Worked Solution

| `\text{Area}` | `≈ \frac{6}{2} (1.2 + 2 \times 2 + 1.4)` |
| `≈ 3 (6.6)` | |
| `≈ 19.8 \ \text{km}^2` |
`=> B`
Probability, 2ADV S1 2021 HSC 6 MC
There are 8 chocolates in a box. Three have peppermint centres (P) and five have caramel centres (C).
Kim randomly chooses a chocolate from the box and eats it. Sam then randomly chooses and eats one of the remaining chocolates.
A partially completed probability tree is shown.

What is the probability that Kim and Sam choose chocolates with different centres?
- `\frac{15}{64}`
- `\frac{15}{56}`
- `\frac{15}{32}`
- `\frac{15}{28}`
Show Worked Solution

| `Ptext{(different centres)}` | `= P text{(PC)} + P text{(CP)}` |
| `=\frac{3}{8} · \frac{5}{7} + \frac{5}{8} · \frac{3}{7}` | |
| `= \frac{15}{56} + \frac{15}{56}` | |
| `= \frac{15}{28}` |
`=> D`
L&E, 2ADV E1 2021 HSC 5 MC
Which of the following best represents the graph of `y = 10 (0.8)^x`?

Algebra, STD1 A2 2021 HSC 8 MC
A student is thinking of a number. Let the number be `x`.
When the student subtracts 8 from this number and multiplies the result by 3, the answer is 2 more than `x`.
Which equation can be used to find `x`?
- `3(x-8)=2x`
- `3x-8=2x`
- `3(x-8)=x+2`
- `3x-8=x+2`
Financial Maths, STD1 F3 2021 HSC 4 MC
Three years ago an appliance was valued at $2467. Its value has depreciated by 15% each year, based on the declining-balance method.
What is the salvage value today, to the nearest dollar?
- $952
- $1110
- $1357
- $1515
Networks, STD1 N1 2021 HSC 3 MC
Consider the network diagram.

What is the sum of the degrees of all the vertices in this network?
- 5
- 8
- 14
- 16
Networks, STD2 N2 2021 HSC 2 MC
Consider the network diagram.
What is the sum of the degrees of all the vertices in this network?
- 5
- 8
- 14
- 16
Measurement, STD2 M7 2021 HSC 27
The price and the power consumption of two different brands of television are shown.
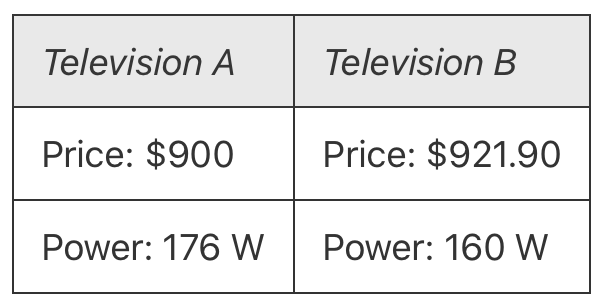
The average cost for electricity is 25c/kWh. A particular family watches an average of 3 hours of television per day.
- The annual cost of electricity for Television A for this family is $48.18.
- For this family, what is the difference in the annual cost of electricity between Television A and Television B? (2 marks)
--- 4 WORK AREA LINES (style=lined) ---
- For this family, how many years will it take for the total cost of buying and using Television A to be equal to the cost of buying and using Television B? (2 marks)
--- 4 WORK AREA LINES (style=lined) ---
Financial Maths, STD2 F4 2021 HSC 26
Nina plans to invest $35 000 for 1 year. She is offered two different investment options.
Option A: Interest is paid at 6% per annum compounded monthly.
Option B: Interest is paid at `r` % per annum simple interest.
- Calculate the future value of Nina's investment after 1 year if she chooses Option A. (2 marks)
--- 4 WORK AREA LINES (style=lined) ---
- Find the value of `r` in Option B that would give Nina the same future value after 1 year as for Option A. Give your answer correct to two decimal places. (2 marks)
--- 4 WORK AREA LINES (style=lined) ---
Measurement, STD2 M2 2021 HSC 20
City A is in Sweden and is located at (58°N, 16°E). Sydney, in Australia, is located at (33°S, 151°E).
Robert lives in Sydney and needs to give an online presentation to his colleagues in City A starting at 5:00 pm Thursday, local time in Sweden.
What time and day, in Sydney, should Robert start his presentation?
It is given that 15° = 1 hour time difference. Ignore daylight saving. (3 marks)
Statistics, STD2 S1 2021 HSC 17
The five-number summary of a dataset is given.
Lowest score = 1
Lowest quartile (`Q_1`) = 4
Median (`Q_2`) = 7
Upper quartile (`Q_3`) = 10
Highest score = 20
Is 20 an outlier? Justify your answer with calculations. (2 marks)
--- 5 WORK AREA LINES (style=lined) ---
Algebra, STD2 A2 2021 HSC 9 MC
A student is thinking of a number. Let the number be `x`.
When the student subtracts 8 from this number and multiplies the result by 3, the answer is 2 more than `x`.
Which equation can be used to find `x`?
- `3(x-8)=2x`
- `3x-8=2x`
- `3(x-8)=x+2`
- `3x-8=x+2`
Statistics, STD2 S5 2021 HSC 8 MC
On a test, Zac's mark corresponded to a `z`-score of 2. The test scores had a mean of 63 and a standard deviation of 8.
What was Zac's actual mark on the test?
- 65
- 67
- 73
- 79
Measurement, STD2 M1 2021 HSC 6 MC
Suppose `a=b/7`, where `b=22.`
What is the value of `a`, correct to three significant figures?
- 3.14
- 3.15
- 3.142
- 3.143
Financial Maths, STD2 F2 2021 HSC 5 MC
Peter currently earns $21.50 per hour. His hourly wage will increase by 2.1% compounded each year for the next four years.
What will his hourly wage be after four years?
- `21.50(1.21)^4`
- `21.50(1.021)^4`
- `21.50 + 21.50 xx 0.21 xx 4`
- `21.50 + 21.50 xx 0.021 xx 4`
Geometry, NAP-D3-NC02v1
Which of these 3D objects has exactly 7 faces?
 |
 |
 |
 |
|
|
|
|
|
Show Answers Only
Show Worked Solution
Measurement, NAP-E3-NC03v1
At the start of the day, a farmer drove around his property inspecting the fences and livestock.
He started the drive at 6:15 and finished at 7:04.
How long did the farmer drive for?
| `text(49 minutes)` | `text(51 minutes)` | `text(71 minutes)` | `text(89 minutes)` |
|
|
|
|
|
Measurement, NAP-K3-CA01v1
Fiona is nurse who is administering vaccines to patients using a needle
Which unit would be the most appropriate to measure the volume of vaccine she needs to inject?
| milligrams | joules | millimetres | millilitres |
|
|
|
|
|
Number, NAP-A3-CA02v1
Which number is seven thousand and sixty-three?
| `7036` | `7630` | `7603` | `7063` |
|
|
|
|
|
Measurement, NAP-E2-05v1
Helene started her walk to work at 2:15 pm.
She arrived at her work at 3:03 pm.
How long did Helene walk for?
| `text(12 minutes)` | `text(48 minutes)` | `text(72 minutes)` | `text(88 minutes)` |
|
|
|
|
|
Measurement, NAP-J2-05v1
How many days are there in 5 weeks?
| 7 days | 25 days | 35 days | 50 days |
|
|
|
|
|
Number and Algebra, NAP-J2-08v1
Mary-Sue has $1.15 in 5-cent pieces.
How many 5-cent pieces does she have?
| `17` | `21` | `23` | `565` |
|
|
|
|
|
Number and Algebra, NAP-I2-01v1
Kranskie delivers brochures by hand and is paid 10 cents for every brochure he delivers.
Kranskie delivers 79 brochures in his first hour of work.
How much money will he be paid for this?
| `79¢` | `$7.90` | `$79` | `$790` |
|
|
|
|
|
Number and Algebra, NAP-K2-05 SA v1
In an AFL competition, Elie's team won 9 games and lost the other games.
Altogether she played 22 games.
Finish the subtraction sentence below to show the number of games she lost.
| `\ - 9 =` |
Number and Algebra, NAP-C1-13v1
Ernie has collected 93 bottles for recycling.
Grover has collected 88 bottles for recycling.
In total, how many bottles can Ernie and Grover deliver to the recycling depot?
| `165` | `171` | `177` | `181` |
|
|
|
|
|
Number and Algebra, NAP-G2-10v1
In which one of these numbers does the numeral 4 represent 4 tens?
| `4389` | `438` | `401` | `7049` |
|
|
|
|
|
Number and Algebra, NAP-H2-5v1
What number is 13 less than 1005?
| `902` | `908` | `992` | `1018` |
|
|
|
|
|
L&E, 2ADV E1 SM-Bank 13
Find `x` given `100^(x-2) = 1000^x`. (2 marks)
Networks, STD2 N3 FUR2 4
Training program 1 has the cricket team starting from exercise station `S` and running to exercise station `O`.
For safety reasons, the cricket coach has placed a restriction on the maximum number of people who can use the tracks in the fitness park.
The directed graph below shows the capacity of the tracks, in number of people per minute.

- Determine the capacity of Cut 1, shown above. (1 mark)
--- 1 WORK AREA LINES (style=lined) ---
- What is the maximum flow from `S` to `O`, in number of people per minute? (1 mark)
--- 2 WORK AREA LINES (style=lined) ---
Show Worked Solution
| a. | `text{Capacity (Cut 1)}` | `= 20 + 12 + 20` |
| `= 52` |
b. `text(Max flow/minimum cut)`
♦♦ Mean mark part (c) 32%.
`= 20 + 10 + 20`
`= 50`

NETWORKS, FUR2 2020 VCAA 3
A local fitness park has 10 exercise stations: `M` to `V`.
The edges on the graph below represent the tracks between the exercise stations.
The number on each edge represents the length, in kilometres, of each track.

The Sunny Coast cricket coach designs three different training programs, all starting at exercise station `S`.
| Training program number |
Training details | |
| 1 | The team must run to exercise station `O`. | |
| 2 | The team must run along all tracks just once. | |
| 3 | The team must visit each exercise station and return to exercise station `S`. |
- What is the shortest distance, in kilometres, covered in training program 1? (1 mark)
--- 3 WORK AREA LINES (style=lined) ---
- i. What mathematical term is used to describe training program 2? (1 mark)
--- 1 WORK AREA LINES (style=lined) ---
- ii. At which exercise station would training program 2 finish? (1 mark)
--- 1 WORK AREA LINES (style=lined) ---
- To complete training program 3 in the minimum distance, one track will need to be repeated.
Complete the following sentence by filling in the boxes provided. (1 mark)
--- 0 WORK AREA LINES (style=lined) ---
This track is between exercise station and exercise station
NETWORKS, FUR2 2020 VCAA 2
A cricket team has 11 players who are each assigned to a batting position.
Three of the new players, Alex, Bo and Cameron, can bat in position 1, 2 or 3.
The table below shows the average scores, in runs, for each player for the batting positions 1, 2 and 3.
| Batting position | |||||
| 1 | 2 | 3 | |||
| Player | Alex | 22 | 24 | 24 | |
| Bo | 25 | 25 | 21 | ||
| Cameron | 24 | 25 | 19 | ||
Each player will be assigned to one batting position.
To which position should each player be assigned to maximise the team’s score? Write your answer in the table below. (1 mark)
--- 5 WORK AREA LINES (style=lined) ---
| Player | Batting position | |
| Alex | ||
| Bo | ||
| Cameron |
NETWORKS, FUR2 2020 VCAA 1
The Sunny Coast Cricket Club has five new players join its team: Alex, Bo, Cameron, Dale and Emerson.
The graph below shows the players who have played cricket together before joining the team.
For example, the edge between Alex and Bo shows that they have previously played cricket together.

- How many of these players had Emerson played cricket with before joining the team? (1 mark)
--- 1 WORK AREA LINES (style=lined) ---
- Who had played cricket with both Alex and Bo before joining the team? (1 mark)
--- 1 WORK AREA LINES (style=lined) ---
- During the season, another new player, Finn, joined the team.
Finn had not played cricket with any of these players before.
Represent this information on the graph above. (1 mark)
--- 0 WORK AREA LINES (style=lined) ---
Show Answers Only
- `text(one)`
- `text(Dale)`
-

Show Worked Solution
a. `text{One (one edge connected to Emerson.)}`
b. `text{Dale (he has edges directly connected to Alex and Bo.)}`
| c. | |
MATRICES, FUR2 2020 VCAA 3
An offer to buy the Westmall shopping centre was made by a competitor.
One market research project suggested that if the Westmall shopping centre were sold, each of the three centres (Westmall, Grandmall and Eastmall) would continue to have regular shoppers but would attract and lose shoppers on a weekly basis.
Let `S_n` be the state matrix that shows the expected number of shoppers at each of the three centres `n` weeks after Westmall is sold.
A matrix recurrence relation that generates values of `S_n` is
`S_(n+1) = T xx S_n`
`{:(quad qquad qquad qquad qquad qquad qquad qquad text(this week)),(qquad qquad qquad qquad qquad qquad quad \ W qquad quad G qquad quad \ E),(text(where)\ T = [(quad 0.80, 0.09, 0.10),(quad 0.12, 0.79, 0.10),(quad 0.08, 0.12, 0.80)]{:(W),(G),(E):}\ text(next week,) qquad qquad S_0 = [(250\ 000), (230\ 000), (200\ 000)]{:(W),(G),(E):}):}`
- Calculate the state matrix, `S_1`, to show the expected number of shoppers at each of the three centres one week after Westmall is sold. (1 mark)
--- 3 WORK AREA LINES (style=lined) ---
Using values from the recurrence relation above, the graph below shows the expected number of shoppers at Westmall, Grandmall and Eastmall for each of the 10 weeks after Westmall is sold.

- What is the difference in the expected weekly number of shoppers at Westmall from the time Westmall is sold to 10 weeks after Westmall is sold?
- Give your answer correct to the nearest thousand. (1 mark)
--- 2 WORK AREA LINES (style=lined) ---
- Grandmall is expected to achieve its maximum number of shoppers sometime between the fourth and the tenth week after Westmall is sold.
- Write down the week number in which this is expected to occur. (1 mark)
--- 4 WORK AREA LINES (style=lined) ---
- In the long term, what is the expected weekly number of shoppers at Westmall?
- Round your answer to the nearest whole number. (1 mark)
--- 3 WORK AREA LINES (style=lined) ---
MATRICES, FUR2 2020 VCAA 2
The preferred number of cafes `(x)` and sandwich bars `(y)` in Grandmall’s food court can be determined by solving the following equations written in matrix form.
`[(5, -9),(4, -7)][(x),(y)]=[(7), (6)]`
- The value of the determinant of the 2 × 2 matrix is 1.
- Use this information to explain why this matrix has an inverse. (1 mark)
--- 2 WORK AREA LINES (style=lined) ---
- Write the three missing values of the inverse matrix that can be used to solve these equations. (1 mark)
--- 0 WORK AREA LINES (style=lined) ---
`[(text( __), 9),(text( __), text( __)\ )]`
- Determine the preferred number of sandwich bars for Grandmall’s food court. (1 mark)
--- 2 WORK AREA LINES (style=lined) ---
MATRICES, FUR2 2020 VCAA 1
The three major shopping centres in a large city, Eastmall `(E)`, Grandmall `(G)` and Westmall `(W)`, are owned by the same company.
The total number of shoppers at each of the centres at 1.00 pm on a typical day is shown in matrix `V`.
`qquad qquad qquad {:(qquad qquad qquad \ E qquad qquad G qquad qquad \ W),(V = [(2300,2700,2200)]):}`
- Write down the order of matrix `V`. (1 mark)
Each of these centres has three major shopping areas: food `(F)`, clothing `(C)` and merchandise `(M)`.
The proportion of shoppers in each of these three areas at 1.00 pm on a typical day is the same at all three centres and is given in matrix `P` below
`qquad qquad qquad P = [(0.48), (0.27), (0.25)] {:(F),(C),(M):}
- Grandmall’s management would like to see 700 shoppers in its merchandise area at 1.00 pm.
If this were to happen, how many shoppers, in total, would be at Grandmall at this time? (1 mark)
- The matrix `Q = P xx V` is shown below. Two of the elements of this matrix are missing.
`{:(quad qquad qquad qquad \ E qquad qquad G qquad qquad W), (Q = [(1104, \ text{___}, 1056 ), (621,\ text{___}, 594), (575, 675, 550)]{:(F),(C), (M):}):}`
-
- Complete matrix `Q` above by filling in the missing elements. (1 mark)
--- 0 WORK AREA LINES (style=lined) ---
- The element in row `i` and column `j` of matrix `Q` is `q_(ij)`.
- What does the element `q_23` represent? (1 mark)
--- 2 WORK AREA LINES (style=lined) ---
- Complete matrix `Q` above by filling in the missing elements. (1 mark)
The average daily amount spent, in dollars, by each shopper in each of the three areas at Grandmall in 2019 is shown in matrix `A_2019` below.
`qquad qquad A_2019 = [(21.30), (34.00), (14.70)] {:(F),(C),(M):}`
On one particular day, 135 shoppers spent the average daily amount on food, 143 shoppers spent the average daily amount on clothing and 131 shoppers spent the average daily amount on merchandise.
- Write a matrix calculation, using matrix `A_2019`, showing that the total amount spent by all these shoppers is $9663.20 (1 mark)
--- 3 WORK AREA LINES (style=lined) ---
- In 2020, the average daily amount spent by each shopper was expected to change by the percentage shown in the table below.
Area food clothing merchandise Expected change increase by 5% decrease by 15% decrease by 1% The average daily amount, in dollars, expected to be spent in each area in 2020 can be determined by forming the matrix product
- `qquad qquad A_2020 = K xx A_2019`
- Write down matrix `K`. (1 mark)
--- 3 WORK AREA LINES (style=lined) ---
NETWORKS, FUR2 2020 VCAA 4
Training program 1 has the cricket team starting from exercise station `S` and running to exercise station `O`.
For safety reasons, the cricket coach has placed a restriction on the maximum number of people who can use the tracks in the fitness park.
The directed graph below shows the capacity of the tracks, in number of people per minute.
- How many different routes from `S` to `O` are possible? (1 mark)
--- 2 WORK AREA LINES (style=lined) ---
When considering the possible flow of people through this network, many different cuts can be made.
- Determine the capacity of Cut 1, shown above. (1 mark)
--- 2 WORK AREA LINES (style=lined) ---
- What is the maximum flow from `S` to `O`, in number of people per minute? (1 mark)
--- 3 WORK AREA LINES (style=lined) ---
Show Worked Solution
| a. | `text(Routes: )` | `SMO, STUNO, STUVO, STUVPO, SRQUNO,SRQUVO,` |
| `SRQUVPO, SRQVO, SRQVPO, SRQPO` |
♦♦ Mean mark part (a) 30%.
`:. 10\ text(routes)`
| b. | `text{Capacity (Cut 1)}` | `= 20 + 12 + 20` |
| `= 52` |
c. `text(Max flow/minimum cut)`
♦♦ Mean mark part (c) 32%.
`= 20 + 10 + 20`
`= 50`
CORE, FUR2 2020 VCAA 10
Samuel now invests $500 000 in an annuity from which he receives a regular monthly payment.
The balance of the annuity, in dollars, after `n` months, `A_n` , can be modelled by a recurrence relation of the form
`A_0 = 500\ 000, qquad A_(n+1) = kA_n - 2000`
- Calculate the balance of this annuity after two months if `k = 1.0024`. (1 mark)
--- 2 WORK AREA LINES (style=lined) ---
- Calculate the annual compound interest rate percentage for this annuity if `k = 1.0024`. (1 mark)
--- 2 WORK AREA LINES (style=lined) ---
- For what value of `k` would this investment act as a simple perpetuity? (1 mark)
--- 3 WORK AREA LINES (style=lined) ---
CORE, FUR2 2020 VCAA 9
Samuel opens a savings account.
Let `B_n` be the balance of this savings account, in dollars, `n` months after it was opened.
The month-to-month value of `B_n` can be determined using the recurrence relation shown below.
`B_0 = 5000, qquad B_(n+1) = 1.003B_n`
- Write down the value of `B_4`, the balance of the savings account after four months.
- Round your answer to the nearest cent. (1 mark)
--- 3 WORK AREA LINES (style=lined) ---
- Calculate the monthly interest rate percentage for Samuel’s savings account. (1 mark)
--- 2 WORK AREA LINES (style=lined) ---
- After one year, the balance of Samuel’s savings account, to the nearest dollar, is $5183.
If Samuel had deposited an additional $50 at the end of each month immediately after the interest was added, how much extra money would be in the savings account after one year?
Round your answer to the nearest dollar. (1 mark)
--- 3 WORK AREA LINES (style=lined) ---
CORE, FUR2 2020 VCAA 7
Samuel owns a printing machine.
The printing machine is depreciated in value by Samuel using flat rate depreciation.
The value of the machine, in dollars, after `n` years, `Vn` , can be modelled by the recurrence relation
`V_0 = 120\ 000, qquad V_(n+1) = V_n-15\ 000`
- By what amount, in dollars, does the value of the machine decrease each year? (1 mark)
--- 1 WORK AREA LINES (style=lined) ---
- Showing recursive calculations, determine the value of the machine, in dollars, after two years. (1 mark)
--- 2 WORK AREA LINES (style=lined) ---
- What annual flat rate percentage of depreciation is used by Samuel? (1 mark)
--- 2 WORK AREA LINES (style=lined) ---
- The value of the machine, in dollars, after `n` years, `V_n`, could also be determined using a rule of the form `V_n = a + bn`.
Write down this rule for `V_n`. (1 mark)
--- 2 WORK AREA LINES (style=lined) ---
CORE, FUR2 2020 VCAA 6
The table below shows the mean age, in years, and the mean height, in centimetres, of 648 women from seven different age groups.

- What was the difference, in centimetres, between the mean height of the women in their twenties and the mean height of the women in their eighties? (1 mark)
--- 1 WORK AREA LINES (style=lined) ---
A scatterplot displaying this data shows an association between the mean height and the mean age of these women. In an initial analysis of the data, a line is fitted to the data by eye, as shown.

- Describe this association in terms of strength and direction. (1 mark)
--- 1 WORK AREA LINES (style=lined) ---
- The line on the scatterplot passes through the points (20,168) and (85,157).
Using these two points, determine the equation of this line. Write the values of the intercept and the slope in the appropriate boxes below.
Round your answers to three significant figures. (1 mark)
--- 0 WORK AREA LINES (style=lined) ---
| mean height = |
|
+ |
|
× mean age |
- In a further analysis of the data, a least squares line was fitted.
The associated residual plot that was generated is shown below.

The residual plot indicates that the association between the mean height and the mean age of women is non-linear.
The data presented in the table in part a is repeated below. It can be linearised by applying an appropriate transformation to the variable mean age.

Apply an appropriate transformation to the variable mean age to linearise the data. Fit a least squares line to the transformed data and write its equation below.
Round the values of the intercept and the slope to four significant figures. (2 marks)
--- 5 WORK AREA LINES (style=lined) ---

CORE, FUR2 2020 VCAA 5
The scatterplot below shows body density, in kilograms per litre, plotted against waist measurement, in centimetres, for 250 men.

When a least squares line is fitted to the scatterplot, the equation of this line is
body density = 1.195 – 0.001512 × waist measurement
- Draw the graph of this least squares line on the scatterplot above. (1 mark)
--- 0 WORK AREA LINES (style=lined) ---
- Use the equation of this least squares line to predict the body density of a man whose waist measurement is 65 cm.
- Round your answer to two decimal places. (1 mark)
--- 2 WORK AREA LINES (style=lined) ---
- When using the equation of this least squares line to make the prediction in part b., are you extrapolating or interpolating? (1 mark)
--- 1 WORK AREA LINES (style=lined) ---
- Interpret the slope of this least squares line in terms of a man’s body density and waist measurement. (1 mark)
--- 2 WORK AREA LINES (style=lined) ---
- In this study, the body density of the man with a waist measurement of 122 cm was 0.995 kg/litre.
- Show that, when this least squares line is fitted to the scatterplot, the residual, rounded to two decimal places, is –0.02 (1 mark)
--- 3 WORK AREA LINES (style=lined) ---
- The coefficient of determination for this data is 0.6783
- Write down the value of the correlation coefficient `r`.
- Round your answer to three decimal places. (1 mark)
--- 2 WORK AREA LINES (style=lined) ---
- The residual plot associated with fitting a least squares line to this data is shown below.

Does this residual plot support the assumption of linearity that was made when fitting this line to this data? Briefly explain your answer. (1 mark)
--- 3 WORK AREA LINES (style=lined) ---
Show Worked Solution
a. `text(LSRL passes through)\ (60, 1.1043) and (130, 0.998)`
♦ Mean mark part a. 41%.

| b. | `text(body density)` | `= 1.195-0.001512 xx 65` |
| `= 1.09672` | ||
| `= 1.10\ text{kg/litre (to 2 d.p.)}` |
♦ Mean mark part c. 38%.
| c. | `text(A waist of 65 cm is outside the)` |
| `text(range of the existing data set.)` |
`:.\ text(Extrapolating)`
♦ Mean mark part d. 44%.
| d. | `text(Body density decreases by 0.001512 kg/litre)` |
| `text(for each increase in waist size of 1 cm.)` |
e. `text{Body density (predicted)}`
`= 1.195-0.001512 xx 122`
`~~ 1.0105\ text(kg/litre)`
| `text(Residual)` | `= text(Actual-predicted)` |
| `~~ 0.995-1.0105` | |
| `~~ -0.0155` | |
| `~~ -0.02\ text{(to 2 d.p.)}` |
♦♦ Mean mark part f. 25%.
| f. | `r` | `= -sqrt(0.6783)` |
| `=-0.8235…` | ||
| `= -0.824\ text{(to 3 d.p.)}` |
g. `text(The residual plot has no pattern and is centred around zero.)`
`:.\ text(It supports the assumption of linearity of the LSRL.)`
CORE, FUR2 2020 VCAA 4
The age, in years, body density, in kilograms per litre, and weight, in kilograms, of a sample of 12 men aged 23 to 25 years are shown in the table below.
| Age (years) |
Body density |
Weight |
|
| 23 | 1.07 | 70.1 | |
| 23 | 1.07 | 90.4 | |
| 23 | 1.08 | 73.2 | |
| 23 | 1.08 | 85.0 | |
| 24 | 1.03 | 84.3 | |
| 24 | 1.05 | 95.6 | |
| 24 | 1.07 | 71.7 | |
| 24 | 1.06 | 95.0 | |
| 25 | 1.07 | 80.2 | |
| 25 | 1.09 | 87.4 | |
| 25 | 1.02 | 94.9 | |
| 25 | 1.09 | 65.3 |
- For these 12 men, determine
- i. their median age, in years. (1 mark)
--- 2 WORK AREA LINES (style=lined) ---
- ii. the mean of their body density, in kilograms per litre. (1 mark)
--- 2 WORK AREA LINES (style=lined) ---
- A least squares line is to be fitted to the data with the aim of predicting body density from weight.
- i. Name the explanatory variable for this least squares line. (1 mark)
--- 1 WORK AREA LINES (style=lined) ---
- ii. Determine the slope of this least squares line.
- Round your answer to three significant figures. (1 mark)
--- 1 WORK AREA LINES (style=lined) ---
- What percentage of the variation in body density can be explained by the variation in weight?
- Round your answer to the nearest percentage. (1 mark)
--- 2 WORK AREA LINES (style=lined) ---
CORE, FUR2 2020 VCAA 2
The neck size, in centimetres, of 250 men was recorded and displayed in the dot plot below.

- Write down the modal neck size, in centimetres, for these 250 men. (1 mark)
--- 1 WORK AREA LINES (style=lined) ---
- Assume that this sample of 250 men has been drawn at random from a population of men whose neck size is normally distributed with a mean of 38 cm and a standard deviation of 2.3 cm.
- i. How many of these 250 men are expected to have a neck size that is more than three standard deviations above or below the mean? Round your answer to the nearest whole number. (1 mark)
--- 2 WORK AREA LINES (style=lined) ---
- ii. How many of these 250 men actually have a neck size that is more than three standard deviations above or below the mean? (1 mark)
--- 2 WORK AREA LINES (style=lined) ---
- The five-number summary for this sample of neck sizes, in centimetres, is given below.

Use the five-number summary to construct a boxplot, showing any outliers if appropriate, on the grid below. (2 marks)
--- 3 WORK AREA LINES (style=lined) ---

Show Worked Solution
a. `text(Mode) = 38\ text(cm)`
♦ Mean mark part b.i. 40%.
| b.i. | `text(Expected number of men)` | `= (1-0.997) xx 250` |
| `= 0.75` | ||
| `= 1\ text{(nearest whole)}` |
♦ Mean mark part b.ii. 42%.
| b.ii. | `text(When)\ \ z = +- 3` | |
| `text(Neck size limits)` | `= 38 +- (2.3 xx 3)` | |
| `= 44.9 or 31.1` | ||
`:.\ text(1 man has neck size outside 3 s.d.)`
c. `IQR = 39-36=3`
`text(Upper fence)\ =Q_3 + 1.5 xx 3=39 + 4.5=43.5`
`text(Lower fence)\ =Q_1-1.5 xx 3=36-4.5=31.5`
 |
CORE, FUR2 2020 VCAA 1
Body mass index (BMI), in kilograms per square metre, was recorded for a sample of 32 men and displayed in the ordered stem plot below.

- Describe the shape of the distribution. (1 mark)
--- 1 WORK AREA LINES (style=lined) ---
- Determine the median BMI for this group of men. (1 mark)
--- 3 WORK AREA LINES (style=lined) ---
- People with a BMI of 25 or over are considered to be overweight.
- What percentage of these men would be considered to be overweight? (1 mark)
--- 2 WORK AREA LINES (style=lined) ---
Geometry, NAPX-p168430v01
A shape of an arrow head is folded half a long the dotted line.

The folded shape can also be called a
|
|
Quadrilateral |
|
|
Triangle |
|
|
Hexagon |
|
|
Pentagon |
Show Worked Solution
`text{The folded shape is a triangle}`

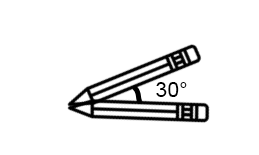
Geometry, NAPX-p167885v02
Which picture shows the pencils creating an angle of 30°?
|
|
 |
|
|
 |
|
|
 |
|
|
 |
Show Answers Only
Show Worked Solution
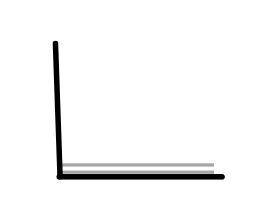
Geometry, NAPX-p167885v01
Which picture shows that the book is opened at an angle of 180°?
|
|
 |
|
|
 |
|
|

|
|
|
 |
Show Answers Only
Show Worked Solution

`text{This book is opened at an angle of 180}^@`
Statistics, NAPX-p167881v02
A menswear store recorded the number of items it sold in four different categories.
What category makes up 60% of the total number of items sold?

|
|
Hoodies |
|
|
Shorts |
|
|
T-shirts |
|
|
Pants |
Statistics, NAPX-p167881v01
A bakery recorded the flavour of every cupcake it sold during a month.
Which flavour makes up 30% of the cupcakes sold?

|
|
Chocolate |
|
|
Banana |
|
|
Strawberry |
|
|
Caramel |
Geometry, NAPX-p167872v02
Which letter has exactly one line of symmetry?
 |
 |
||
|
|
|
|
|
Show Answers Only
Show Worked Solution

`text{The letter A has only one line of symmetry.}`
Geometry, NAPX-p167872v01
Which letter has two lines of symmetry?
 |
 |
 |
|
|
|
|
|
|
Show Answers Only
Show Worked Solution

`text{The letter X has two lines of symmetry.}`
Number, NAPX-p167756v02
| `8 xx` |
|
`- 13 = 75` |
What value would make the number sentence right?
|
|
11 |
|
|
9 |
|
|
13 |
|
|
7 |
Number, NAPX-p167756v01
| `12 + 3 xx ` |
|
`= 39` |
For this number sentence to be true, what is the missing value?
|
|
15 |
|
|
11 |
|
|
9 |
|
|
7 |
- « Previous Page
- 1
- …
- 61
- 62
- 63
- 64
- 65
- …
- 114
- Next Page »