A particle of mass 1 kg is projected from the origin with speed 40 m s\( ^{-1}\) at an angle 30° to the horizontal plane. --- 6 WORK AREA LINES (style=lined) --- The forces acting on the particle are gravity and air resistance. The air resistance is proportional to the velocity vector with a constant of proportionality 4 . Let the acceleration due to gravity be 10 m s \( ^{-2}\). The position vector of the particle, at time \(t\) seconds after the particle is projected, is \(\mathbf{r}(t)\) and the velocity vector is \(\mathbf{v}(t)\). --- 12 WORK AREA LINES (style=lined) --- --- 10 WORK AREA LINES (style=lined) --- --- 7 WORK AREA LINES (style=lined) ---
i. \(\underset{\sim}{v}(0)={\displaystyle\left(\begin{array}{cc} 40 \cos\ 30° \\ 40 \sin\ 30°\end{array}\right)} = {\displaystyle\left(\begin{array}{cc} 40 \times \frac{\sqrt3}{2} \\ 40 \times \frac{1}{2}\end{array}\right)} = {\displaystyle\left(\begin{array}{cc}20 \sqrt{3} \\ 20\end{array}\right)} \) ii. \(\text{Air resistance:} \) \(\underset{\sim}{F} = -4\underset{\sim}{v} = {\displaystyle\left(\begin{array}{cc} -4\dot{x} \\ -4\dot{y} \end{array}\right)} \) \(\text{Horizontally:}\) iv. \(\text{Range}\ \Rightarrow\ \text{Find}\ \ t\ \ \text{when}\ \ y=0: \) \(\Rightarrow \text{Solution when}\ \ t\approx 2.25\)

\(1 \times \ddot{x} \)
\(=-4 \dot{x} \)
\(\dfrac{d\dot{x}}{dt}\)
\(=-4\dot{x}\)
\(\dfrac{dt}{d\dot{x}}\)
\(= -\dfrac{1}{4\dot{x}} \)
\(t\)
\(=-\dfrac{1}{4} \displaystyle \int \dfrac{1}{\dot{x}} \ d\dot{x} \)
\(-4t\)
\(=\ln |\dot{x}|+c \)
\(\text{When}\ \ t=0, \ \dot{x}=20\sqrt3 \ \ \Rightarrow\ \ c=-\ln{20\sqrt3} \)
\(-4t\)
\(=\ln|\dot{x}|-\ln 20\sqrt3 \)
\(-4t\)
\(=\ln\Bigg{|}\dfrac{\dot{x}}{20\sqrt{3}} \Bigg{|} \)
\(\dfrac{\dot{x}}{20\sqrt{3}} \)
\(=e^{-4t} \)
\(\dot{x}\)
\(=20\sqrt{3}e^{-4t}\)
\(\text{Vertically:} \)
\(1 \times \ddot{y} \)
\(=-1 \times 10-4 \dot{y} \)
\(\dfrac{d\dot{y}}{dt}\)
\(=-(10+4\dot{y})\)
\(\dfrac{dt}{d\dot{y}}\)
\(= -\dfrac{1}{10+4\dot{y}} \)
\(t\)
\(=- \displaystyle \int \dfrac{1}{10+4\dot{y}} \ d\dot{y} \)
\(-4t\)
\(=- \displaystyle \int \dfrac{4}{10+4\dot{y}} \ d\dot{y} \)
\(-4t\)
\(=\ln |10+4\dot{y}|+c \)
\(\text{When}\ \ t=0, \ \dot{y}=20 \ \ \Rightarrow\ \ c=-\ln{90} \)
\(-4t\)
\(=\ln|10+4\dot{y}|-\ln 90 \)
\(-4t\)
\(=\ln\Bigg{|}\dfrac{10+4\dot{y}}{\ln{90}} \Bigg{|} \)
\(\dfrac{10+4\dot{y}}{90} \)
\(=e^{-4t} \)
\(4\dot{y}\)
\(=90e^{-4t}-10\)
\(\dot{y}\)
\(=\dfrac{45}{2} e^{-4t}-\dfrac{5}{2} \)
\(\therefore \underset{\sim}v={\displaystyle \left(\begin{array}{cc}20 \sqrt{3} e^{-4 t} \\ \dfrac{45}{2} e^{-4 t}-\dfrac{5}{2}\end{array}\right)}\)
iii. \(\text{Horizontally:}\)
\(x\)
\(= \displaystyle \int \dot{x}\ dx\)
\(= \displaystyle \int 20\sqrt3 e^{-4t}\ dt \)
\(=-5\sqrt3 e^{-4t}+c \)
\(\text{When}\ \ t=0, \ x=0\ \ \Rightarrow\ \ c=5\sqrt3 \)
\(x\)
\(=5\sqrt3-5\sqrt3 e^{-4t} \)
\(=5\sqrt3(1-e^{-4t}) \)
\(\text{Vertically:}\)
\(y\)
\(= \displaystyle \int \dot{y}\ dx\)
\(= \displaystyle \int \dfrac{45}{2} e^{-4t}-\dfrac{5}{2}\ dt \)
\(=-\dfrac{45}{8}e^{-4t}-\dfrac{5}{2}t+c \)
\(\text{When}\ \ t=0, \ y=0\ \ \Rightarrow\ \ c= \dfrac{45}{8} \)
\(y\)
\(=\dfrac{45}{8}-\dfrac{45}{8} e^{-4t}-\dfrac{5}{2}t \)
\(=\dfrac{45}{8}(1-e^{-4t})-\dfrac{5}{2} \)
\(\therefore \underset{\sim}{r}=\left(\begin{array}{c}5 \sqrt{3}\left(1-e^{-4 t}\right) \\ \dfrac{45}{8}\left(1-e^{-4 t}\right)-\dfrac{5}{2} t\end{array}\right)\)
\(\dfrac{45}{8}(1-e^{-4t})-\dfrac{5}{2}t \)
\(=0\)
\(\dfrac{45}{8}(1-e^{-4t}) \)
\(=\dfrac{5}{2}t \)
\(1-e^{-4t}\)
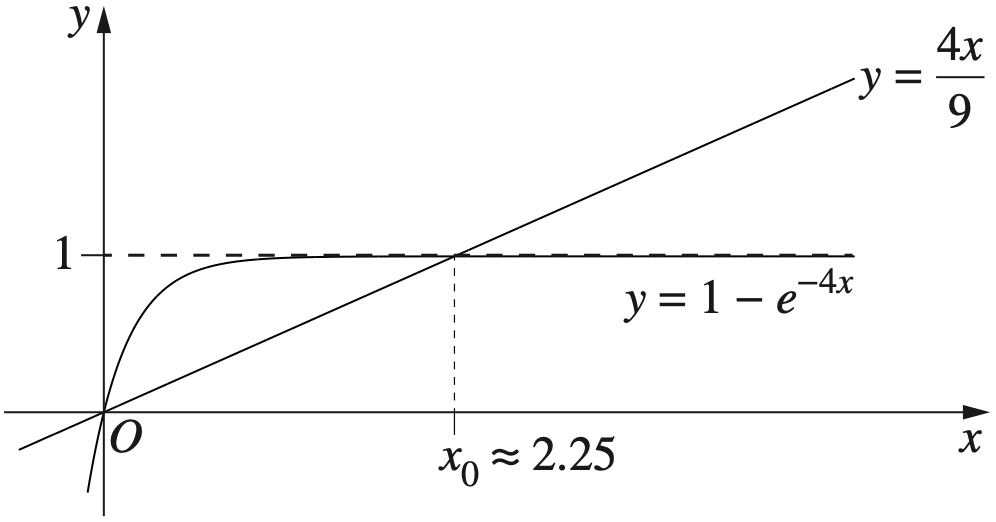
\(=\dfrac{4}{9}t \)
\(\text{Graph shows intersection of these two graphs.}\)
\(\therefore\ \text{Range}\)
\(=5\sqrt3(1-e^{(-4 \times 2.25)}) \)
\(=8.659…\)
\(=8.7\ \text{metres (to 1 d.p.)}\)
Mechanics, EXT2 M1 2023 HSC 12c
An object with mass \(m\) kilograms slides down a smooth inclined plane with velocity \( \underset{\sim}{v}(t)\), where \(t\) is the time in seconds after the object started sliding down the plane. The inclined plane makes an angle \(\theta\) with the horizontal, as shown in the diagram. The normal reaction force is \(\underset{\sim}{R}\). The acceleration due to gravity is \(\underset{\sim}{g}\) and has magnitude \(g\). No other forces act on the object.
The vectors \(\underset{\sim}{i}\) and \( \underset{\sim}{j} \) are unit vectors parallel and perpendicular, respectively, to the plane, as shown in the diagram.

- Show that the resultant force on the object is \(\underset{\sim}{F}=-(m g \ \sin \theta) \underset{\sim}{i}\). (2 marks)
--- 5 WORK AREA LINES (style=lined) ---
- Given that the object is initially at rest, find its velocity \(\underset{\sim}{v}(t)\) in terms of \(g\), \(\theta, t\) and \(\underset{\sim}{i}\). (2 marks)
--- 5 WORK AREA LINES (style=lined) ---
Show Worked Solution
i.

\(\text{Resolving forces in}\ \underset{\sim}{j} \ \text{direction:} \)
\( {\underset{\sim}{F}}_\underset{\sim}{j} = \underset{\sim}{R} + m\underset{\sim}{g}\ \cos \theta = 0\ \ \text{(in equilibrium)} \)
\(\text{Resolving forces in}\ \underset{\sim}{i} \ \text{direction:} \)
\( {\underset{\sim}{F}}_\underset{\sim}{i} = -m\underset{\sim}{g} \ \sin \theta \ \ \ \text{(down slope)} \)
\(\therefore \text{Resultant force:}\ \ \underset{\sim}{F}=-(m g \ \sin \theta) \underset{\sim}{i} \)
♦ Mean mark (i) 50%.
ii. \(\text{Using}\ \ \underset{\sim}{F}=m \underset{\sim}{a}: \)
| \(m \underset{\sim}{a}\) | \(=-mg\ \sin \theta \ \underset{\sim}{i} \) | |
| \(\underset{\sim}{a}\) | \(=-g\ \sin \theta \ \underset{\sim}{i} \) | |
| \(\underset{\sim}{v}\) | \(= \displaystyle \int \underset{\sim}{a}\ dt \) | |
| \(=-gt\ \sin \theta +c \) |
\(\text{When}\ \ t=0,\ \ \underset{\sim}{v}=0\ \ \Rightarrow \ \ c=0 \)
\(\therefore \underset{\sim}{v}=-gt\ \sin \theta \ \underset{\sim}{i} \)
PHYSICS, M6 2023 HSC 10 MC
Figure \(\text{I}\) shows a current flowing through a loop of wire that is in a uniform magnetic field.

The loop is then rotated to the position shown in Figure \(\text{II}\).
The magnitude of the force on the side \(X Y\) and the magnitude of the torque on the loop in Figure \(\text{II}\) are compared to those in Figure \(\text{I}\).
Which row of the table correctly describes the comparison?
\begin{align*}
\begin{array}{l}
\rule{0pt}{2.5ex} \ \rule[-1ex]{0pt}{0pt}& \\
\rule{0pt}{2.5ex}\textbf{A.}\rule[-1ex]{0pt}{0pt}\\
\rule{0pt}{2.5ex}\textbf{B.}\rule[-1ex]{0pt}{0pt}\\
\rule{0pt}{2.5ex}\textbf{C.}\rule[-1ex]{0pt}{0pt}\\
\rule{0pt}{2.5ex}\textbf{D.}\rule[-1ex]{0pt}{0pt}\\
\end{array}
\begin{array}{|c|c|}
\hline
\rule{0pt}{2.5ex}\quad \textit{Force}\quad \rule[-1ex]{0pt}{0pt}&\quad \textit{Torque}\quad \\
\hline
\rule{0pt}{2.5ex}\text{I > II}\rule[-1ex]{0pt}{0pt}&\text{I = II}\\
\hline
\rule{0pt}{2.5ex}\text{I > II}\rule[-1ex]{0pt}{0pt}& \text{I > II}\\
\hline
\rule{0pt}{2.5ex}\text{I = II}\rule[-1ex]{0pt}{0pt}& \text{I = II} \\
\hline
\rule{0pt}{2.5ex}\text{I = II}\rule[-1ex]{0pt}{0pt}& \text{I > II} \\
\hline
\end{array}
\end{align*}
Financial Maths, STD1 F3 2023 HSC 30
A plumber leases equipment which is valued at $60 000.
The salvage value of the equipment at any time can be calculated using either of the two methods of depreciation shown in the table.
\begin{array} {|l|c|}
\hline
\rule{0pt}{2.5ex} \textit{Method of depreciation} \rule[-1ex]{0pt}{0pt} & \textit{Rate of depreciation} \\
\hline
\rule{0pt}{2.5ex} \text{Straight-line method} \rule[-1ex]{0pt}{0pt} & \text{\$3500 per annum} \\
\hline
\rule{0pt}{2.5ex} \text{Declining-balance method} \rule[-1ex]{0pt}{0pt} & \text{12% per annum} \\
\hline
\end{array}
Under which method of depreciation would the salvage value of the equipment be lower at the end of 3 years? Justify your answer with appropriate mathematical calculations. (3 marks)
--- 6 WORK AREA LINES (style=lined) ---
Measurement, STD1 M4 2023 HSC 28
The nutrition label for a food item is shown. Based on the information on this label, what is the daily recommended intake of carbohydrates, to the nearest gram? (2 marks) --- 5 WORK AREA LINES (style=lined) ---

Measurement, STD1 M3 2023 HSC 29
The diagram shows the location of three places \(X\), \(Y\) and \(C\).
\(Y\) is on a bearing of 120° and 15 km from \(X\).
\(C\) is 40 km from \(X\) and lies due west of \(Y\).
\(P\) lies on the line joining \(C\) and \(Y\) and is due south of \(X\).

- Find the distance from \(X\) to \(P\). (2 marks)
--- 4 WORK AREA LINES (style=lined) ---
- What is the bearing of \(C\) from \(X\), to the nearest degree? (2 marks)
--- 5 WORK AREA LINES (style=lined) ---
Show Worked Solution
a. \(\text{In}\ \Delta XPY:\)
\(\angle PXY=180-120=60^{\circ}\)
| \(\cos 60^{\circ}\) | \(=\dfrac{XP}{15}\) | |
| \(XP\) | \(=15\times \cos 60^{\circ}\) | |
| \(=7.5\ \text{km}\) |
♦♦ Mean mark (a) 24%.
b. \(\text{In}\ \Delta XPC:\)
\(\text{Let}\ \theta = \angle CXP\)
| \(\cos \theta\) | \(=\dfrac{7.5}{40}\) | |
| \(\theta\) | \(=\cos^{-1} \Big(\dfrac{7.5}{40}\Big)\) | |
| \(=79.193…\) | ||
| \(=79^{\circ}\ \text{(nearest degree)}\) |

| \(\text{Bearing}\ C\ \text{from}\ X\) | \(=180+79\) | |
| \(=259^{\circ}\) |
♦♦♦♦ Mean mark (b) 9%.
Calculus, EXT1 C2 2023 HSC 14a
Let \(f(x)=2 x+\ln x\), for \(x>0\). --- 4 WORK AREA LINES (style=lined) --- --- 8 WORK AREA LINES (style=lined) ---
Vectors, EXT1 V1 2023 HSC 13b
Particle \(A\) is projected from the origin with initial speed \(v\) m s\(^{-1}\) at an angle \(\theta\) with the horizontal plane. At the same time, particle \(B\) is projected horizontally with initial speed \(u\) ms\(^{-1}\) from a point that is \(H\) metres above the origin, as shown in the diagram. The position vector of particle \(A, t\) seconds after it is projected, is given by \[\textbf{r}_A(t)=\left(\begin{array}{c}v t\ \cos \theta \\vt\ \sin\theta-\dfrac{1}{2} g t^2\end{array}\right) \text{. (Do NOT prove this.)}\] The position vector of particle \(B, t\) seconds after it is projected, is given by \[\textbf{r}_B(t)=\left(\begin{array}{c}u t \\H-\dfrac{1}{2} g t^2\end{array}\right) \text{. (Do NOT prove this.)}\] The angle \(\theta\) is chosen so that \(\tan \theta=2\). The two particles collide. --- 5 WORK AREA LINES (style=lined) --- --- 4 WORK AREA LINES (style=lined) --- When the particles collide, their velocity vectors are perpendicular. --- 6 WORK AREA LINES (style=lined) --- --- 5 WORK AREA LINES (style=lined) ---
i. \(\text{Given}\ \ \tan \theta =2\) \(\cos \theta = \dfrac{1}{\sqrt 5} \) \(\text{Since particles collide, for some}\ t: \) \[\textbf{v}_A(t)=\left(\begin{array}{c}v\ \cos \theta \\v\ \sin\theta-gt\end{array}\right)=\left(\begin{array}{c} u \\ 2u-gt \end{array}\right)\] \[\textbf{v}_B(t)=\left(\begin{array}{c}u \\-gt \end{array}\right)\]
\(\text{Since particles are perpendicular at collision:}\) \(\textbf{v}_A \cdot \textbf{v}_B=0\)

Show Worked Solution

\(vt\ \cos \theta\)
\(=ut\)
\(v \cdot \dfrac{1}{\sqrt 5} \)
\(=u\)
\(v\)
\(=\sqrt5 u\)
ii. \(\text{Equating y-components of}\ \textbf{r}_A\ \text{and}\ \textbf{r}_B : \)
\(vt\ \sin \theta-\dfrac{1}{2}gt^2\)
\(=H-\dfrac{1}{2}gt^2\)
\(vt\ \sin \theta\)
\(=H\)
\(u \sqrt{5} \times t \times \dfrac{2}{\sqrt5} \)
\(=H\)
\(t\)
\(= \dfrac{H}{2u} \)
iii. \(\text{Velocity vectors:} \)
♦♦ Mean mark (iii) 37%.
\(u^2+(-gt)(2u-gt)\)
\(=0\)
\(u^2-2gtu+g^2t^2\)
\(=0\)
\((u-gt)^2\)
\(=0\)
\(gt\)
\(=u\)
\(t\)
\(=\dfrac{u}{g}\)
\(\dfrac{H}{2u}\)
\(=\dfrac{u}{g}\ \ \text{(see part (ii))}\)
\(\therefore H\)
\(=\dfrac{2u^2}{g}\)
iv. \(\text{Height of vertex}\ \ \Rightarrow \ \text{Find}\ t\ \text{when y-component of}\ \textbf{v}_A=0 \)
\(v\ \sin \theta-gt\)
\(=0\)
\(t\)
\(=\dfrac{v\ \sin \theta}{g} \)
\(\text{Height of vertex}\ =\ \text{y-component of}\ \textbf{r}_A\ \text{when}\ \ t= \dfrac{v\ \sin \theta}{g} \)
\(\text{Height}\)
\(=vt\ \sin \theta-\dfrac{1}{2}gt^2 \)
\(=\dfrac{v^2\sin^2 \theta}{g}-\dfrac{1}{2}g\Big{(} \dfrac{v^2\sin^2 \theta}{g^2}\Big{)} \)
\(=\dfrac{v^2 \sin^2 \theta}{2g} \)
\(=\dfrac{(2u)^2}{2g} \)
\(=\dfrac{2u^2}{g} \)
\(=H\)
♦♦ Mean mark (iv) 34%.
Calculus, EXT1 C3 2023 HSC 13a
A hemispherical water tank has radius \(R\) cm. The tank has a hole at the bottom which allows water to drain out. Initially the tank is empty. Water is poured into the tank at a constant rate of \(2 k R\) cm³ s\(^{-1}\), where \(k\) is a positive constant. After \(t\) seconds, the height of the water in the tank is \(h\) cm, as shown in the diagram, and the volume of water in the tank is \(V\) cm³. It is known that \(V= \pi \Big{(} R h^2-\dfrac{h^3}{3}\Big{)}. \) (Do NOT prove this.) While water flows into the tank and also drains out of the bottom, the rate of change of the volume of water in the tank is given by \(\dfrac{d V}{d t}=k(2 R-h)\). --- 5 WORK AREA LINES (style=lined) --- --- 6 WORK AREA LINES (style=lined) --- --- 9 WORK AREA LINES (style=lined) ---

Algebra, STD1 A3 2023 HSC 26
Electricity provider \(A\) charges 25 cents per kilowatt hour (kWh) for electricity, plus a fixed monthly charge of $40. \begin{array} {|l|c|} Provider \(B\) charges 35 cents per kWh, with no fixed monthly charge. The graph shows how Provider \(B\) 's charges vary with the amount of electricity used in a month. --- 2 WORK AREA LINES (style=lined) --- --- 5 WORK AREA LINES (style=lined) --- a. \begin{array} {|l|c|} b. c. \(400\text{ kWh}\) d. \(A\text{ is cheaper by }$40.\) a. \begin{array} {|l|c|} b.
c. \(\text{Same charge when Provider }A = \text{Provider } B \text{ i.e. where the lines intersect}\) \(=400\text{ kWh (see graph above)}\) d. \(\text{When kWh}= 800, \ \ A=$240 \text{ and } B=$280\) \(\therefore A\text{ is cheaper by }$40.\)
\hline
\rule{0pt}{2.5ex} \text{Electricity used in a month (kWh)} \rule[-1ex]{0pt}{0pt} & \ \ \ \ \ 0\ \ \ \ \ & \ \ \ 400\ \ \ & \ \ 1000\ \ \\
\hline
\rule{0pt}{2.5ex} \text{Monthly charge (\$)} \rule[-1ex]{0pt}{0pt} & 40 & & 290 \\
\hline
\end{array}
Show Answers Only
\hline
\rule{0pt}{2.5ex} \text{Electricity used in a month (kWh)} \rule[-1ex]{0pt}{0pt} & \ \ \ \ \ 0\ \ \ \ \ & \ \ \ 400\ \ \ & \ \ 1000\ \ \\
\hline
\rule{0pt}{2.5ex} \text{Monthly charge (\$)} \rule[-1ex]{0pt}{0pt} & 40 & \textbf{140} & 290 \\
\hline
\end{array} Show Worked Solution
\hline
\rule{0pt}{2.5ex} \text{Electricity used in a month (kWh)} \rule[-1ex]{0pt}{0pt} & \ \ \ \ \ 0\ \ \ \ \ & \ \ \ 400\ \ \ & \ \ 1000\ \ \\
\hline
\rule{0pt}{2.5ex} \text{Monthly charge (\$)} \rule[-1ex]{0pt}{0pt} & 40 & \textbf{140} & 290 \\
\hline
\end{array}
♦♦ Mean mark (b) 40%.
Financial Maths, STD1 F2 2023 HSC 24
Bobby invested $5000. The table shows the progress of his investment over the first 4 months. --- 4 WORK AREA LINES (style=lined) --- --- 4 WORK AREA LINES (style=lined) ---

Financial Maths, STD1 F2 2023 HSC 21
An amount of $12 000 is invested in an account that pays 1 % interest per quarter, compounding quarterly for five years. What is the future value of this investment? (3 marks)
Statistics, STD1 S3 2023 HSC 19
The scatterplot shows the number of ice-creams sold, \(y\), at a shop over a ten-day period, and the temperature recorded at 2 pm on each of these days. \(y=0.936 x-8.929\), where \(x\) is the temperature. --- 4 WORK AREA LINES (style=lined) --- --- 3 WORK AREA LINES (style=lined) ---

Measurement, STD1 M3 2023 HSC 16
From the top of a vertical cliff 120 metres high, a boat is observed. The angle of depression of the boat from the top of the cliff is 18°, as shown in the diagram. Find the distance of the boat from the base of the cliff. Give your answer to the nearest metre. (2 marks) --- 5 WORK AREA LINES (style=lined) --- \(\text{Let }x\text{ be the distance from the cliff to the boat.}\) \(\text{The angle at the boat}=18^{\circ}\text{ as it is alternate to the angle of depression from the cliff to the boat.}\)

Show Worked Solution

\(\tan\theta\)
\(=\dfrac{\text{opp}}{\text{adj}}\)
\(\tan 18^{\circ}\)
\(=\dfrac{120}{x}\)
\(x\)
\(=\dfrac{120}{\tan 18^{\circ}}\)
\(=369.322\ldots \text{m}\)
\(\approx 369 \text{ m (nearest metre)}\)
♦♦ Mean mark 30%.
Statistics, STD1 S1 2023 HSC 13
The graph shows the frequency of scores out of 10 awarded to a museum by visitors. --- 2 WORK AREA LINES (style=lined) --- --- 5 WORK AREA LINES (style=lined) ---

Measurement, STD1 M5 2023 HSC 12
A floor plan is shown. --- 4 WORK AREA LINES (style=lined) --- --- 5 WORK AREA LINES (style=lined) --- --- 2 WORK AREA LINES (style=lined) ---

Calculus, EXT1 C3 2023 HSC 12e
The region, \(R\), bounded by the hyperbola \(y=\dfrac{60}{x+5}\), the line \(x=10\) and the coordinate axes is shown. Find the volume of the solid of revolution formed when the region \(R\) is rotated about the \(y\)-axis. Leave your answer in exact form. (4 marks) --- 8 WORK AREA LINES (style=lined) ---

Measurement, STD1 M4 2023 HSC 10 MC
A tap is dripping at the rate of 4 mL per minute.
Which expression shows how many litres this would amount to in one year?
- \(\dfrac{4 \times 1000}{60 \times 24 \times 365}\)
- \(\dfrac{4 \times 60 \times 24 \times 365}{1000}\)
- \(\dfrac{60 \times 24 \times 365}{4 \times 1000}\)
- \(\dfrac{1000}{4 \times 60 \times 24 \times 365}\)
Measurement, STD1 M5 2023 HSC 9 MC
A bag contains 150 jelly beans. Some of them are red and the rest are blue. The ratio of red to blue jelly beans is 2 : 3.
Sophie eats 10 of each colour.
What is the new ratio of red to blue jelly beans?
- \(2 : 3\)
- \(4 : 9\)
- \(5 : 8\)
- \(11 : 17\)
Algebra, STD1 A3 2023 HSC 4 MC
The diagram shows water in a pool which is in the shape of a triangular prism. The pool is being emptied of water at a constant rate.

Which graph best illustrates the change in depth of water with time?


Measurement, STD1 M5 2023 HSC 3 MC
Two towns are \(5\) cm apart on a map that uses a scale of \(1 : 100\ 000\).
What is the actual distance between the two towns?
- \(5\text{ km}\)
- \(50\text{ km}\)
- \(500\text{ km}\)
- \(5000\text{ km}\)
Functions, EXT1 F1 2023 HSC 9 MC
The graph of a cubic function, \(y=f(x)\), is given below.

Which of the following functions has an inverse relation whose graph has more than 3 points with an \(x\)-coordinate of 1 ?
- \(y=\sqrt{f(x)}\)
- \(y=\dfrac{1}{f(x)}\)
- \(y=f(|x|)\)
- \(y=|f(x)|\)
Vectors, EXT1 V1 2023 HSC 6 MC
Given the two non-zero vectors \(\underset{\sim}{a}\) and \(\underset{\sim}{b}\), let \(\underset{\sim}{c}\) be the projection of \(\underset{\sim}{a}\) onto \(\underset{\sim}{b}\).
What is the projection of \(10 \underset{\sim}{a}\) onto \(2 \underset{\sim}{b}\) ?
- \(2 \underset{\sim}{c}\)
- \(5 \underset{\sim}{c}\)
- \(10 \underset{\sim}{c}\)
- \(20 \underset{\sim}{c}\)
Calculus, 2ADV C3 2023 HSC 30
Let \(f(x)=e^{-x} \sin x\). --- 6 WORK AREA LINES (style=lined) --- --- 0 WORK AREA LINES (style=lined) --- a. \( \Big(\dfrac{\pi}{4},\dfrac{1}{\sqrt2 \times e^{\frac{\pi}{4}}}\Big)\ \text{and}\ \Big(\dfrac{5\pi}{4},\dfrac{-1}{\sqrt2 \times e^{\frac{5\pi}{4}}}\Big)\) b. a. \(f(x)=e^{-x} \sin x\) \(f^{′}(x)=e^{-x} \cos x-e^{-x} \sin x = e^{-x}( \cos x-\sin x) \) \(\text{SPs when}\ f^{′}(x)=0: \) \(e^{-x}=0\ \ \rightarrow \ \text{no solution} \) \(x=\dfrac{\pi}{4}, \dfrac{5\pi}{4} \) \(f(\dfrac{\pi}{4})=e^{-\frac{\pi}{4}}\sin \frac{\pi}{4}=\dfrac{1}{\sqrt2 \times e^{\frac{\pi}{4}}} \) \(f(\dfrac{5\pi}{4})=e^{-\frac{5\pi}{4}}\sin \frac{5\pi}{4}=\dfrac{-1}{\sqrt2 \times e^{\frac{5\pi}{4}}} \) \(\therefore\ \text{SPs at}\ \Big(\dfrac{\pi}{4},\dfrac{1}{\sqrt2 \times e^{\frac{\pi}{4}}}\Big)\ \text{and}\ \Big(\dfrac{5\pi}{4},\dfrac{-1}{\sqrt2 \times e^{\frac{5\pi}{4}}}\Big)\)

Show Answers Only
 Show Worked Solution
\(\cos x-\sin x\)
\(=0\)
\(1-\tan x\)
\(=0\)
\(\tan\)
\(=1\)
Mean mark (a) 54%.
b. \(\ x\text{-intercepts at}\ \ x=0, \pi,\ 2\pi \)
♦♦ Mean mark (b) 34%.
Probability, 2ADV S1 2023 HSC 31
Four Year 12 students want to organise a graduation party. All four students have the same probability, \(P(F)\), of being available next Friday. All four students have the same probability, \(P(S)\), of being available next Saturday. It is given that \(P(F)=\dfrac{3}{10}, P(S\mid F)=\dfrac{1}{3}\), and \(P(F\mid S)=\dfrac{1}{8}\). Kim is one of the four students. --- 2 WORK AREA LINES (style=lined) --- --- 5 WORK AREA LINES (style=lined) --- --- 3 WORK AREA LINES (style=lined) ---
Statistics, 2ADV S3 2023 HSC 29
A continuous random variable \(X\) has probability density function \(f(x)\) given by \(f(x)=\left\{\begin{array}{cl} 12 x^2(1-x), & \text { for } 0 \leq x \leq 1 \\ 0, & \text { for all other values of } x \end{array}\right.\) --- 6 WORK AREA LINES (style=lined) --- --- 6 WORK AREA LINES (style=lined) --- --- 5 WORK AREA LINES (style=lined) ---
Calculus, 2ADV C4 2023 HSC 28
The curve \(y=f(x)\) is shown on the diagram. The equation of the tangent to the curve at point \(T(-1,6)\) is \(y=x+7\). At a point \(R\), another tangent parallel to the tangent at \(T\) is drawn. The gradient function of the curve is given by \(\dfrac{dy}{dx}=3x^2-6x-8\). Find the coordinates of \(R\). (4 marks) --- 8 WORK AREA LINES (style=lined) ---

Calculus, 2ADV C4 2023 HSC 26
A camera films the motion of a swing in a park. Let \(x(t)\) be the horizontal distance, in metres, from the camera to the seat of the swing at \(t\) seconds. The seat is released from rest at a horizontal distance of 11.2 m from the camera. \(\dfrac{dx}{dt}=-1.5\pi\ \sin(\dfrac{5\pi}{4}t)\). --- 4 WORK AREA LINES (style=lined) --- --- 4 WORK AREA LINES (style=lined) ---

Financial Maths, 2ADV M1 2023 HSC 25
On the first day of November, Jia deposits $10 000 into a new account which earns 0.4% interest per month, compounded monthly. At the end of each month, after the interest is added to the account, Jia intends to withdraw \($M\) from the account.
Let \(A_n\) be the amount (in dollars) in Jia's account at the end of \(n\) months.
- Show that \(A_2 = 10\ 000(1.004)^2-M(1.004)-M\). (1 mark)
--- 2 WORK AREA LINES (style=lined) ---
- Show that \(A_n = (10\ 000-250M)(1.004)^n + 250M\). (3 marks)
--- 6 WORK AREA LINES (style=lined) ---
- Jia wants to be able to make at least 100 withdrawals.
- What is the largest value of \(M\) that will enable Jia to do this? (2 marks)
--- 4 WORK AREA LINES (style=lined) ---
Calculus, 2ADV C3 2023 HSC 24
A gardener wants to build a rectangular garden of area 50 m² against an existing wall as shown in the diagram. A concrete path of width 1 metre is to be built around the other three sides of the garden. Let \(x\) and \(y\) be the dimensions, in metres, of the outer rectangle as shown. --- 2 WORK AREA LINES (style=lined) --- --- 8 WORK AREA LINES (style=lined) ---

Calculus, 2ADV C1 2023 HSC 7 MC
It is given that `y=f(g(x))`, where `f(1)=3`, `f^{′}(1)=-4`, `g(5)=1` and `g^{′}(5)=2`.
What is the value of `y^{′}` at `x=5`?
- `-8`
- `-4`
- `3`
- `6`
Calculus, 2ADV C4 2023 HSC 5 MC
The diagram shows the graph `y=f(x)`, where `f(x)` is an odd function.
The shaded area is 1 square unit.
The number `a`, where `a > 1`, is chosen so that `int_0^a f(x)\ dx=0`.

What is the value of `int_{-a}^1 f(x)\ dx` ?
- `-1`
- `0`
- `1`
- `3`
Statistics, STD2 S5 2023 HSC 38
A random variable is normally distributed with a mean of 0 and a standard deviation of 1 . The table gives the probability that this random variable lies below `z` for some positive values of `z`.

The probability values given in the table are represented by the shaded area in the following diagram.

The weights of adult male koalas form a normal distribution with mean `mu` = 10.40 kg, and standard deviation `sigma` = 1.15 kg.
In a group of 400 adult male koalas, how many would be expected to weigh more than 11.93 kg? (4 marks)
--- 8 WORK AREA LINES (style=lined) ---
Statistics, STD2 S4 2023 HSC 34
A university uses gas to heat its buildings. Over a period of 10 weekdays during winter, the gas used each day was measured in megawatts (MW) and the average outside temperature each day was recorded in degrees Celsius (°C). Using `x` as the average daily outside temperature and `y` as the total daily gas usage, the equation of the least-squares regression line was found. The equation of the regression line predicts that when the temperature is 0°C, the daily gas usage is 236 MW. The ten temperatures measured were: 0°, 0°, 0°, 2°, 5°, 7°, 8°, 9°, 9°, 10°, The total gas usage for the ten weekdays was 1840 MW. In any bivariate dataset, the least-squares regression line passes through the point `(bar x,bar y)`, where `bar x` is the sample mean of the `x`-values and `bary` is the sample mean of the `y`-values. --- 4 WORK AREA LINES (style=lined) --- --- 2 WORK AREA LINES (style=lined) --- a. b. `y=-10.4x+236` c. `text{Answers could include one of the following:}` `text{→ 23°C is outside the range of the dataset and requires the trend}` `text{to be extrapolated.}` `text{→ At 23°C, the equation predicts negative daily gas usage.}` a. `barx=(0+0+0+2+5+7+8+9+9+10)/10=5^@text{C}` `bary=1840/10=184` `text{Regression line passes through:}\ (0,236) and (5,184)`
b. `m=(y_2-y_1)/(x_2-x_1)=(184-236)/(5-0)=-10.4` `text{Equation of line}\ m=-10.4\ text{passing through}\ (0,236):` `text{→ 23°C is outside the range of the dataset and requires the trend}` `text{to be extrapolated.}` `text{→ At 23°C, the equation predicts negative daily gas usage.}`

Show Answers Only
 Show Worked Solution
♦ Mean mark (a) 44%.
`(y-y_1)`
`=m(x-x_1)`
`y-236`
`=-10.4(x-0)`
`y`
`=-10.4x+236`
♦♦♦ Mean mark (b) 21%.
c. `text{Answers could include one of the following:}`
♦♦♦ Mean mark 23%.
Measurement, STD2 M6 2023 HSC 33
The diagram shows a shape `APQBCD`. The shape consists of a rectangle `ABCD` with an arc `PQ` on side `AB` and with side lengths `BC` = 3.6 m and `CD` = 8.0 m.
The arc `PQ` is an arc of a circle with centre `O` and radius 2.1 m and `∠POQ=110°`.

What is the perimeter of the shape `APQBCD`? Give your answer correct to one decimal place. (4 marks)
--- 8 WORK AREA LINES (style=lined) ---
Show Worked Solution
| `text{Arc}\ PQ` | `=110/360 xx pi xx 2.1^2` | |
| `=4.03171… \ text{m}` |
`text{Consider}\ ΔOPQ:`

♦ Mean mark 42%.
| `sin 55^@` | `=x/2.1` | |
| `x` | `=2.1 xx sin 55^@` | |
| `=1.7202…` |
`PQ=2x=3.440\ text{m}`
| `:.\ text{Perimeter}` | `=8+(2xx3.6)+4.031+(8-3.440)` | |
| `=23.79…` | ||
| `=23.8\ text{m (to 1 d.p.)}` |
Financial Maths, STD2 F4 2023 HSC 32
Ali has a credit card which has no interest-free period. Interest is charged at 13.5% per annum, compounding daily, on the amount owing. During the month, Ali made only one purchase of $450 using the credit card. The full amount owing was repaid 21 days later.
Networks, STD2 N3 2023 HSC 31
A function centre employs staff so that all necessary tasks can be completed between the end of one function and the beginning of the next function. The network diagram shows the time taken in hours for the tasks that need to be completed. --- 4 WORK AREA LINES (style=lined) --- --- 4 WORK AREA LINES (style=lined) --- a. `text{Scanning both ways:}` `text{Critical paths:}\ HIGC and HIK` `text{By decreasing task}\ I\ text{by 3 hours (so it takes 4 hours), the}` `text{critical path of the network reduces to 14 hours.}`

Show Worked Solution
 ♦ Mean mark (a) 46%.
b. `text{More staff should be hired for task}\ I.`
Mean mark (b) 52%.
Financial Maths, STD2 F1 2023 HSC 30
A receipt from a supermarket shows a total of $124.87. The GST shown on the receipt is $3.86. GST, at a rate of 10%, is only charged on some items. What was the value of the items which did NOT have GST charged? (3 marks)
Financial Maths, STD2 F4 2023 HSC 29
The table shows monthly repayments for each $1000 borrowed.

- A couple borrows $520 000 to buy a house at 8% per annum over 25 years.
- How much does the couple repay in total for this loan? (3 marks)
--- 7 WORK AREA LINES (style=lined) ---
- Chris borrows some money at 7% per annum. Chris will repay the loan over 15 years, paying $3596 per month.
- How much money does Chris borrow? (1 mark)
--- 3 WORK AREA LINES (style=lined) ---
Measurement, STD2 M6 2023 HSC 27
The diagram shows the location of three places `X`, `Y` and `C`.
`Y` is on a bearing of 120° and 15 km from `X`.
`C` is 40 km from `X` and lies due west of `Y`.
`P` lies on the line joining `C` and `Y` and is due south of `X`.
- Find the distance from `X` to `P`. (2 marks)
--- 4 WORK AREA LINES (style=lined) ---
- What is the bearing of `C` from `X`, to the nearest degree? (2 marks)
--- 4 WORK AREA LINES (style=lined) ---
Show Worked Solution
a. `text{In}\ ΔXPY:`
`anglePXY=180-120=60^@`
| `cos 60^@` | `=(XP)/15` | |
| `XP` | `=15 xx cos 60^@` | |
| `=7.5\ text{km}` |
b. `text{In}\ ΔXPC:`
`text{Let}\ \ theta = angleCXP`
| `cos theta` | `=7.5/40` | |
| `theta` | `=cos^{-1}(7.5/40)` | |
| `=79.193…` | ||
| `=79^@\ \ text{(nearest degree)}` |
| `text{Bearing}\ C\ text{from}\ X` | `=180+79` | |
| `=259^@` |
♦ Mean mark (b) 39%.
Measurement, STD2 M1 2023 HSC 24
The diagram shows the cross-section of a wall across a creek.

- Use two applications of the trapezoidal rule to estimate the area of the cross-section of the wall. (2 marks)
--- 4 WORK AREA LINES (style=lined) ---
- The wall has a uniform thickness of 0.80 m. The weight of 1 m³ of concrete is 3.52 tonnes.
- How many tonnes of concrete are in the wall? Give the answer to two significant figures. (3 marks)
--- 6 WORK AREA LINES (style=lined) ---
Networks, STD2 N2 2023 HSC 19
A network of running tracks connects the points `A, B, C, D, E, F, G, H`, as shown. The number on each edge represents the time, in minutes, that a typical runner should take to run along each track. --- 4 WORK AREA LINES (style=lined) --- --- 4 WORK AREA LINES (style=lined) ---
a. `text{Using Djikstra’s Algorithm:}` `=3+11+1+2+4+5+5` `=31` `text{Consider the MST below:}` `text{Total time (MST)}\ = 3+1+2+4+5+5+9=29` `:.\ text{Given tree is NOT a MST.}`


Show Worked Solution

`text{Shortest route}`
`=ABFGD`
`=3+1+5+5`
`=14`
b. `text{Total time of given spanning tree}`
 ♦ Mean mark (b) 47%.
Statistics, STD2 S5 2023 HSC 18
The histogram shows a summary of scores on a test.

Provide TWO features of the histogram that indicate that the data comes from a normal distribution. (2 marks)
Statistics, STD2 S1 2023 HSC 15 MC
Ashan's mathematics class needs to complete six tests, each worth 100 marks.
After completing the first five tests, Ashan calculated that he would need a mark of 90 in the final test in order to have a mean mark of 80 for the six tests.
What was Ashan's mean mark after completing the first five tests?
- 78
- 74
- 70
- 65
Networks, STD2 N3 2023 HSC 14 MC
A network with source `A` and sink `B` is shown. The capacities of two paths are labelled. The cut shown on the diagram has a capacity of 30 .

Which of the following statements is correct?
- The maximum flow is 30.
- The maximum flow is 35.
- The maximum flow is 30 or less.
- The maximum flow is 30 or more.
Financial Maths, STD2 F1 2023 HSC 13 MC
An item is discounted by 30% and then a further discount of 20% is applied to the reduced price.
What is the total percentage discount?
- 25%
- 44%
- 50%
- 56%
Measurement, STD2 M6 2023 HSC 12 MC
A cylindrical pipe with a radius of 12.5 cm is filled with water to a depth, `d` cm, as shown.
The surface of the water has a width of 20 cm.

What is the depth of water in the pipe?
- 2.5 cm
- 5.0 cm
- 7.5 cm
- 12.5 cm
Financial Maths, STD2 F1 2023 HSC 6 MC
An item was purchased for a price of $880, including 10% GST.
What is the amount of GST included in the price?
- $8.00
- $8.80
- $80.00
- $88.00
BIOLOGY, M2 2013 HSC 35d
Analyse how the use of isotopes has contributed to tracing biochemical pathways in plants. (6 marks)
--- 10 WORK AREA LINES (style=lined) ---
BIOLOGY, M2 2014 HSC 14 MC
The current theory to explain the movement of materials within the phloem of a living plant involves the following steps:
-
- Osmosis
- Active transport of sugars into non-photosynthetic cells
- Active transport of sugars from photosynthetic cells
- Flow of sugar solution up and down
Which of the following is the correct order of these steps?
- 3, 4, 1, 2
- 2, 4, 1, 3
- 1, 3, 2, 4
- 3, 1, 4, 2
BIOLOGY, M2 2014 HSC 8 MC

What is the most suitable title for this diagram?
- A section of xylem tissue
- A section of phloem tissue
- A transverse section of phloem tissue
- A longitudinal section of xylem and phloem tissue
BIOLOGY, M3 2015 HSC 30
The graph shows the history of the relative numbers of three varieties of bird \((X, Y\) and \(Z\) ) within a bird species, on a remote island in the Pacific Ocean.
The bird species arrived on the island in a migration event. Before migration, the bird species was not present on the island.
The graph record of bird numbers on the island is divided into two sections (1 and 2). Over the time data were recorded, the environment of the island did not change.

- What bird varieties originally migrated to the island? (1 mark)
--- 1 WORK AREA LINES (style=lined) ---
- Using the Darwin/Wallace theory of evolution, and making reference(s) to the data in the graph, explain the changes to the population of each variety of bird in
- i. section (1) of the graph. (2 marks)
--- 4 WORK AREA LINES (style=lined) ---
- ii. section (2) of the graph. (4 marks)
--- 8 WORK AREA LINES (style=lined) ---
BIOLOGY, M2 2015 HSC 36e
'Science has been used to solve problems in the investigation of photosynthesis, and so has provided information of benefit to society.'
Justify this statement with reference to the scientific knowledge behind radioactive tracers for the study of photosynthesis. (7 marks)
--- 20 WORK AREA LINES (style=lined) ---
BIOLOGY, M2 2016 HSC 36e
'Over the past 400 years, the development of our knowledge of the chemical transformations occurring both inside and outside plants has led to our current understanding of photosynthesis.'
Evaluate this statement with reference to the experiments of TWO named scientists. (7 marks)
--- 16 WORK AREA LINES (style=lined) ---
BIOLOGY, M2 2016 HSC 17 MC
Capillaries have thin walls that help them perform their main function.
The best explanation for this is that
- capillaries are the smallest vessels in the body.
- thin walls are an adaptation that help diffusion.
- blood flow in capillaries is under very low pressure.
- thin walls maximise the surface area available for gas exchange.
BIOLOGY, M2 2016 HSC 16 MC
Ringbarking is the removal of a thin strip of bark from the entire circumference of a tree.
The tree will initially survive, but the roots will eventually die because ringbarking stops
- photosynthesis.
- the transport of water.
- the transport of oxygen.
- the transport of dissolved nutrients.
BIOLOGY, M1 2016 HSC 9 MC
Why is passive transport alone inadequate for the production of urine that is high in nitrogenous wastes?
- Osmosis cannot target specific solutes.
- Solutes cannot move against a concentration gradient.
- Solute transport increases at low concentration gradients.
- Osmosis moves water from a low concentration to a high concentration.
BIOLOGY, M1 2017 HSC 36e
Analyse the impact of the development of the electron microscope on the understanding of chloroplast structure and function. (7 marks)
--- 14 WORK AREA LINES (style=lined) ---
BIOLOGY, M1 2017 HSC 20 MC
A student performed a valid enzyme-substrate experiment. At the end of each 10-minute period, the quantity of the gaseous product formed was collected,
removed and measured. The graph shows the results of this experiment.

Which of the following statements explains the trend shown in the graph?
- The rate of enzyme activity is decreasing.
- The concentration of the product is decreasing.
- The concentration of the enzyme is decreasing.
- The concentration of the substrate is decreasing.
BIOLOGY, M1 2017 HSC 18 MC
A student used a microscope to estimate the size of blood cells. Two types of cells were observed. The student estimated one type to be about 50% larger than the other.
Which of the following could be used to assess the accuracy of the student's findings?
- The size of other body cells
- The sizes of blood cells estimated by other students
- The expected sizes of blood cells quoted in scientific literature
- The average size of blood cells from three repetitions of the investigation
- « Previous Page
- 1
- …
- 31
- 32
- 33
- 34
- 35
- …
- 82
- Next Page »