SmarterEd

Aussie Maths & Science Teachers: Save your time with SmarterEd

  • Login
  • Get Help
  • About

CHEMISTRY, M8 2017 HSC 8 MC

There are two unlabelled solutions. One is barium nitrate and the other lead nitrate.

Which of the following could be added to the two unlabelled solutions to distinguish between them?

  1. Sodium sulfate
  2. Sodium nitrate
  3. Sodium chloride
  4. Sodium carbonate
Show Answers Only

`C`

Show Worked Solution
  • If sodium chloride is added to barium nitrate, barium chloride (soluble) is formed but no precipitate results.
  • If sodium chloride is added to lead nitrate, lead chloride (insoluble) is formed and a precipitate results.
  • All other options will produce either a precipitate or no precipitate in both solutions and not distinguish between them.

`=>C`


♦ Mean mark 49%.

Filed Under: Inorganic Substances Tagged With: Band 5, smc-3682-10-Tests for Ions in Solution

CHEMISTRY, M7 2017 HSC 7 MC

Three test tubes were set up as shown.


Bromine water was added to `X` and `Y` in the absence of UV light.

Which of the following best represents the changes in test tubes `X` and `Y` ?
 

Show Answers Only

`C`

Show Worked Solution

By Elimination:

  • Liquids are immiscible (eliminate A and D).
  • Bromine water does not decolourise with with alkanes, but does with alkenes (eliminate B).

`=>C`


♦♦ Mean mark 33%.

Filed Under: Hydrocarbons and Associated Reactions Tagged With: Band 5, smc-3677-70-Reactions of Unsaturated Hydrocarbons, smc-3677-80-Reactions of Saturated Hydrocarbons

BIOLOGY, M7 2018 HSC 3 MC

Which defence adaptation in the table is correctly matched with one of its features?

\begin{align*}
\begin{array}{l}
\rule{0pt}{2.5ex} \ \rule[-1ex]{0pt}{0pt}& \\
\rule{0pt}{2.5ex}\textbf{A.}\rule[-1ex]{0pt}{0pt}\\
\rule{0pt}{2.5ex}\textbf{B.}\rule[-1ex]{0pt}{0pt}\\
\rule{0pt}{2.5ex}\textbf{C.}\rule[-1ex]{0pt}{0pt}\\
\rule{0pt}{2.5ex}\textbf{D.}\rule[-1ex]{0pt}{0pt}\\
\end{array}
\begin{array}{|l|l|}
\hline
\rule{0pt}{2.5ex}\ \text{Defence adaptation}\rule[-1ex]{0pt}{0pt}& \quad \quad \quad \quad \quad  \quad \quad \quad \quad \text{Feature} \\
\hline
\rule{0pt}{2.5ex}\text{Inflammation }\rule[-1ex]{0pt}{0pt}&\text{Constriction of blood vessels}\\
\hline
\rule{0pt}{2.5ex}\text{Phagocytosis}\rule[-1ex]{0pt}{0pt}& \text{Production of antibodies by white blood cells}\\
\hline
\rule{0pt}{2.5ex}\text{Lymph system}\rule[-1ex]{0pt}{0pt}& \text{Transportation of blood to help fight pathogens} \\
\hline
\rule{0pt}{2.5ex}\text{Cell death}\rule[-1ex]{0pt}{0pt}& \text{Formation of a barrier around the pathogen} \\
\hline
\end{array}
\end{align*} 

Show Answers Only

\(D\)

Show Worked Solution
  • In some cases, such as in response to leprosy or tuberculosis, the body seals off a pathogen by forming a granuloma, a collection of cells containing macrophages, lymphocytes then fibroblasts (a structural cell involved in connective tissue), which forms a tough outer wall.

\(\Rightarrow D\)


♦ Mean mark 45%.

Filed Under: Immunity and Responses to Pathogens Tagged With: Band 5, smc-3657-30-Innate Response (2nd Line)

PHYSICS, M7 2015 HSC 29

In the Large Hadron Collider (LHC), protons travel in a circular path at a speed greater than 0.9999 `c`.

  1. What are the advantages of using superconductors to produce the magnetic fields used to guide protons around the LHC?   (2 marks)

--- 4 WORK AREA LINES (style=lined) ---

  1. Discuss the application of special relativity to the protons in the LHC.   (3 marks)

--- 6 WORK AREA LINES (style=lined) ---

Show Answers Only

a.    Advantages:

  • Strong magnetic fields are necessary to deflect protons travelling around the LHC due to their high velocities and the effect of mass dilation.
  • Superconductors can achieve very high current flow. This produces the very strong magnetic fields that are required.
     

b.    Applications of special relativity:

  • Since the protons are travelling so close to the speed of light, special relativity states that mass dilation will be significant.
  • This effect means that an increasing amount of energy is needed to accelerate the proton.

Other answers could include:

  • Effects of length contraction/time dilation.
  • Identification of the non-inertial frame of reference.
Show Worked Solution

a.   Advantages:

  • Strong magnetic fields are necessary to deflect protons travelling around the LHC due to their high velocities and the effect of mass dilation.
  • Superconductors can achieve very high current flow. This produces the very strong magnetic fields that are required.

♦ Mean mark (a) 45%.

b.   Applications of special relativity:

  • Since the protons are travelling so close to the speed of light, special relativity states that mass dilation will be significant.
  • This effect means that an increasing amount of energy is needed to accelerate the proton.

Other answers could include:

  • Effects of length contraction/time dilation.
  • Identification of the non-inertial frame of reference.

♦ Mean mark (b) 53%.

Filed Under: Light and Special Relativity Tagged With: Band 5, smc-3699-30-Momentum Dilation and calcs

PHYSICS, M5 2015 HSC 26

Consider the following two models used to calculate the work done when a 300 kg satellite is taken from Earth's surface to an altitude of 200 km.

You may assume that the calculations are correct.
 

  1. What assumptions are made about Earth's gravitational field in models `X` and `Y` that lead to the different results shown?   (2 marks)

--- 5 WORK AREA LINES (style=lined) ---

  1. Why do models `X` and `Y` produce results that, although different, are close in value?   (1 mark)

--- 3 WORK AREA LINES (style=lined) ---

  1. Calculate the orbital velocity of the satellite in a circular orbit at the altitude of 200 km.   (3 marks)

--- 5 WORK AREA LINES (style=lined) ---

Show Answers Only

a.  Model `X`:

  • Assumes Earth’s gravitational field strength remains constant moving upwards from the surface.

Model `Y`:

  • Assumes Earth’s gravitational field strength changes with altitude.

b.   Similarity of results due to:

  • The variation in gravitational field strength from Earth’s surface to an altitude of 200 km is minimal, so both models `X` and `Y` produce similar results.

c.   `v=7797  text{ms}^(-1)`

Show Worked Solution

a.  Model `X`:

  • Assumes Earth’s gravitational field strength remains constant moving upwards from the surface.

Model `Y`:

  • Assumes Earth’s gravitational field strength changes with altitude.

♦ Mean mark (a) 54%.

b.   Similarity of results due to:

  • The variation in gravitational field strength from Earth’s surface to an altitude of 200 km is minimal, so both models `X` and `Y` produce similar results.

♦♦ Mean mark (b) 38%.

c.    Centripetal force = force due to gravity:

`F_(c)` `=F_(g)`  
`(mv^2)/(r)` `=(GMm)/(r^2)`  
`:.v` `=sqrt((GM)/(r))=sqrt((6.67 xx10^(-11)xx6xx10^(24))/(6.58 xx10^(6)))=7797  text{ms}^(-1)`  

Filed Under: Circular Motion, Motion in Gravitational Fields Tagged With: Band 4, Band 5, smc-3691-20-Applications of Circular Motion, smc-3691-80-Satellites, smc-3692-30-Orbital Velocity/Period/Radius

PHYSICS, M6 2015 HSC 25b

The diagram shows a label on a transformer used in an appliance.

     
Explain why the information provided on the label is not correct. Support your answer with calculations.   (3 marks)

--- 6 WORK AREA LINES (style=lined) ---

Show Answers Only

Calculating the input power:

`P=VI=240 xx5=1200\  text{W}` 

Calculating the output power:

`P=VI=2000 xx 1=2000\  text{W}`

  • The output power is greater than the input power.
  • The label is incorrect as this is inconsistent with the law of conservation of energy.
Show Worked Solution

Calculating the input power:

`P=VI=240 xx5=1200\  text{W}` 

Calculating the output power:

`P=VI=2000 xx 1=2000\  text{W}`

  • The output power is greater than the input power.
  • The label is incorrect as this is inconsistent with the law of conservation of energy.

♦ Mean mark 45%.

Filed Under: Electromagnetic Induction Tagged With: Band 5, smc-3705-50-Transformer Calcs

PHYSICS, M5 2015 HSC 20 MC

A projectile was launched from the ground. It had a range of 70 metres and was in the air for 3.5 seconds.

At what angle to the horizontal was it launched?

  1. 30°
  2. 40°
  3. 50°
  4. 60°
Show Answers Only

`B`

Show Worked Solution

Find `u_(x):`

`s_(x)` `=u_(x)t`  
`u_(x)` `=(70)/(3.5)=20  text{ms}^(-1)`  

 
Find `u_(y)` (projectile has a vertical velocity of zero at its maximum height):

`v_(y)` `=u_(y)+a_(y)t`  
`0` `=u_(y)-9.8xx1.75`  
`u_(y)` `=17.15  text{ms}^(-1)`  

  
Find launch angle:

`tan theta` `=(u_(y))/(u_(x))`  
`theta` `=tan^(-1)((17.15)/(20))=40^(@)`  

 
`=>B`


♦ Mean mark 55%.

Filed Under: Projectile Motion Tagged With: Band 5, smc-3690-30-Launch Angle

PHYSICS, M6 2015 HSC 18 MC

The diagram shows an ideal transformer.
 

When the switch is closed, the pointer on the galvanometer deflects.

How could the size of the deflection be increased?

  1. Decrease the number of primary coils
  2. Decrease the number of secondary coils
  3. Replace the iron core with a copper core
  4. Place a resistor in series with the galvanometer
Show Answers Only

`B`

Show Worked Solution
  • In order to increase the deflection of the galvanometer, the current through the secondary coil must increase.
  •    `(V_(s))/(V_(p))=(n_(s))/(n_(p))\ \ =>\ \ V_(s)=(V_(p)n_(s))/(n_(p))`
  •    `V_(s) prop n_(s)`
  • Decreasing the number of secondary coils will decrease `V_(s)`.
  •    `V_(s)I_(s)=V_(p)I_(p)\ \ =>\ \ V_(s) prop (1)/(I_(s))`
  • Decreasing the number of secondary coils will increase `I_(s)`.

`=>B`


♦ Mean mark 45%.

Filed Under: Electromagnetic Induction Tagged With: Band 5, smc-3705-50-Transformer Calcs

PHYSICS, M6 2015 HSC 15 MC

A circular loop of wire is stationary in a magnetic field. The sides are then pushed together to change the shape, as shown in the diagram.
 

As the loop is compressed, a current is induced.

Which row of the table shows the direction of the current and explains why it is induced?

\begin{align*}
\begin{array}{l}
\rule{0pt}{2.5ex} \ \rule[-1ex]{0pt}{0pt}& \\
\rule{0pt}{2.5ex}\textbf{A.}\rule[-1ex]{0pt}{0pt}\\
\rule{0pt}{2.5ex}\textbf{B.}\rule[-1ex]{0pt}{0pt}\\
\rule{0pt}{2.5ex}\textbf{C.}\rule[-1ex]{0pt}{0pt}\\
\rule{0pt}{2.5ex}\textbf{D.}\rule[-1ex]{0pt}{0pt}\\
\end{array}
\begin{array}{|l|l|}
\hline
\rule{0pt}{2.5ex}\textit{Current Direction}\rule[-1ex]{0pt}{0pt}& \textit{Why the current is induced} \\
\hline
\rule{0pt}{2.5ex}\text{Clockwise}\rule[-1ex]{0pt}{0pt}&\text{Change in magnetic flux}\\
\hline
\rule{0pt}{2.5ex}\text{Anticlockwise}\rule[-1ex]{0pt}{0pt}& \text{Change in magnetic flux}\\
\hline
\rule{0pt}{2.5ex}\text{Clockwise}\rule[-1ex]{0pt}{0pt}& \text{Change in magnetic flux density} \\
\hline
\rule{0pt}{2.5ex}\text{Anticlockwise}\rule[-1ex]{0pt}{0pt}& \text{Change in magnetic flux density} \\
\hline
\end{array}
\end{align*}

Show Answers Only

\(A\)

Show Worked Solution
  • Compressing the loop decreases the area of the loop.
  • There is a change (reduction) in magnetic flux passing through the loop.
  • A current is generated in the loop in order to mitigate this change by producing a magnetic field directed into the page.
  • Using the right hand grip rule, the current direction is clockwise.

\(\Rightarrow A\)


♦♦ Mean mark 38%.

Filed Under: Electromagnetic Induction Tagged With: Band 5, smc-3705-40-Lenz and Faraday

PHYSICS, M6 2015 HSC 12 MC

A simple AC generator was connected to a cathode ray oscilloscope and the coil was rotated at a constant rate. The output is shown on this graph.
 

Which of the following graphs best represents the output if the rate of rotation is decreased to half of the original value?


Show Answers Only

`D`

Show Worked Solution

Halving the rate of rotation of the bar magnet:

  • Doubles the period of the output graph (eliminate A and B).
  • Halves the rate of change of flux through the coil of the generator.
  • Halves of the maximum output voltage.

`=>D`


♦ Mean mark 52%.

Filed Under: Electromagnetic Induction Tagged With: Band 5, smc-3705-10-Generated emf

PHYSICS, M6 2015 HSC 9 MC

`P`, `Q` and `R` are straight, current-carrying conductors. They all carry currents of the same magnitude `(I)`. Conductors `P` and `Q` are fixed in place. The magnitude of the force between conductors `Q` and `R` is `F` newtons.
 

What is the net force on conductor `R` when it is in the position shown?

  1. `(F)/2` newtons to the left
  2. `(F)/2` newtons to the right
  3. `(3F)/2` newtons to the left
  4. `(3F)/2` newtons to the right
Show Answers Only

`B`

Show Worked Solution
  • As the currents in `Q` and `R` are in opposite directions, they repel. The force on `R` due to `Q` is to the right.
  • As the currents in `P` and `R` are in the same direction, they attract. The force on `R` due to `P` is to the left.
  •    `(F)/(l)=(mu_(0))/(2pi)(I_(1)I_(2))/(r)\ \ =>\ \  F prop (1)/(r)`
  • The force on `R` due to `P` is half the magnitude of the force on `R` due to `Q`.
  • The force on `R` due to `P` is `(F)/(2)` newtons to the left.
  • `R` experiences a force of `F` newtons to the right due to `Q` and a force of `(F)/(2)` newtons to the left due to `P`.
  • The net force on `R` is `(F)/(2)` newtons to the right.

`=>B`


Mean mark 54%.

Filed Under: The Motor Effect Tagged With: Band 5, smc-3694-30-Force Between Current-Carrying Conductors

PHYSICS, M6 2015 HSC 7 MC

A current-carrying wire is placed perpendicular to a magnetic field.

Which graph correctly shows the relationship between magnetic field strength `(B)` and current `(I)` if the force is to remain constant?


Show Answers Only

`C`

Show Worked Solution

`F=IlB sin theta \ \ =>\ \ I=(F)/(lB sin theta)`

  • If `F` is constant, `I prop (1)/(B)`
  • i.e. there is an inverse relationship between `I` and `B`.

`=>C`


♦ Mean mark 43%.

Filed Under: The Motor Effect Tagged With: Band 5, smc-3694-20-Force on Current-Carrying Conductor

PHYSICS, M7 2015 HSC 6 MC

Which of the following is a true statement about scientific theories, such as Einstein's theory of special relativity?

  1. They are valid but unreliable ideas.
  2. They are useful in making predictions.
  3. They are concepts that lack an experimental basis.
  4. They are ideas that can't be accepted until they have been tested.
Show Answers Only

`B`

Show Worked Solution

By Elimination:

  • Scientific theories are supported by experiments that when performed yield similar results (reliability). Examples include observations of muons and atomic clock experiments for Einstein’s theory of special relativity (eliminate A and C).
  • Scientific theories have large amounts of supporting evidence and are accepted (eliminate D).

`=>B`


♦♦ Mean mark 37%.

Filed Under: Light and Special Relativity Tagged With: Band 5, smc-3699-50-Scientific Theories

PHYSICS, M6 2016 HSC 30

The following makeshift device was made to provide lighting for a stranded astronaut on Mars.

The mass of Mars is `6.39 ×10^(23) \ text {kg}`.
 

The 2 kg mass falls, turning the DC generator, which supplies energy to the light bulb. The mass falls from a point that is 3 376 204 m from the centre of Mars.

  1. Calculate the maximum possible energy released by the light bulb as the mass falls through a distance of one metre.   (3 marks)

--- 8 WORK AREA LINES (style=lined) ---

  1. Explain the difference in the behaviour of the falling mass when the switch is open.   (3 marks)

--- 8 WORK AREA LINES (style=lined) ---

Show Answers Only

a.   7.48 J

b.   When switch is opened:

  • There is no induced current opposing the downwards motion of the mass (Lenz’s Law).
  • Hence, the mass will fall more quickly.
Show Worked Solution

a.   `DeltaE=U_(f)-U_(i)`

`=((-Gm_(1)m_(2))/(r_(f)))-((-Gm_(1)m_(2))/(r_(i)))`

`=(-6.67 xx10^(-11)xx6.39 xx10^(23)xx2)/(3\ 376\ 203)-((-6.67 xx10^(-11)xx6.39 xx10^(23)xx2))/(3\ 376\ 204)`

`=-7.48\ text{J}`
 

  • 7.48 J is lost by the falling mass.
  • The light bulb released 7.48 J of energy.

♦ Mean mark (a) 52%.

b.   When switch is opened:

  • There is no induced current opposing the downwards motion of the mass (Lenz’s Law).
  • Hence, the mass will fall more quickly.

♦♦♦ Mean mark (b) 27%.

Filed Under: Electromagnetic Induction, Motion in Gravitational Fields Tagged With: Band 5, Band 6, smc-3692-20-Energy Changes, smc-3705-40-Lenz and Faraday

PHYSICS, M5 2016 HSC 28

The following diagram shows the acceleration of a rocket during the first stage of its launch.
 

Explain the acceleration of the rocket with reference to the law of conservation of momentum.   (5 marks)

Show Answers Only
  • The combustion of fuel and expulsion of gases causes propulsion of the rocket. The rocket exerts a force on these gases in order to expel them backwards.
  • An equal and opposite force is exerted back on the rocket by the gases (Newton’s Third Law).
  • As the rocket and gases form a closed system, the law of conservation of momentum applies, meaning the momentum of the rocket is equal in magnitude and opposite in direction to the momentum of the fuel.
  • The momentum of the rocket is given by  `p=mv`. Since the force (and hence momentum) of the fuel is constant, the velocity of the rocket must increase as its mass decreases due to the expulsion of its fuel.
  • The rocket will accelerate. Also, using  `F=ma`, as the force acting on the rocket due to the gases is constant, the acceleration of the rocket must increase as its mass decreases.
Show Worked Solution
  • The combustion of fuel and expulsion of gases causes propulsion of the rocket. The rocket exerts a force on these gases in order to expel them backwards.
  • An equal and opposite force is exerted back on the rocket by the gases (Newton’s Third Law).
  • As the rocket and gases form a closed system, the law of conservation of momentum applies, meaning the momentum of the rocket is equal in magnitude and opposite in direction to the momentum of the fuel.
  • The momentum of the rocket is given by  `p=mv`. Since the force (and hence momentum) of the fuel is constant, the velocity of the rocket must increase as its mass decreases due to the expulsion of its fuel.
  • The rocket will accelerate. Also, using  `F=ma`, as the force acting on the rocket due to the gases is constant, the acceleration of the rocket must increase as its mass decreases.

♦ Mean mark 52%.

Filed Under: Momentum, Energy and Simple Systems, Projectile Motion Tagged With: Band 5, smc-3690-10-Projectile Motion Models, smc-4277-20-Momentum conservation

PHYSICS, M7 2016 HSC 19 MC

Muons are subatomic particles which at rest have a lifetime of 2.2 microseconds `(mus)`. When they are produced in Earth's upper atmosphere, they travel at 0.9999 `c`.

Using classical physics, the distance travelled by a muon in its lifetime can be calculated as follows:

`x=vt=660\ text{m}`

Which row of the table correctly summarises the behaviour of these muons?
 

Show Answers Only

`A`

Show Worked Solution
  • In the frame of reference of the muon, classical physics applies.
  • Hence, the muon will experience its proper, or actual lifespan and distance travelled.
  • In the frame of reference of an observer on earth, due to the muons relativistic speed relative to the observer, time dilation of the muons lifespan occurs.
  • The lifetime of a muon will be greater than 2.2 `mus` from Earth’s frame of reference.

`=>A`


♦ Mean mark 49%.

Filed Under: Light and Special Relativity Tagged With: Band 5, smc-3699-10-Time Dilation

PHYSICS, M5 2016 HSC 17 MC

A projectile was launched horizontally inside a lift in a building. The diagram shows the path of the projectile when the lift was stationary.
 

The projectile was launched again with the same velocity. At this time, the lift was slowing down as it approached the top floor of the building.

Which diagram correctly shows the new path of the projectile (dotted line) relative to the path created in the stationary lift (solid line)?


Show Answers Only

`C`

Show Worked Solution
  • Due to the motion of the elevator, the downwards acceleration of the ball is less than when the elevator is stationary.
  • The new path that the ball takes will appear wider relative to its path in the stationary elevator.

`=>C`


♦ Mean mark 46%.

Filed Under: Projectile Motion Tagged With: Band 5, smc-3690-10-Projectile Motion Models

PHYSICS, M5 2016 HSC 14 MC

A satellite orbits Earth with period `T`. An identical satellite orbits the planet Xerus which has a mass four times that of Earth. Both satellites have the same orbital radius `r`.
 

What is the period of the satellite orbiting Xerus?

  1. `(T)/4`
  2. `(T)/2`
  3. `2T`
  4. `4T`
Show Answers Only

`B`

Show Worked Solution

Applying Kepler’s Third Law:

`(r^(3))/(T^(2))` `=(GM)/(4pi^(2))`  
`r^3` `=(GMT^(2))/(4pi^(2))`  

 
Since satellites have the same orbital radius:

`(G(M_(E))(T_E)^(2))/(4pi^(2))` `=(G(M_(X))(T_(X))^(2))/(4pi^(2))`  
`(M_(E))(T_E)^(2)` `=(M_(X))(T_(X))^(2)`  
`((T_(X))^(2))/((T_E)^(2))` `=(M_(E))/(M_(X))`  
  `=1/4\ \ (M_X=4xxM_E\ text{(given)})`  
`(T_(X))/(T_E)` `=(1)/(2)`  
`T_X` `=(T_E)/2`  

 
`=>B`


♦ Mean mark 45%.

Filed Under: Motion in Gravitational Fields Tagged With: Band 5, smc-3692-30-Orbital Velocity/Period/Radius

PHYSICS, M6 2016 HSC 12 MC

Which diagram correctly shows the deflection of a cathode ray by a bar magnet?
 

Show Answers Only

`B`

Show Worked Solution
  • A cathode ray is a stream of electrons (negatively charged particles).
  • Test each scenario using the right hand palm rule.

`=>B`


♦ Mean mark 44%.

Filed Under: Charged Particles, Conductors and Electric/Magnetic Fields Tagged With: Band 5, smc-3693-15-Charged Particles in MF

PHYSICS, M6 2016 HSC 3 MC

A region of space contains a constant magnetic field and a constant electric field.

How will these fields affect an electron that is stationary in this region?

  1. Both fields will exert a force.
  2. Neither field will exert a force.
  3. Only the electric field will exert a force.
  4. Only the magnetic field will exert a force.
Show Answers Only

`C`

Show Worked Solution
  • Magnetic fields only exert a force on moving charged particles while electric fields exert a force on all charged particles moving or stationary.

`=>C`


♦♦ Mean mark 35%.

Filed Under: Charged Particles, Conductors and Electric/Magnetic Fields Tagged With: Band 5, smc-3693-18-Combination EF and MF

PHYSICS, M6 2017 HSC 30

In a thought experiment, a proton is travelling at a constant velocity in a vacuum with no field present. An electric field and a magnetic field are then turned on at the same time.

The fields are uniform in magnitude and direction and can be considered to extend infinitely. The velocity of the proton at the instant the fields were turned on is perpendicular to the fields.
 

Analyse the motion of the proton after the fields have been turned on.   (4 marks)

--- 8 WORK AREA LINES (style=lined) ---

Show Answers Only
  • Using the right hand palm rule, the magnetic field exerts a force out of the page, perpendicular to the velocity of the proton.
  • So, the magnetic field causes the proton to undergo circular motion, initially moving out of the page and continuing in an anti-clockwise direction as viewed from the right.
  • The electric field exerts a constant force to the left on the proton.
  • This causes the proton to accelerate towards the left. The resultant motion will be a helix (vector sum of motion) that extends to the left, with the distance between adjacent spirals increasing.
  • The helix will decrease in radius as the proton loses kinetic energy and hence speed as it radiates electromagnetic waves. This occurs because the proton is an accelerating charge.

Show Worked Solution
  • Using the right hand palm rule, the magnetic field exerts a force out of the page, perpendicular to the velocity of the proton.
  • So, the magnetic field causes the proton to undergo circular motion, initially moving out of the page and continuing in an anti-clockwise direction as viewed from the right.
  • The electric field exerts a constant force to the left on the proton.
  • This causes the proton to accelerate towards the left. The resultant motion will be a helix (vector sum of motion) that extends to the left, with the distance between adjacent spirals increasing.
  • The helix will decrease in radius as the proton loses kinetic energy and hence speed as it radiates electromagnetic waves. This occurs because the proton is an accelerating charge.

♦ Mean mark 51%.

Filed Under: Charged Particles, Conductors and Electric/Magnetic Fields Tagged With: Band 5, smc-3693-18-Combination EF and MF

PHYSICS, M6 2017 HSC 28

Contrast the design of transformers and magnetic braking systems in terms of the effects that eddy currents have in these devices.   (6 marks)

--- 15 WORK AREA LINES (style=lined) ---

Show Answers Only

Transformers:

  • A transformer involves primary and secondary coils wound around a laminated iron core.
  • When an AC current is applied to the primary coil, changes in magnetic flux induce a current in the secondary coil.
  • Eddy currents have undesirable effects in transformers as the iron core is a conductor.
  • So, there is induction of unwanted eddy currents which leads to energy losses in the form of heat.
  • Lamination of the iron core minimises these eddy currents and subsequent energy loss.

Magnetic Braking Systems:

  • In contrast, eddy currents are beneficial in magnetic braking systems.
  • Magnetic breaking involves using eddy currents to produce a force that stops a moving vehicle by converting kinetic energy into heat energy.
  • In order to maximise induced eddy currents, and thus the breaking effect, magnetic breaks are designed with large sheets or discs of conductive material such as copper.
Show Worked Solution

Transformers:

  • A transformer involves primary and secondary coils wound around a laminated iron core.
  • When an AC current is applied to the primary coil, changes in magnetic flux induce a current in the secondary coil.
  • Eddy currents have undesirable effects in transformers as the iron core is a conductor.
  • So, there is induction of unwanted eddy currents which leads to energy losses in the form of heat.
  • Lamination of the iron core minimises these eddy currents and subsequent energy loss.

Magnetic Braking Systems:

  • In contrast, eddy currents are beneficial in magnetic braking systems.
  • Magnetic breaking involves using eddy currents to produce a force that stops a moving vehicle by converting kinetic energy into heat energy.
  • In order to maximise induced eddy currents, and thus the breaking effect, magnetic breaks are designed with large sheets or discs of conductive material such as copper.

♦ Mean mark 49%.

Filed Under: Applications of the Motor Effect, Electromagnetic Induction Tagged With: Band 5, Band 6, smc-3695-70-Magnetic Breaking, smc-3705-70-Transformer Efficiency

PHYSICS, M6 2017 HSC 27

The diagram shows an electric circuit in a magnetic field directed into the page. The graph shows how the flux through the conductive loop changes over a period of 12 seconds.
 

  1. Calculate the maximum magnetic field strength within the stationary loop during the 12-second interval.   (2 marks)

--- 4 WORK AREA LINES (style=lined) ---

  1. Calculate the maximum voltage generated in the circuit by the changing flux. In your answer, indicate the polarity of the terminals `P` and `Q` when this occurs.   (3 marks)

--- 6 WORK AREA LINES (style=lined) ---

Show Answers Only

a.   `2.1\ text{T}`

b.   `0.3  text{V}`

  • Terminal `P` will be positive and terminal `Q` will be negative (Lenz’s Law).
Show Worked Solution
a.       `Phi` `=BA`
  `B` `=(Phi)/(A)=(Phi)/(pir^(2))`
  `B_max` `=(0.6)/(pi xx(0.3)^(2))=2.1\ text{T}`


♦♦ Mean mark (a) 38%.

b.   Voltage (emf) = time rate of flux

  • The induced emf is at a maximum when the rate of change of flux is a maximum.
  • From the graph, this occurs at  t = 10 – 12 s (steepest gradient).
  •   `epsilon=-(Delta Phi)/(Delta t)=-((-0.6)/(2))=0.3\ text{V}`
  • Terminal `P` will be positive and terminal `Q` will be negative (Lenz’s Law).

♦♦ Mean mark (b) 27%.

Filed Under: Electromagnetic Induction Tagged With: Band 5, Band 6, smc-3705-10-Generated emf, smc-3705-30-Magnetic Flux

PHYSICS, M5 2017 HSC 24

The escape velocity from a planet is given by  `v = sqrt((2GM)/(r))`.

  1. The radius of Mars is  `3.39 xx 10^(6) \ text{m}`  and its mass is  `6.39 xx 10^(23) \ text{kg}`.
  2. Calculate the escape velocity from the surface of Mars.   (2 marks)

--- 4 WORK AREA LINES (style=lined) ---

  1. Using the law of conservation of energy, show that the escape velocity of an object is independent of its mass.   (3 marks)

--- 6 WORK AREA LINES (style=lined) ---

Show Answers Only

a.   `v=5010  text{m s}^(-1)`

b.   Applying the law of conservation of energy:

  • The object’s initial mechanical energy must equal its final mechanical energy.
  •    `KE_(i)+U_(i)=KE_(f)+U_(f)`
  • The escape velocity is the minimum velocity required for an object to escape from a central mass and never return.
  • As an object reaches an infinite distance away, `U_(f)=0`
  • When an object has just enough speed to escape, its final speed is zero, hence, `KE_(f)=0`.
  • It follows:
`KE_(i)+U_(i)` `=0`  
`(1)/(2)mv^(2)-(GMm)/(r)` `=0`  
`mv^(2)` `=(2GMm)/(r)`  
`∴ v_(esc)` `=sqrt((2GM)/(r))`  


  • Which is independent of the object’s mass.
Show Worked Solution
a.    `v` `=sqrt((2xx6.67 xx10^(-11)xx6.39 xx10^(23))/(3.39 xx10^(6)))`
    `=5014.5  text{m s}^(-1)`
    `=5015  text{m s}^(-1)\ \ text{(to 0 d.p.)}`


b.   Applying the law of conservation of energy:

  • The object’s initial mechanical energy must equal its final mechanical energy.
  •    `KE_(i)+U_(i)=KE_(f)+U_(f)`
  • The escape velocity is the minimum velocity required for an object to escape from a central mass and never return.
  • As an object reaches an infinite distance away, `U_(f)=0`
  • When an object has just enough speed to escape, its final speed is zero, hence, `KE_(f)=0`.
  • It follows:
`KE_(i)+U_(i)` `=0`  
`(1)/(2)mv^(2)-(GMm)/(r)` `=0`  
`mv^(2)` `=(2GMm)/(r)`  
`∴ v_(esc)` `=sqrt((2GM)/(r))`  


  • Which is independent of the object’s mass.

Mean mark (b) 53%.

Filed Under: Motion in Gravitational Fields Tagged With: Band 3, Band 5, smc-3692-20-Energy Changes, smc-3692-70-Escape Velocity

PHYSICS, M7 2017 HSC 23

Using examples from special relativity, explain how theories in science are validated in different ways.   (5 marks)

--- 10 WORK AREA LINES (style=lined) ---

Show Answers Only
  • Theories in science must be consistent with observations and supported by independent, valid experiments in order to be validated.
  • Special relativity has been validated by a number of valid experiments:
  • The Hafele-Keating atomic clock experiment involved flying atomic clocks at high speeds on aircraft and comparing them with synchronised clocks on the surface of Earth. This experiment helped validate time dilation.
  • Observations of significantly more muons on Earths surface compared to classical predictions due to the time dilation of the muon’s lifespans further validated special relativity.
  • Observations of momentum dilation of particles travelling at high velocities in particle accelerators.
Show Worked Solution
  • Theories in science must be consistent with observations and supported by independent, valid experiments in order to be validated.
  • Special relativity has been validated by a number of valid experiments:
  • The Hafele-Keating atomic clock experiment involved flying atomic clocks at high speeds on aircraft and comparing them with synchronised clocks on the surface of Earth. This experiment helped validate time dilation.
  • Observations of significantly more muons on Earths surface compared to classical predictions due to the time dilation of the muon’s lifespans further validated special relativity.
  • Observations of the momentum dilation of particles travelling at high velocities in particle accelerators.

♦ Mean mark 54%.

Filed Under: Light and Special Relativity Tagged With: Band 5, smc-3699-10-Time Dilation, smc-3699-50-Scientific Theories

PHYSICS, M6 2017 HSC 18 MC

A particle of mass \(m\) and charge \(q\) travelling at velocity \(v\) enters a magnetic field of magnitude \(B\) and follows the path shown.
 

A second particle enters a magnetic field of magnitude \(2B\) with a velocity of  \(\dfrac{1}{2}v\)  and follows an identical path.

What is the mass and charge of the second particle?

\begin{align*}
\begin{array}{l}
\rule{0pt}{2.5ex} \ \rule[-1ex]{0pt}{0pt}& \\
\rule{0pt}{2.5ex}\textbf{A.}\rule[-1ex]{0pt}{0pt}\\
\rule{0pt}{2.5ex}\textbf{B.}\rule[-1ex]{0pt}{0pt}\\
\rule{0pt}{2.5ex}\textbf{C.}\rule[-1ex]{0pt}{0pt}\\
\rule{0pt}{2.5ex}\textbf{D.}\rule[-1ex]{0pt}{0pt}\\
\end{array}
\begin{array}{|c|c|}
\hline
\rule{0pt}{2.5ex}\quad \textit{Mass}\quad \rule[-1ex]{0pt}{0pt}& \quad \textit{Charge} \quad \\
\hline
\rule{0pt}{2.5ex}m\rule[-1ex]{0pt}{0pt}&q\\
\hline
\rule{0pt}{2.5ex}\frac{1}{2} m\rule[-1ex]{0pt}{0pt}& 2q\\
\hline
\rule{0pt}{2.5ex}4m\rule[-1ex]{0pt}{0pt}& q \\
\hline
\rule{0pt}{2.5ex}m\rule[-1ex]{0pt}{0pt}& \frac{1}{2}q \\
\hline
\end{array}
\end{align*}

Show Answers Only

\(C\)

Show Worked Solution
  • The centripetal force acting on the charge is given by the force it experiences due to the magnetic field:
\(F_c\) \(=F_b\)  
\(\dfrac{m v^2}{r}\) \(=q v B\)  
\(r\) \(=\dfrac{m v}{q B}\)  

 
\(\text{Given} \ B=2 B \ \text{and} \ v=\dfrac{1}{2} v:\)

  \(r=\dfrac{m \frac{1}{2} v}{q(2 B)}=\dfrac{m v}{4 q B}\)

  •  \(\text{In order for the radius to remain the same, \(\dfrac{m}{q}\) must be four}\)

\(\Rightarrow C\)


♦♦ Mean mark 35%.

Filed Under: Charged Particles, Conductors and Electric/Magnetic Fields Tagged With: Band 5, smc-3693-15-Charged Particles in MF, smc-3693-65-Uniform Circular Motion

PHYSICS, M6 2017 HSC 16 MC

An AC supply is connected to a light bulb by two long parallel conductors as shown.
 

Which graph shows the variation over time of the magnetic force between the two conductors?


Show Answers Only

`D`

Show Worked Solution
  • The currents are always in opposite directions, so the two conductors always repel.
  • The magnitude of current fluctuates between zero and a maximum leading to fluctuation in magnitude of force between the conductors between zero and a maximum.

`=>D`


♦♦ Mean mark 36%.

Filed Under: The Motor Effect Tagged With: Band 5, smc-3694-30-Force Between Current-Carrying Conductors

PHYSICS, M5 2017 HSC 15 MC

A car travelling at a constant speed follows the path shown.
 

An accelerometer that measures acceleration along the `X - X^’` direction is fixed in the car.

Which graph shows the measurements recorded by the accelerometer over the 20-second interval?


Show Answers Only

`B`

Show Worked Solution
  • The car makes a sharp turn left in a small radius when it enters and exits the roundabout and it turns right in a larger radius around the roundabout.
  • As  `a_(c)=(v^2)/(r)`, this means there will be an acceleration with a large magnitude at the start and end of the interval and an acceleration with lower magnitude and opposite sign during the middle of the journey.

`=>B`


♦ Mean mark 43%.

Filed Under: Circular Motion Tagged With: Band 5, smc-3691-10-Centripetal Forces

PHYSICS, M6 2018 HSC 30

The diagram shows a model of a system used to distribute energy from a power station through transmission lines and transformers to houses.
 

During the evening peak period there is an increase in the number of electrical appliances being turned on in houses.

Explain the effects of this increased demand on the components of the system, with reference to voltage, current and energy.   (6 marks)

--- 18 WORK AREA LINES (style=lined) ---

Show Answers Only

Current and voltage:

  • An increase in the number of electrical appliances causes an increase in energy demand, and a greater power requirement.
  • As `P=VI`, and `V` is constant at approximately 240`V` at the secondary coil of the step down transformer (T2), a greater current is drawn.
  • Similarly, this increases the current in the transmission lines as well as the power station.
  • As the voltage of T2 is approximately fixed at 240`V` and the ratio of coils in each transformer stays constant, the output voltage from the power station, the transmission line voltage and the supply voltage to houses will also remain approximately constant.

Energy losses:

  • As the current increases, the heat produced by resistance in the wires increases leading to losses in energy according to `P_(loss)=I^2R`.
  • Energy loss is also caused by the formation of eddy currents in the transformer cores, and this increases as current increases.
  • This power loss will cause slight voltage drops along the transmission lines leading to slight decreases in voltage inputs and outputs at each of the transformers.
Show Worked Solution

Current and voltage:

  • An increase in the number of electrical appliances causes an increase in energy demand, and a greater power requirement.
  • As `P=VI`, and `V` is constant at approximately 240`V` at the secondary coil of the step down transformer (T2), a greater current is drawn.
  • Similarly, this increases the current in the transmission lines as well as the power station.
  • As the voltage of T2 is approximately fixed at 240`V` and the ratio of coils in each transformer stays constant, the output voltage from the power station, the transmission line voltage and the supply voltage to houses will also remain approximately constant.

Energy losses:

  • As the current increases, the heat produced by resistance in the wires increases leading to losses in energy according to `P_(loss)=I^2R`.
  • Energy loss is also caused by the formation of eddy currents in the transformer cores, and this increases as current increases.
  • This power loss will cause slight voltage drops along the transmission lines leading to slight decreases in voltage inputs and outputs at each of the transformers.

♦♦ Mean mark 42%.

Filed Under: Electromagnetic Induction Tagged With: Band 5, Band 6, smc-3705-80-Energy Distribution

PHYSICS, M5 2018 HSC 28

The radius of the moon is 1740 km. The moon's mass is `7.35 × 10^(22)` kg. In this question, ignore the moon's rotational and orbital motion.

A 20 kg mass is launched vertically from the moon's surface at a velocity of `1200 \ text{m s}^(-1)`.

  1. Show that the change in potential energy of the mass in moving from the surface to an altitude of 500 km is `1.26 × 10^7 \ text{J}`.   (2 marks)

--- 5 WORK AREA LINES (style=lined) ---

  1. Calculate the velocity of the 20 kg mass at an altitude of 500 km.   (3 marks)

--- 10 WORK AREA LINES (style=lined) ---

Show Answers Only

a.   Proof (See Worked Solutions)

b.   `424  text{m s}^-1`

Show Worked Solution
a.       `U_(i)` `=-(GMm)/(r)`
    `=(-6.67 xx10^(-11)xx7.35 xx10^(22)xx20)/(1.74 xx10^(6))`
    `=-5.64 xx10^(7)\ text{J}`
  `U_(f)` `=(-6.67 xx10^(-11)xx7.35 xx10^(22)xx20)/(2.24 xx10^(6))`
    `=-4.38 xx10^(7)\ text{J}`

 
`:.Delta U=U_(f)-U_(i)=1.26 xx10^(7)\ text{J}`
 

b.  `KE_(i)=(1)/(2)m u^(2)=(1)/(2)xx20 xx1200^(2)=1.44 xx10^(7)  text{J}`

`KE_(f)=KE_(i)-DeltaE_(p)\ \ text{(by LCE)}=1.44 xx10^(7)-1.26 xx10^(7)=1.8 xx10^(6) text{J}`

`(1)/(2)mv^(2)` `=1.8 xx10^(6)`  
`v^2` `=(2xx1.8 xx10^(6))/(20)`  
`:.v` `=sqrt((2xx1.8 xx10^(6))/(20))= 424  text{m s}^-1`  

♦♦ Mean mark (b) 32%.

Filed Under: Motion in Gravitational Fields Tagged With: Band 3, Band 5, smc-3692-20-Energy Changes

PHYSICS, M5 2018 HSC 27

  1. The diagram shows a camera and a ruler set up to obtain data about a projectile's motion along the trajectory shown. The entire trajectory is visible through the camera.


    Identify ONE of the errors in this set-up and describe the effect of this error on the results.   (3 marks)

--- 6 WORK AREA LINES (style=lined) ---

  1. An experiment was set up based on the method described in part (a), but conducted so that the data obtained were valid.
     
    The image shows the trajectory of the ball.


    The graphs show data from this experiment.


    Using the graphs, describe the velocity and acceleration of the ball quantitatively and qualitatively.   (3 marks)

--- 6 WORK AREA LINES (style=lined) ---

Show Answers Only

a.   Experimental error:

  • The distance between the ruler and the camera is less than the distance between the trajectory and the camera.
  • The effect of this is that the distance measured on the ruler will be greater than the true distance the projectile travels. So, the calculated velocity will be inaccurate as it will be greater than the true velocity.

Other errors include:

  • The camera and the ruler are off centre.
  • The effect of this is also that the distance measured on the ruler will be inaccurate.

b.   Velocity and acceleration of ball:

  • Ball is moving horizontally at a constant velocity (1st graph).
  • Quantitatively: `v=(-1.1-(-0.3))/(1-0.5)=-1.6\ text{m s}^(-1).` So, the ball’s speed is `1.6\ text{m s}^(-1)`
  • The second graph shows that the ball is accelerating at a constant rate vertically downwards.
  • Quantitatively: `a=(-2.4-2.4)/(0.5)=-9.6\ text{m s}^(-2)`
Show Worked Solution

a.   Experimental error:

  • The distance between the ruler and the camera is less than the distance between the trajectory and the camera.
  • The effect of this is that the distance measured on the ruler will be greater than the true distance the projectile travels. So, the calculated velocity will be inaccurate as it will be greater than the true velocity.

Other errors include:

  • The camera and the ruler are off centre.
  • The effect of this is also that the distance measured on the ruler will be inaccurate.

♦ Mean mark (a) 45%.

b.   Velocity and acceleration of ball:

  • Ball is moving horizontally at a constant velocity (1st graph).
  • Quantitatively: `v=(-1.1-(-0.3))/(1-0.5)=-1.6\ text{m s}^(-1).` So, the ball’s speed is `1.6\ text{m s}^(-1)`
  • The second graph shows that the ball is accelerating at a constant rate vertically downwards.
  • Quantitatively: `a=(-2.4-2.4)/(0.5)=-9.6\ text{m s}^(-2)`

♦ Mean mark (b) 42%.

Filed Under: Projectile Motion Tagged With: Band 5, smc-3690-10-Projectile Motion Models, smc-3690-60-Graphs

ENGINEERING, TE 2022 HSC 3 MC

Which of the following is the AS 1100 standard for drawing a break line?
 

Show Answers Only

`C`

Show Worked Solution
  • One representation of a break line complying with AS 1100 standards is a long thin ruled line with zigzags.\

`=>C`


♦ Mean mark 46%.

Filed Under: Communication Tagged With: Band 5, smc-3731-30-AS 1100

Financial Maths, STD1 F2 2022 HSC 31

A watch is currently worth $6100. It has appreciated by 5.8% per annum since purchase.

What was its value 10 years ago?  (2 marks)

--- 4 WORK AREA LINES (style=lined) ---

Show Answers Only

`$3471.15`

Show Worked Solution

`FV=$6100`

`text{Find}\ PV\ text{given}\ n=10, \ r=5.8text{%}=0.058:`
  

`FV` `=PV(1+r)^n`  
`6100` `=(PV)(1+0.058)^10`  
`PV` `=6100/(1.058)^10`  
  `=$3471.148…`  
  `=$3471.15\ \ text{(nearest cent)}`  

♦♦ Mean mark 37%.

Filed Under: F2 Investment (Y12) Tagged With: Band 5, smc-1108-20-FV Formula

Financial Maths, STD1 F3 2022 HSC 30

A car is purchased for $15 000. The graph shows the value of the car, `$V`, at time `t` years since it was purchased, using the declining-balance method of depreciation.


  1. When using the straight-line method of depreciation, the value of the car depreciates at a rate of $2500 per year.

  2. By first completing the table, plot on the grid above the value of the car for the first three years based on the straight-line method of depreciation.  (2 marks)

  3.      
  4. After how many years will the value of the car using the straight-line method of depreciation be equal to its value using the declining-balance method?  (2 marks)

    --- 1 WORK AREA LINES (style=lined) ---

Show Answers Only

a.  
     

b.   
     

Values are equal when graphs intersect

→ after 4 years

Show Worked Solution

a.  
     

b.   
     

Values are equal when graphs intersect

→ after 4 years


♦♦ Mean mark part (a) 37%.
♦♦ Mean mark part (b) 31%.

Filed Under: Depreciation - Declining Balance (Std 1) Tagged With: Band 5, smc-1139-50-Declining Balance vs Straight Line, smc-1139-60-Depreciation Graphs

Financial Maths, STD1 F1 2022 HSC 28

Julie has a gross annual salary of $67 000. During the year she also received an income of $780 from investments and had tax deductions totalling $1000.

The table below shows the income tax rates for the 2021–2022 financial year.


Calculate the tax payable on Julie's taxable income, ignoring the Medicare levy.  (3 marks)

Show Answers Only

`$12 170.50`

Show Worked Solution
`text{Taxable Income}`  `=\ text{Total Income – Deductions}`  
  `=67\ 000 + 780-1000`  
  `=$66\ 780`  


`:.\ text{Tax Payable}` `=5092+0.325(66\ 780-45\ 000)`  
  `=5092+7078.50`  
  `=$12\ 170.50`  

♦ Mean mark 49%.

Filed Under: Tax and Percentage Increase/Decrease (Std 1) Tagged With: Band 5, smc-1125-10-Tax Tables, std2-std1-common

Measurement, STD1 M3 2022 HSC 27

Shan is interested in buying a block of bushland. The price per hectare is $500. The land he wishes to purchase is in the shape of a right-angled triangle as shown.

The length of side `A B` is 7800 metres and the length of side `B C` is 3000 metres. The right angle of the triangle is angle `A C B`.


Note: 1 hectare =10 000 m2

What is the cost of the block of bushland?  (4 marks)

--- 8 WORK AREA LINES (style=lined) ---

Show Answers Only

$540 000

Show Worked Solution

`text{Using Pythagoras:}`

`AC^2` `=7800^2-3000^2`  
  `=51\ 840\ 000`  
`:.AC` `=7200`  


`text{Area}\ DeltaABC` `=(BC xx AC)/2`  
  `=3000 xx 7200`  
  `=108\ 000\ 000\ text{m}^2`   
  `=1080\ text{hectares (1 hectare = 10 000 m}^(2))`  


`:.\ text{Cost}` `=$500 xx 1080`  
  `=$540\ 000`  

♦♦ Mean mark 28%.

Filed Under: M3 Right-Angled Triangles (Y12) Tagged With: Band 5, smc-1103-10-Pythagoras

Financial Maths, STD1 F3 2022 HSC 26

A family uses a credit card to purchase a lounge during the month of November.

The credit card has no interest-free period. Interest is charged at a rate of 21% per annum, compounded daily, from and including the date of purchase to the last day of the month.

The table shows the only purchases and payments on the credit card during the month of November.
 

What is the closing balance owing on the credit card on 30 November?  (3 marks)

Show Answers Only

`$5569.34`

Show Worked Solution

`text{Interest calculation:}`

`text{Days = 16 (15th November – 30th November)}`

`text{Daily interest rate} = 21/365 %`

`text{Card Balance (30 Nov)}` `=7500(1+21/(365 xx100))^16-2000`  
  `=7569.339…- 2000`  
  `=$5569.34`  

♦♦ Mean mark 23%.

Filed Under: Credit Cards (Std 1) Tagged With: Band 5

Financial Maths, STD1 F2 2022 HSC 24

Peta has the choice of investing $7000 in two different investment funds.

Fund A:  5.2% per annum simple interest

Fund B: 5% per annum interest, compounded annually

What is the difference between the amounts of interest earned in the two investment funds over 3 years?  (4 marks)

--- 8 WORK AREA LINES (style=lined) ---

Show Answers Only

`$11.38`

Show Worked Solution

`text{Fund A}`:

`text{Simple Interest}`  `= 7000xx 5.2text{%}xx 3`  
  `= 7000xx 0.052xx 3`  
  `= $1092`  

   
`text{Fund B}`:

`FV` `=PV (1+r)^n`  
  `= 7000 (1+0.05)^3`  
  `=$8103.38\ \ text{(nearest cent)}`  


`text{Interest}` `= FV-PV`  
  `=8103.38-7000`  
  ` = $1103.38`  


`:.\ text{Difference}` `= 1103.38-1092`  
  `=$11.38`  

♦ Mean mark 44%.


Filed Under: F2 Investment (Y12) Tagged With: Band 5, smc-1108-30-i/r comparisons (incl. graphs)

Measurement, STD1 M4 2022 HSC 22

A 2500-watt air-conditioning system is turned on for 3 hours each day. Electricity is charged at 27 cents per kWh.

What is the cost of electricity for using the air-conditioning system over a seven-day period?  (2 marks)

--- 4 WORK AREA LINES (style=lined) ---

Show Answers Only

`$14.18`

Show Worked Solution
`text{Daily usage}`  `=2500 xx 3`
  `= 7500\ text{W}`
  `=7.5\ text{kW  (1000 W = 1 kW)}`


`text{Cost}`  `= 2.5 xx 7.5 xx 0.27`   
  `= 14.175`  
  `=$14.18\ \ text{(nearest cent)}`  

♦♦ Mean mark 39%.

Filed Under: M4 Rates (Y12) Tagged With: Band 5, smc-1104-25-Energy

Algebra, STD1 A1 2022 HSC 19

Fried's formula is used to calculate the dosage of medication for children aged 1-2 years based on the adult dosage. The formula is

`text{Dosage}=(text{age (in months)} xx\ text{adult dosage})/(150)`.

The adult dosage of a particular medication is 200 mg.

Betty's dosage is calculated to be 24 mg.

How old is Betty in months?  (2 marks)

Show Answers Only

18 months

Show Worked Solution

`text{Substituting into the formula:}`

`24` `=( \ text{age} xx 200)/150`  
`text{age}` `=(24 xx 150)/200`   
  `=360/20`  
  `= 18\ text(months)`  

♦ Mean mark 52%.

Filed Under: Applications: BAC, Medicine and D=SxT (Std1-2027), Applications: BAC, Medicine and D=SxT (Std2-2027), Applications: D=SxT and Other (Std 1) Tagged With: Band 5, smc-1117-30-Medication Formulae, smc-6235-30-Medication Formulas, smc-6509-30-Medication Formulas

Measurement, STD1 M2 2022 HSC 18

Singapore is 8 hours ahead of Coordinated Universal Time (UTC +8) and New York is 5 hours behind Coordinated Universal Time (UTC –5).

What is the time and day in Singapore when it is 9 pm Monday in New York?  (2 marks)

--- 5 WORK AREA LINES (style=lined) ---

Show Answers Only

10 am Tuesday

Show Worked Solution

New York → UTC – 5 hours

Singapore → UTC + 8 hours  

Singapore is 5 + 8 = 13 hours ahead of New York

`∴` Time and day in Singapore  = Monday 9 pm + 13 hours  
  = Tuesday 9 am + 1 hour  
  = Tuesday 10 am  

♦ Mean mark 52%.

Filed Under: M2 Working with Time (Y11), Time and Time Difference (Std1-2027), Time and Time Difference (Std2-2027) Tagged With: Band 5, smc-1102-10-Time Differences, smc-6306-10-Time Differences, smc-6525-10-Time Differences

Probability, STD1 S2 2022 HSC 17

Each number from 1 to 30 is written on a separate card. The 30 cards are shuffled. A game is played where one of these cards is selected at random. Each card is equally likely to be selected.

Ezra is playing the game, and wins if the card selected shows an odd number between 20 and 30.

  1. List the numbers which would result in Ezra winning the game.  (1 mark)

    --- 1 WORK AREA LINES (style=lined) ---

  2. What is the probability that Ezra does NOT win the game?  (2 marks)

    --- 4 WORK AREA LINES (style=lined) ---

Show Answers Only
  1. `21, 23, 25, 27, 29`
  2. `Ptext{(not win)} = 5/6`
Show Worked Solution

a.   `21, 23, 25, 27, 29`
 

b.    `Ptext{(not win)}` `=1-Ptext{(win)}`
    `=1-5/30`
    `=25/30`
    `=5/6`


♦ Mean mark 51%.

Filed Under: Probability, Single and Multi-Stage Events (Std 1) Tagged With: Band 3, Band 5, num-title-ct-core, num-title-qs-hsc, smc-1135-05-Simple Probability, smc-1135-30-P(E) = 1 - P(not E), smc-4225-15-Single-stage events, smc-4225-20-Complementary events

Statistics, STD1 S3 2022 HSC 16

A concert organiser is interested in the relationship between the distance from the stage, in metres, and the loudness of the sound measured in decibels.

The data the concert organiser collected is shown on the graph.
 

  1. Is the relationship between distance and loudness linear or non-linear?  (1 mark)

    --- 1 WORK AREA LINES (style=lined) ---

  2. Based on this dataset, at approximately what distance from the stage would the sound be at 90 decibels?  (1 mark)

    --- 1 WORK AREA LINES (style=lined) ---

Show Answers Only
  1. `text{Non-linear}`
  2. `text{6 metres}`
Show Worked Solution

a.   The graph is not a straight line, therefore, non-linear.

b.   Distance =  6 metres.

→ Intersection of line of best fit and horizontal line at decibels (y-axis) = 90


♦ Mean mark part (b) 46%.

Filed Under: S3 Further Statistical Analysis (Y12) Tagged With: Band 4, Band 5, smc-1113-10-Line of Best Fit

ENGINEERING, TE 2020 HSC 26c

Discuss methods for increasing the signal strength of a receiving antenna.   (3 marks)

--- 9 WORK AREA LINES (style=lined) ---

Show Answers Only
  • Amplification: Amplifies the sound, however this could include unwanted background noise.
  • Antenna tuning: The antenna can be tuned to the frequency of interest. This can be done by adjusting the length of the antenna, however this may not be practical in some scenarios.
  • Directional antenna can focus the signal to increase strength however misalignment could result in losing the signal entirely.
Show Worked Solution
  • Amplification: Amplifies the sound, however this could include unwanted background noise.
  • Antenna tuning: The antenna can be tuned to the frequency of interest. This can be done by adjusting the length of the antenna, however this may not be practical in some scenarios.
  • Directional antenna can focus the signal to increase strength however misalignment could result in losing the signal entirely.

Mean mark (c) 52%.

Filed Under: Electricity/Electronics Tagged With: Band 5, smc-3730-10-Radio, smc-3730-15-Television, smc-3730-20-Telephony

PHYSICS, M8 2018 HSC 33c

A H–R diagram is shown. Star `X` is a main sequence star of 12 solar masses.
 

Describe how star `X` will change physically and chemically as it continues to evolve.   (4 marks)

--- 8 WORK AREA LINES (style=lined) ---

Show Answers Only
  • Star `X` is a hot, blue-white B-class giant that is fusing Hydrogen to Helium in its core. It will have a relatively short life span in its current state.
  • Its next evolutionary stage will be a red supergiant where its size will increase dramatically although its luminosity would stay the same.
  • At this next stage, Helium burning starts in the core and changes to fusion between helium and carbon to form oxygen.
  • As the temperature rises carbon fuses to form heavier elements such as iron. This eventually causes the core to collapse forming a supernova explosion.
  • The explosion results in an increase in its luminosity and eventually to a gravitational collapse into a black hole.
Show Worked Solution
  • Star `X` is a hot, blue-white B-class giant that is fusing Hydrogen to Helium in its core. It will have a relatively short life span in its current state.
  • Its next evolutionary stage will be a red supergiant where its size will increase dramatically although its luminosity would stay the same.
  • At this next stage, Helium burning starts in the core and changes to fusion between helium and carbon to form oxygen.
  • As the temperature rises carbon fuses to form heavier elements such as iron. This eventually causes the core to collapse forming a supernova explosion.
  • The explosion results in an increase in its luminosity and eventually to a gravitational collapse into a black hole.

♦ Mean mark 42%.

Filed Under: Origins of Elements Tagged With: Band 5, smc-3700-10-H-R Diagrams

BIOLOGY, M7 2019 HSC 32

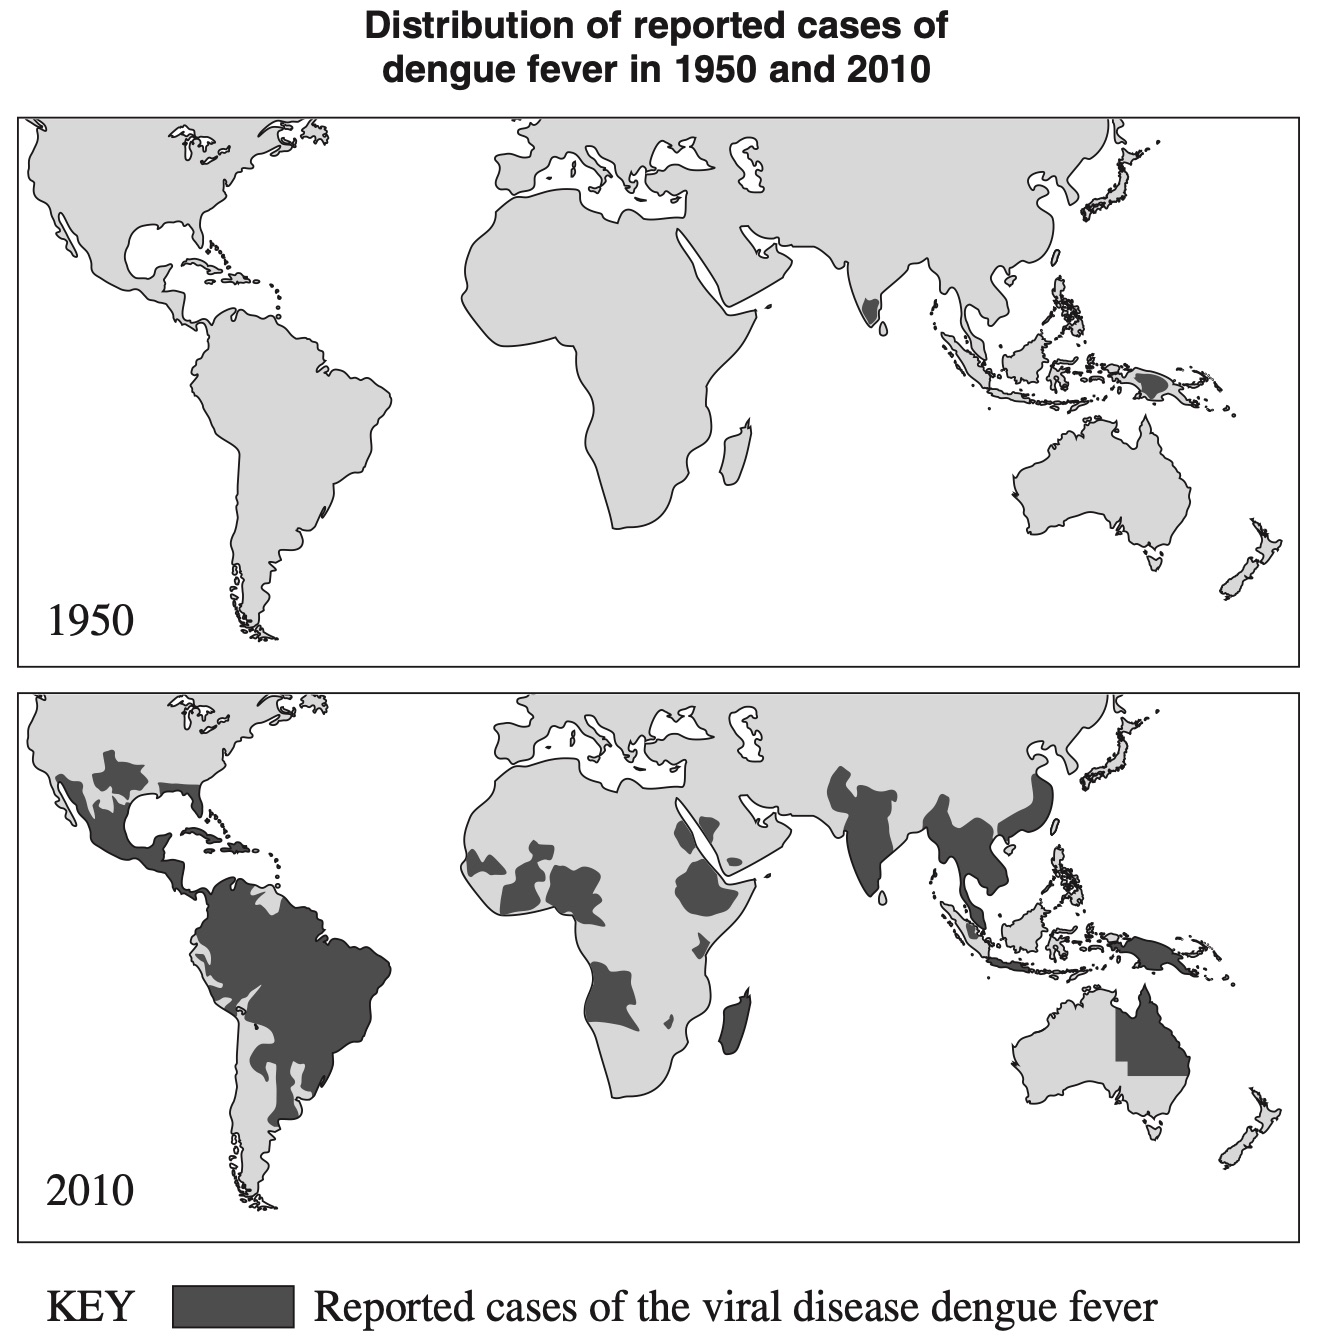
Use the following data to answer parts (a) and (b).

Dengue fever and malaria are examples of infectious diseases transmitted between humans by mosquitoes. Dengue fever is caused by a virus transmitted by mosquitoes of the genus Aedes. Malaria is caused by a single-celled organism transmitted by mosquitoes of the genus Anopheles.

The following data provide information about the global incidence of these two diseases over time.


  1. Based on the data provided, identify trends in the global disease burden for both malaria and dengue fever.   (3 marks)

    --- 8 WORK AREA LINES (style=lined) ---

  2. Analyse factors that could have contributed to the change in global distribution of both dengue fever and malaria over the last 100 years. Support your answer with reference to the data provided.   (7 marks)

    --- 16 WORK AREA LINES (style=lined) ---

Show Answers Only

a.   Trends in global disease burden:

  • The distribution on Dengue Fever has significantly increased since 1950, with continents such as Australia, Europe, South America and Africa now having a significant number of reported cases.
  • This spread is seen both north and south of the equator.
  • Malaria has a declining number of countries with reported cases of the disease.
  • However, population growth means the number of individuals at risk is increasing, having almost doubled between 1965 and 2010.
  • We can conclude however, that there is an increasing number of people at risk of malaria, but representing a smaller portion of the global population. 

b.  Analysis of factors that could have contributed to the change in global distribution of both dengue fever and malaria

Both diseases are transmitted by a mosquito vector. The prevalence of mosquitoes in each area would therefore have a large influence on the number of infected individuals.

  • The increase in international travel allows mosquitoes to spread across the world.
  • The increasing population of the world along with rapid urbanisation gives rise to more urban mosquito habitats.

These factors can be associated with the distribution seen on the Dengue Fever map, however the countries with reported cases of Malaria has shrunk.

  • The mosquitoes responsible for Dengue Fever and Malaria respectively, are from a different genus of mosquito. It is likely that more is known about Anopheles than Aedes.
  • The use of quarantine and pesticides on the Anopheles is most likely being used to contain the spread of malaria.

Medical advances such as vaccines also have the potential to be an effective measure of containing diseases.

  • From both data sets, it would be accurate to conclude, however, that medicinal products had better results when maintaining malaria compared to dengue fever.
  • Antimalarial tablets or a malaria vaccine may be types of malaria medicinal products that may be used to maintain the disease.
  • The rapid evolution of the dengue virus, ineffective antivirals or potentially that there is no known vaccine may be some of the reasons why medicinals may not be effective for dengue fever.
Show Worked Solution

a.   Trends in global disease burden:

  • The distribution on Dengue Fever has significantly increased since 1950, with continents such as Australia, Europe, South America and Africa now having a significant number of reported cases.
  • This spread is seen both north and south of the equator.
  • Malaria has a declining number of countries with reported cases of the disease.
  • However, population growth means the number of individuals at risk is increasing, having almost doubled between 1965 and 2010.
  • We can conclude however, that there is an increasing number of people at risk of malaria, but representing a smaller portion of the global population. 

b.  Analysis of factors that could have contributed to the change in global distribution of both dengue fever and malaria

Both diseases are transmitted by a mosquito vector. The prevalence of mosquitoes in each area would therefore have a large influence on the number of infected individuals.

  • The increase in international travel allows mosquitoes to spread across the world.
  • The increasing population of the world along with rapid urbanisation gives rise to more urban mosquito habitats.

These factors can be associated with the distribution seen on the Dengue Fever map, however the countries with reported cases of Malaria has shrunk.

  • The mosquitoes responsible for Dengue Fever and Malaria respectively, are from a different genus of mosquito. It is likely that more is known about Anopheles than Aedes.
  • The use of quarantine and pesticides on the Anopheles is most likely being used to contain the spread of malaria.

Medical advances such as vaccines also have the potential to be an effective measure of containing diseases.

  • From both data sets, it would be accurate to conclude, however, that medicinal products had better results when maintaining malaria compared to dengue fever.
  • Antimalarial tablets or a malaria vaccine may be types of malaria medicinal products that may be used to maintain the disease.
  • The rapid evolution of the dengue virus, ineffective antivirals or potentially that there is no known vaccine may be some of the reasons why medicinals may not be effective for dengue fever.

♦ Mean mark (b) 52%.

Filed Under: Prevention, Treatment and Control Tagged With: Band 4, Band 5, smc-3658-40-Interpreting Data, smc-3658-50-Malaria

BIOLOGY, M7 2019 HSC 31

  1. Outline ONE adaptation of a specific pathogen that facilitates its entry into a host.   (2 marks)

    --- 4 WORK AREA LINES (style=lined) ---

  2. Explain how the mode of transmission of pathogens influences the spread of diseases.   (3 marks)

    --- 6 WORK AREA LINES (style=lined) ---

Show Answers Only

a.    Helicobacter pylori is a bacteria that causes stomach ulcers.

  • It has flagellum which allows it to move in the stomach and penetrate the stomach wall. 

Other answers could include:

  • Salmonella and its ability to adapt to host blood temperature. 

b.    Diseases will be able to spread faster and easier with certain modes of transmission.

  • Airborne disease such as influenza are able to spread faster as the virus can be passed through droplets of air by infected individuals sneezing/coughing.
  • Diseases that can only spread via direct contact will have lower infection rates as there is a less effective mode of transmission. 

Other answers could include the effectiveness of modes such as 

  • Vectors and their presence in an area influencing infection rate.
  • Foodborne/waterborne diseases.
  • Zoonotic diseases.
Show Worked Solution

a.    Helicobacter pylori is a bacteria that causes stomach ulcers.

  • It has flagellum which allows it to move in the stomach and penetrate the stomach wall. 

Other answers could include:

  • Salmonella and its ability to adapt to host blood temperature. 

♦♦ Mean mark (a) 36%.

b.    Diseases will be able to spread faster and easier with certain modes of transmission.

  • Airborne disease such as influenza are able to spread faster as the virus can be passed through droplets of air by infected individuals sneezing/coughing.
  • Diseases that can only spread via direct contact will have lower infection rates as there is a less effective mode of transmission. 

Other answers could include the effectiveness of modes such as 

  • Vectors and their presence in an area influencing infection rate.
  • Foodborne/waterborne diseases.
  • Zoonotic diseases.

Filed Under: Causes of Infectious Disease Tagged With: Band 4, Band 5, smc-3655-20-Transmission, smc-3655-30-Vectors, smc-3655-40-Pathogen Adaptations

BIOLOGY, M5 2019 HSC 30

Experiments were conducted to obtain data on the traits 'seed shape' in plants and 'feather colour' in chickens. In each case, the original parents were pure breeding and produced the first generation (F1). The frequency data diagrams below relate to the second generation offspring (F2), produced when the F1 generations were bred together.
 

Explain the phenotypic ratios of the F2 generation in both the plant and chicken breeding experiments. Include Punnett squares and a key to support your answer.   (5 marks)

--- 12 WORK AREA LINES (style=lined) ---

Show Answers Only
  • Graph A shows a 3:1 phenotypic ratio. This is typical of a dominant/recessive allele phenotypic ratio of two heterozygous parents.
  • The Punnet square below supports this argument, where R refers to the dominant seed shape (e.g. round) and r is the recessive allele, producing another seed shape (e.g. wrinkled). The offspring have a 3:1 ratio of dominant : recessive seed shape.

\begin{array} {|c|c|c|}\hline  & \text{R} & \text{r} \\ \hline \text{R} & \text{RR} & \text{Rr} \\ \hline \text{r} & \text{Rr} & \text{rr} \\ \hline \end{array}

Key: R = Round     r = wrinkled

  • Graph B shows a 1:2:1 phenotypic ratio. Because both parents are heterozygous, this ratio is typical of a co-dominant or incomplete dominant trait.
  • If B is an allele referring to black colour feathers and W is the allele for white colour feathers then both parents will be BW, which is either grey colour feathers (co-dominance) or both black and white feathers (incomplete dominance). A cross between these genotypes will produce a phenotypic ratio of the same seen in the graph.

\begin{array} {|c|c|c|}\hline  & \text{B} & \text{W} \\ \hline \text{B} & \text{BB} & \text{BW} \\ \hline \text{W} & \text{BW} & \text{WW} \\ \hline \end{array}

Key: B = Black Feathers     W= White Feathers

Show Worked Solution
  • Graph A shows a 3:1 phenotypic ratio. This is typical of a dominant/recessive allele phenotypic ratio of two heterozygous parents.
  • The Punnet square below supports this argument, where R refers to the dominant seed shape (e.g. round) and r is the recessive allele, producing another seed shape (e.g. wrinkled). The offspring have a 3:1 ratio of dominant : recessive seed shape.

\begin{array} {|c|c|c|}\hline  & \text{R} & \text{r} \\ \hline \text{R} & \text{RR} & \text{Rr} \\ \hline \text{r} & \text{Rr} & \text{rr} \\ \hline \end{array}

Key: R = Round     r = wrinkled

  • Graph B shows a 1:2:1 phenotypic ratio. Because both parents are heterozygous, this ratio is typical of a co-dominant or incomplete dominant trait.
  • f B is an allele referring to black colour feathers and W is the allele for white colour feathers then both parents will be BW, which is either grey colour feathers (co-dominance) or both black and white feathers (incomplete dominance). A cross between these genotypes will produce a phenotypic ratio of the same seen in the graph.

\begin{array} {|c|c|c|}\hline  & \text{B} & \text{W} \\ \hline \text{B} & \text{BB} & \text{BW} \\ \hline \text{W} & \text{BW} & \text{WW} \\ \hline \end{array}

Key: B = Black Feathers     W= White Feathers


♦♦ Mean mark 44%.

Filed Under: Genetic Variation / Inheritance Tagged With: Band 5, Band 6, smc-3648-20-Punnet Squares, smc-3648-35-Autosomal, smc-3648-40-Co-Dominance, smc-3648-45-Incomplete Dominance

BIOLOGY, M5 2019 HSC 28

Huntington's disease is an autosomal dominant condition caused by a mutation of a gene on chromosome 4. It causes nerve cells to break down.

Stargardt disease is an autosomal recessive condition caused by a mutation of a different gene on chromosome 4 . It causes damage to the retina.

A patient is heterozygous for both Huntington's (Hh) and Stargardt disease (Rr). His father's extended family has numerous cases of both of these diseases. His mother does not have either disease and is homozygous for both genes.

  1. Complete the tables, showing the TWO alleles the patient inherited from each parent.   (2 marks)
     
    \begin{aligned}
    &\begin{array}{|l|}
    \hline \rule{0pt}{2.5ex}\quad \quad \textit{ Alleles from father }\quad \quad \rule[-1ex]{0pt}{0pt} \\
    \hline \rule{0pt}{2.5ex}\text{} \rule[-1ex]{0pt}{0pt}\\
    \hline
    \end{array}
    &\begin{array}{|c|}
    \hline \rule{0pt}{2.5ex}\quad \quad \textit{Alleles from mother } \quad \quad \rule[-1ex]{0pt}{0pt}\\
    \hline \rule{0pt}{2.5ex}\text{}\rule[-1ex]{0pt}{0pt}\\
    \hline
    \end{array}
    \end{aligned}
     
  2. The diagram shows the patient's homologous pair of chromosome 4 at various stages of meiosis.
  3. Add the relevant alleles to the diagram to model the production of possible gamete combinations. Include a key and an example of crossing over.   (4 marks)
     

--- 0 WORK AREA LINES (style=lined) ---

Show Answers Only

a.     

\begin{array} {|c|c|}\hline \text{Alleles from father} & \text{Alleles from mother} \\
\hline \text{H, r} & \text{h, R} \\ \hline \end{array}

b.

Show Worked Solution

a.     

\begin{array} {|c|c|}\hline \text{Alleles from father} & \text{Alleles from mother} \\
\hline \text{H, r} & \text{h, R} \\ \hline \end{array}


♦ Mean mark (a) 47%.

b.


♦♦♦ Mean mark (b) 25%.

Filed Under: Genetic Variation / Inheritance Tagged With: Band 5, Band 6, smc-3648-35-Autosomal, smc-3648-50-Meiosis

Measurement, STD1 M4 2022 HSC 14

The travel graph displays Jamie's trip which began at town `M` at 8 am and finished at town `N`.


  1. How far apart are the two towns?  (1 mark)

    --- 2 WORK AREA LINES (style=lined) ---

  2. At what time during the day did Jamie arrive back at town `M` ?  (1 mark)

    --- 2 WORK AREA LINES (style=lined) ---

  3. What was the total distance that Jamie travelled?  (1 mark)

    --- 2 WORK AREA LINES (style=lined) ---

  4. Between which times in the day was Jamie travelling at the fastest speed? Justify your answer, without calculations.  (2 marks)

    --- 4 WORK AREA LINES (style=lined) ---

Show Answers Only

a.   `140\ text{km}`
 

b.   `text{James arrives back at town when he is 140 km away (2nd time)}`

`:. 10\ text{am}`
 

c.    `text{Total distance}` `=40 + 40 + 60+ 80`
    `=220\ text{km}`


d.   `text{Fastest speed → graph is the steepest}`

`:.\ text{Fastest speed between 11 – 11:30 am}`

Show Worked Solution

a.   `140\ text{km}`
 

b.   `text{James arrives back at town when he is 140 km away (2nd time)}`

`:. 10\ text{am}`
 

c.    `text{Total distance}` `=40 + 40 + 60+ 80`
    `=220\ text{km}`


d.   `text{Fastest speed → graph is the steepest}`

`:.\ text{Fastest speed between 11 – 11:30 am}`


♦♦ Mean mark part (b) 31%.
♦♦ Mean mark part (c) 35%.
♦♦ Mean mark part (d) 32%.

Filed Under: M4 Rates (Y12) Tagged With: Band 4, Band 5, smc-1104-10-Travel Graphs

BIOLOGY, M5 2019 HSC 27

Yeast is a single-celled fungus that can reproduce by budding.

  1. What type of reproduction is budding?   (1 mark)

    --- 2 WORK AREA LINES (style=lined) ---

  2. Outline a procedure that could be used to test the effect of temperature on reproduction in yeast.   (4 marks)

    --- 8 WORK AREA LINES (style=lined) ---

Show Answers Only

a.   Asexual.

b.   Steps of procedure:

  1. Prepare 4 water baths of 20, 30, 40 and 50 degrees Celsius.
  2. Add 10mL of yeast suspension in 12 different test tubes.
  3. Place 3 test tubes into each of the 4 water baths.
  4. Incubate for 3 hours.
  5. Take a drop from each test tube and inspect under a microscope using a mm grid and recording yeast counts for each.
  6. Compare the number of cells present at each temperature to see which temperature is most optimal for yeast reproduction.
Show Worked Solution

a.   Asexual.

b.   Steps of procedure:

  1. Prepare 4 water baths of 20, 30, 40 and 50 degrees Celsius.
  2. Add 10mL of yeast suspension in 12 different test tubes.
  3. Place 3 test tubes into each of the 4 water baths.
  4. Incubate for 3 hours.
  5. Take a drop from each test tube and inspect under a microscope using a mm grid and recording yeast counts for each.
  6. Compare the number of cells present at each temperature to see which temperature is most optimal for yeast reproduction.

♦♦ Mean mark (b) 45%.

Filed Under: Reproduction Tagged With: Band 3, Band 5, smc-3647-35-Fungi, smc-3647-40-Sexual vs Asexual

BIOLOGY, M6 2019 HSC 26

The map shows the percentage of adult indigenous populations able to digest lactose.
 

The ability to digest lactose is due to the presence of an enzyme (lactase) which can metabolise the sugar (lactose) present in milk. The gene responsible for producing lactase is usually permanently switched off at some time between the ages of 2 and 5 years. However, some people remain able to digest lactose throughout their lives.

With reference to evolution and DNA, provide possible reasons for the distribution shown in the map.   (5 marks)

Show Answers Only
  • The ability to digest lactose is most likely due to a mutation where the gene is not shut off after age 5, and the body continues to produce lactase.
  • The differentiation in the graph above can also be viewed as the frequency of this mutation in certain areas.
  • In areas such as Europe, where over 90% of the adult indigenous population can digest lactose, this mutation is highly prevalent, suggesting it may have played a role in survival advantage.
  • In these areas, milk may make up a high portion of the diet and therefore the ability to digest lactose would prove advantageous and the resulting selective pressure would see it passed on (natural selection).
  • The opposite is true when looking at countries such as Australia where < 20% of indigenous adults can digest lactose.
  • We can deduce that milk is not essential to their traditional diet as the mutation is negligible and not passed on (i.e. it doesn’t constitute a survival advantage).
Show Worked Solution
  • The ability to digest lactose is most likely due to a mutation where the gene is not shut off after age 5, and the body continues to produce lactase.
  • The differentiation in the graph above can also be viewed as the frequency of this mutation in certain areas.
  • In areas such as Europe, where over 90% of the adult indigenous population can digest lactose, this mutation is highly prevalent, suggesting it may have played a role in survival advantage.
  • In these areas, milk may make up a high portion of the diet and therefore the ability to digest lactose would prove advantageous and the resulting selective pressure would see it passed on (natural selection).
  • The opposite is true when looking at countries such as Australia where < 20% of indigenous adults can digest lactose.
  • We can deduce that milk is not essential to their traditional diet as the mutation is negligible and not passed on (i.e. it doesn’t constitute a survival advantage).

♦♦ Mean mark 33%.

Filed Under: Mutation Tagged With: Band 5, Band 6, smc-3652-10-Mechanisms of Change/Variation

Measurement, STD1 M5 2022 HSC 11

The floor plan of a home unit has been drawn to scale.


  1. How many doors are shown on the plan?  (1 mark)

    --- 1 WORK AREA LINES (style=lined) ---

  2. What is the total floor area of the home unit in square metres?  (2 marks)

    --- 4 WORK AREA LINES (style=lined) ---

Show Answers Only
  1. `5`
  2. `text{55.5 m²}`
Show Worked Solution

a.    `5`

b.   `text{Conversion: 1000 mm = 1 metre}`

`text{Calculate area by splitting into 2 rectangles}`

`text{Area}`  `=  5.5 × 5 + (4.5 +2.5) xx 4`  
   `=  55.5\ text{m²}`  

♦♦ Mean mark part (b) 26%.

Filed Under: M5 Scale Drawings (Y12) Tagged With: Band 3, Band 5, smc-1105-10-Floor Plans

Measurement, STD1 M3 2022 HSC 8 MC

Which true bearing is the same as `text{S48°W}`?

  1. `132°`
  2. `222°`
  3. `228°`
  4. `312°`
Show Answers Only

`C`

Show Worked Solution

`text{True bearing}` `=180 + 48`
  `=228°`

 
`=>C`


♦ Mean mark 47%.

Filed Under: M3 Right-Angled Triangles (Y12) Tagged With: Band 5, smc-1103-70-Compass vs True Bearings

Measurement, STD1 M1 2022 HSC 4 MC

The area `(A)` of a circle is given by the formula `A=\pi r^2`, where `r` is the radius.

What is the value of `A`, correct to three significant figures, if `r=3.55` ?

  1. 39.5
  2. 39.6
  3. 39.591
  4. 39.592
Show Answers Only

`B`

Show Worked Solution
`A` `=pi\r^2`  
  `=pi xx3.55^2`  
  `=39.591…`  
  `=39.6\ \ text{(3 sig fig)}`  

  
`=>B`


♦♦ Mean mark 30%.
COMMENT: Significant figures warrant attention.

Filed Under: Identify and Convert Between Units (Std1-2027), Identify and Convert Between Units (Std2-2027), Perimeter and Area (Std 1), Units and Measurement Error (Std 1) Tagged With: Band 5, smc-1120-30-Significant Figures, smc-1121-20-Perimeter and Area (Circular Measure), smc-6303-50-Significant Figures, smc-6519-50-Significant Figures

Networks, STD1 N1 2022 HSC 2 MC

A network diagram is shown.


What is the number of edges in this network?

  1. 6
  2. 7
  3. 9
  4. 10
Show Answers Only

`D`

Show Worked Solution

There are 10 connection points (lines) between the nodes in the diagram.

`=>D`


♦ Mean mark 48%.

Filed Under: Basic Concepts Tagged With: Band 5, smc-1136-45-Number of Edges

BIOLOGY, M7 2019 HSC 33d

Alzheimer's disease causes destruction of brain tissue, dementia and eventually death.

The diagram shows the effect of Alzheimer's disease on the brain.

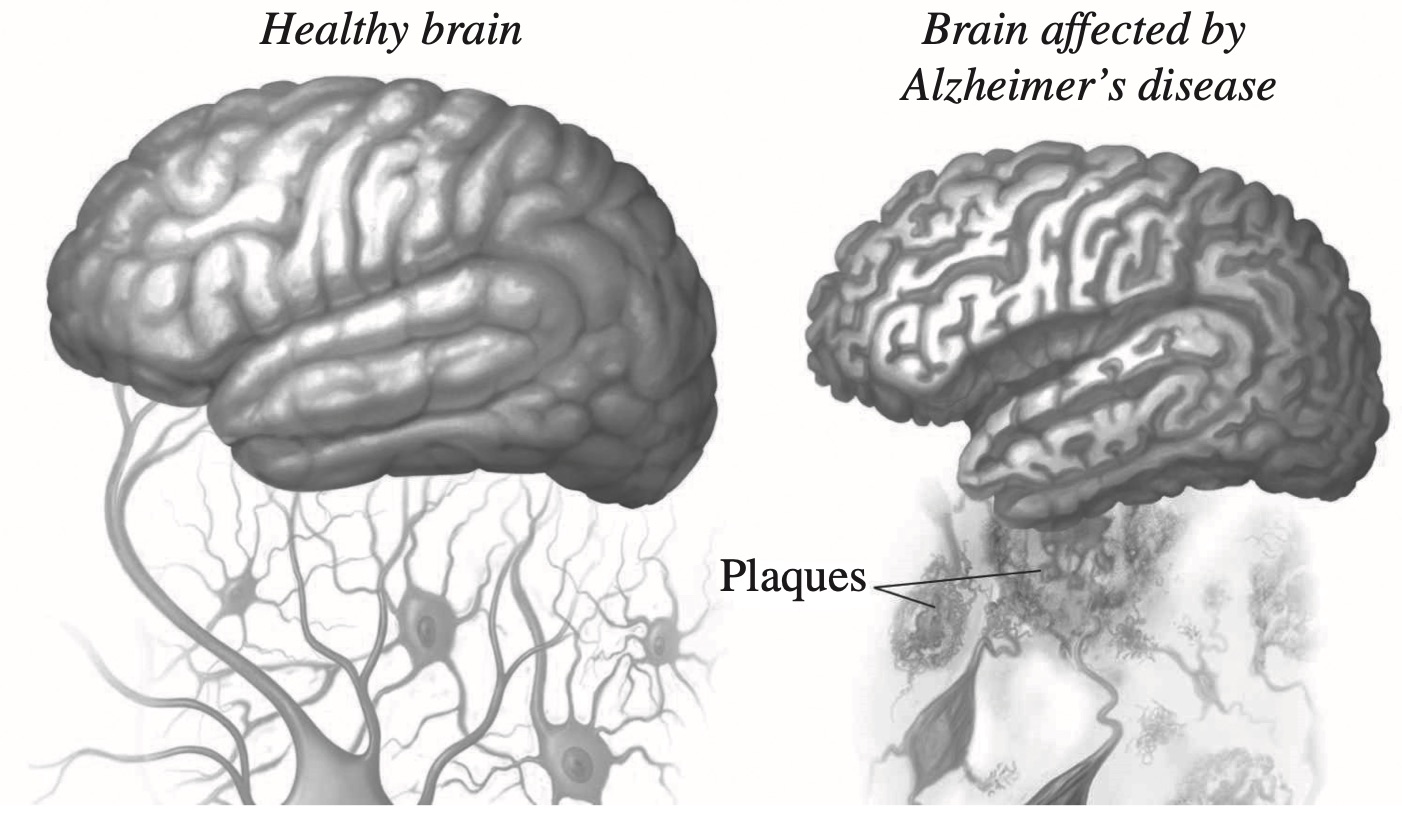
Amyloid beta protein is produced in the human brain throughout life. In people with Alzheimer's disease, it accumulates in excessive amounts.

The gene with the greatest known effect on the risk of developing late-onset Alzheimer's disease is called APOE. It is found on chromosome 19.

The APOE gene has multiple alleles, including e2, e3 and e4 .

The table shows the risk of developing Alzheimer's disease for various APOE genotypes compared to average risk in the population.


A large epidemiological study was conducted. It used historical data to investigate the association between Herpes simplex virus (HSV) infection and dementia. Dementia is caused by a variety of brain illnesses. Alzheimer's disease is the most common cause of dementia.

The study used the records of 8362 patients with HSV infection and 25086 randomly selected sex- and age-matched control patients without HSV infection. Some of the patients with HSV had been treated with antiviral medication.

The graph below shows some results of the study.
 

Diseases are classified as infectious or non-infectious.

Evaluate whether Alzheimer's disease should be classified as an infectious disease or a non-infectious disease. In your answer, include reference to the information and data provided above.   (8 marks)

--- 18 WORK AREA LINES (style=lined) ---

Show Answers Only

Infectious vs non-infection disease classification

  • Infectious diseases are a result of pathogens, biological agents of disease, which transmit disease between hosts. A pathogen is a cause of a certain disease if it meets the criteria in Koch’s postulates.
  • The study above shows the association between HSV and Alzheimer’s.
  • The study is conducted over a long period and includes a large and controlled sample size, so the assumption can be made that the findings are valid.
  • HSV is an infectious disease as it is caused by a pathogen, the virus Herpes simplex.
  • The findings show that treating HSV with antiviral medication also reduces the risk of developing Alzheimer’s.
  • This may mean that Alzheimer’s is also a virus and therefore an infectious disease. 
  • Non-infectious diseases are not contagious and do not spread from person to person. They are a result of environmental factors or genetic conditions.
  • Alzheimer’s is the result of a build-up of the amyloid beta protein, which is produced in the brain.
  • The synthesis of this protein is regulated by the APOE gene. This gene also has various alleles, each of which in different combinations can increase or decrease a individual’s risk of developing Alzheimer’s.
  • This indicates that Alzheimer’s is a non-infectious disease, as it is not transmitted by a pathogen. Rather, it results from a natural build up of a specific protein, which may be accelerated or reduced based on genotype. 

Conclusion

  • From the information provided it is not possible to accurately classify Alzheimer’s as either an infectious or non-infectious disease.
  • There is evidence to support that the risk of developing Alzheimer’s can be linked to both antiviral and virus traits as well as genotype.
Show Worked Solution

Infectious vs non-infection disease classification

  • Infectious diseases are a result of pathogens, biological agents of disease, which transmit disease between hosts. A pathogen is a cause of a certain disease if it meets the criteria in Koch’s postulates.
  • The study above shows the association between HSV and Alzheimer’s.
  • The study is conducted over a long period and includes a large and controlled sample size, so the assumption can be made that the findings are valid.
  • HSV is an infectious disease as it is caused by a pathogen, the virus Herpes simplex.
  • The findings show that treating HSV with antiviral medication also reduces the risk of developing Alzheimer’s.
  • This may mean that Alzheimer’s is also a virus and therefore an infectious disease. 
  • Non-infectious diseases are not contagious and do not spread from person to person. They are a result of environmental factors or genetic conditions.
  • Alzheimer’s is the result of a build-up of the amyloid beta protein, which is produced in the brain.
  • The synthesis of this protein is regulated by the APOE gene. This gene also has various alleles, each of which in different combinations can increase or decrease a individual’s risk of developing Alzheimer’s.
  • This indicates that Alzheimer’s is a non-infectious disease, as it is not transmitted by a pathogen. Rather, it results from a natural build up of a specific protein, which may be accelerated or reduced based on genotype. 

Conclusion

  • From the information provided it is not possible to accurately classify Alzheimer’s as either an infectious or non-infectious disease.
  • There is evidence to support that the risk of developing Alzheimer’s can be linked to both antiviral and virus traits as well as genotype.

♦♦ Mean mark 46%.

Filed Under: Causes and Effects, Causes of Infectious Disease, Epidemiology Tagged With: Band 5, Band 6, smc-3655-10-Classifying Pathogens, smc-3660-20-Genetic/Cancer, smc-3661-10-Analysing Results

BIOLOGY, M6 2019 HSC 25

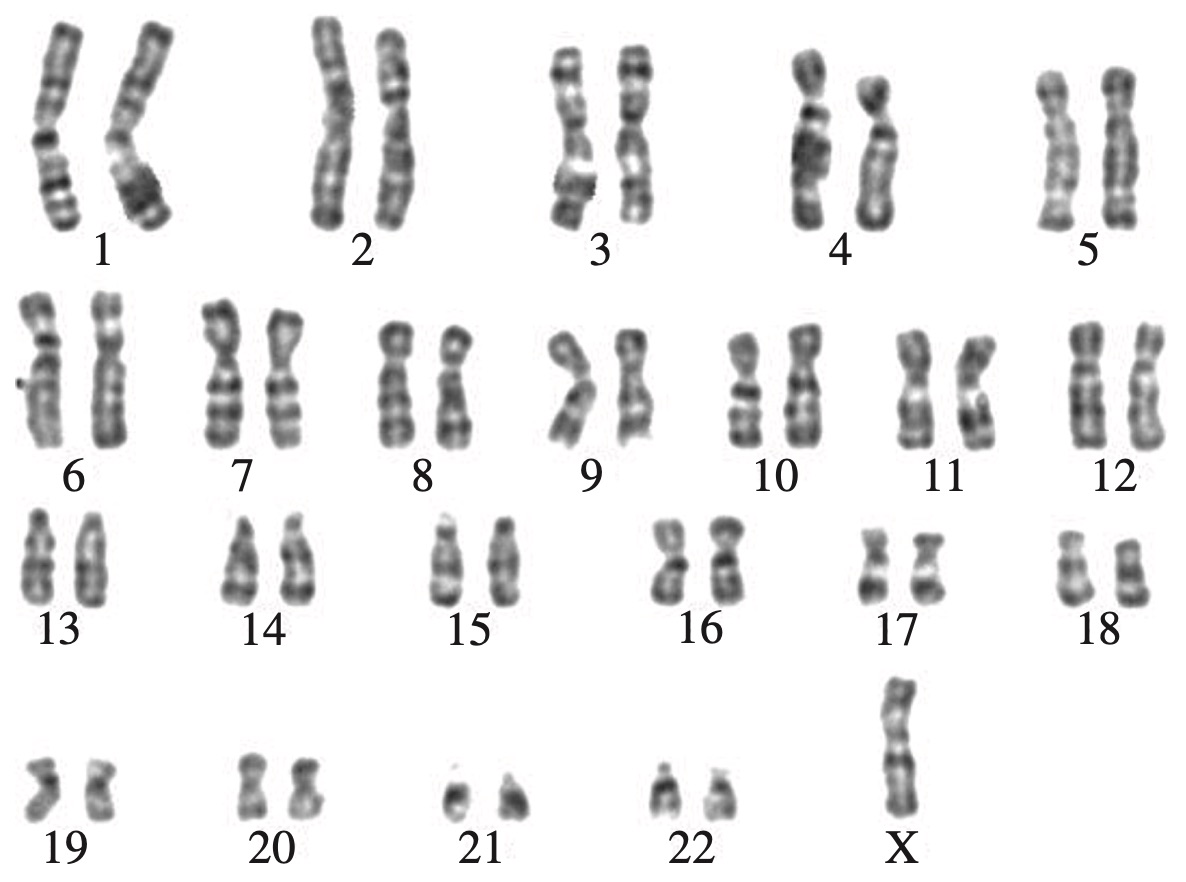
A human karyotype that shows evidence of chromosomal mutation is shown.

  1. Identify the evidence of chromosomal mutation in the karyotype.  (1 mark)

    --- 1 WORK AREA LINES (style=lined) ---

  2. Explain how cell division and fertilisation could lead to the production of this karyotype.  (4 marks)

    --- 8 WORK AREA LINES (style=lined) ---

Show Answers Only

a.   There is only one copy of the sex chromosome (Monosomy, Turner Syndrome).

b.    Process of producing karyotype:

  • During meiosis to produce a gamete, homologous chromosomes (during meiosis I) or sister chromatids (during meiosis II) may fail to separate.
  • This can occur with sex chromosomes, producing one gamete with 2 copies of the sex chromosome, and one without.
  • When the gamete without any sex cells undergoes fertilisation with a normal gamete with only one sex cell, the zygote will have only one sex cell, like the karyotype above.
Show Worked Solution

a.   There is only one copy of the sex chromosome (Monosomy, Turner Syndrome).

b.    Process of producing karyotype:

  • During meiosis to produce a gamete, homologous chromosomes (during meiosis I) or sister chromatids (during meiosis II) may fail to separate.
  • This can occur with sex chromosomes, producing one gamete with 2 copies of the sex chromosome, and one without.
  • When the gamete without any sex cells undergoes fertilisation with a normal gamete with only one sex cell, the zygote will have only one sex cell, like the karyotype above.

♦ Mean mark (a) 47%
♦♦♦ Mean mark (b) 24%.

Filed Under: Mutation Tagged With: Band 5, Band 6, smc-3652-40-Chromosomal Mutations, smc-3652-55-Mutation in Reproduction

BIOLOGY, M6 2019 HSC 22

Complete the table to show the differences between somatic and germ-line mutations.   (3 marks)

\begin{array}{|c|c|c|}
\hline
\rule{0pt}{2.5ex}\ \rule[-1ex]{0pt}{0pt}& \quad \quad \textit{Somatic mutation} \quad \quad & \quad \quad\textit{Germ-line mutation}\quad \quad \\
\hline
\rule{0pt}{5ex}\text { Location } \rule[-4.5ex]{0pt}{0pt}& & \\
\hline
\rule{0pt}{4ex}\text {Effect on} \\
\rule[-4ex]{0pt}{0pt}\text {offspring} \\
\hline
\rule{0pt}{5ex}\text {Example } \rule[-4.5ex]{0pt}{0pt}& & \\
\hline
\end{array}

--- 0 WORK AREA LINES (style=lined) ---

Show Answers Only

Show Worked Solution


Mean mark 52%.

Filed Under: Mutation Tagged With: Band 5, smc-3652-20-Somatic vs. Germ-Line

Mechanics, EXT2 M1 2022 HSC 10 MC

A particle is moving vertically in a resistive medium under the influence of gravity. The resistive force is proportional to the velocity of the particle.

The initial speed of the particle is NOT zero.

Which of the following statements about the motion of the particle is always true?

  1. If the particle is initially moving downwards, then its speed will increase.
  2. If the particle is initially moving downwards, then its speed will decrease.
  3. If the particle is initially moving upwards, then its speed will eventually approach a terminal speed.
  4. If the particle is initially moving upwards, then its speed will not eventually approach a terminal speed.
Show Answers Only

`C`

Show Worked Solution

`text{Case 1: particle moving downwards}`

`ddotx=g-kv\ \ (k>0)`

`text{Terminal velocity occurs when}\ \ ddotx=0\ \ =>\ \ v=g/k`

`text{Whether the particle’s speed increases, decreases or stays}`

`text{constant depends on whether}\ \ v_o<=g/k.`

`→\ text{Eliminate A and B.}`


♦ Mean mark 42%.

`text{Case 2: particle moving upwards}`

`ddotx=-g-kv\ \ (k>0)`

`text{→ Acceleration of gravity and resistance against motion}`

`text{→ Particle will eventually hit a peak and then move downwards}`

`text{→ Once moving downwards}\ \ ddotx=g-kv\ \ (k>0)`

`text{→ Particle will hit terminal velocity (see Case 1)}`

`=>C`

Filed Under: Resisted Motion Tagged With: Band 5, smc-1061-10-R ~ v, smc-1061-80-Terminal Velocity

  • « Previous Page
  • 1
  • …
  • 37
  • 38
  • 39
  • 40
  • 41
  • …
  • 82
  • Next Page »

Copyright © 2014–2025 SmarterEd.com.au · Log in