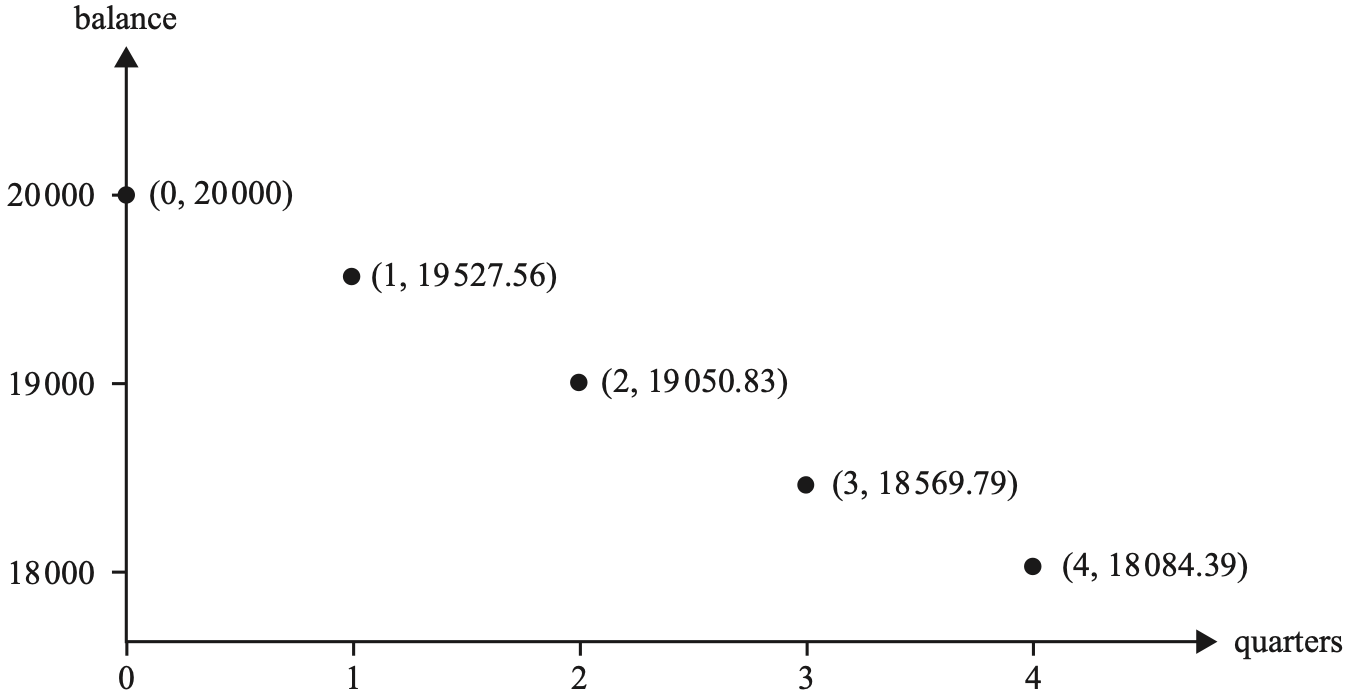
SmarterEd

Aussie Maths & Science Teachers: Save your time with SmarterEd

  • Login
  • Get Help
  • About

Vectors, EXT2 V1 2023 HSC 10 MC

Consider any three-dimensional vectors  \(\underset{\sim}{a}=\overrightarrow{O A}, \underset{\sim}{b}=\overrightarrow{O B}\)  and  \(\underset{\sim}{c}=\overrightarrow{O C}\)  that satisfy these three conditions

\(\underset{\sim}{a} \cdot \underset{\sim}{b}=1\)

\(\underset{\sim}{b} \cdot \underset{\sim}{c}=2\)

\(\underset{\sim}{c} \cdot \underset{\sim}{a}=3\).

Which of the following statements about the vectors is true?

  1. Two of \(\underset{\sim}{a}, \underset{\sim}{b}\) and \(\underset{\sim}{c}\) could be unit vectors.
  2. The points \(A, B\) and \(C\) could lie on a sphere centred at \(O\).
  3. For any three-dimensional vector \(\underset{\sim}{a}\), vectors \(\underset{\sim}{b}\) and \(\underset{\sim}{c}\) can be found so that \(\underset{\sim}{a}, \underset{\sim}{b}\) and \(\underset{\sim}{c}\) satisfy these three conditions.
  4. \(\forall \ \underset{\sim}{a}, \underset{\sim}{b}\) and \(\underset{\sim}{c}\) satisfying the conditions, \(\exists \ r, s\) and \(t\) such that \(r, s\) and \(t\) are positive real numbers and  \(r\underset{\sim}{a}+s \underset{\sim}{b}+t \underset{\sim}{c}=\underset{\sim}{0}\).
Show Answers Only

\(B\)

Show Worked Solution

\(\text{By elimination}\)

\(\text{Option}\ A:\)

\(\text{If}\ \underset{\sim}{a}\ \text{and}\ \underset{\sim}{b}\ \text{are the two unit vectors,}\ \ \underset{\sim}{a} \cdot \underset{\sim}{b} = \abs{\underset{\sim}{a}} \abs{\underset{\sim}{b}} \cos\,\theta = \cos\,\theta\)

\(-1 \leq \cos\,\theta \leq1\ \ \Rightarrow \ \ -1 \leq \underset{\sim}{a} \cdot \underset{\sim}{b} \leq1 \)

\(\text{Given}\ \ \underset{\sim}{a} \cdot \underset{\sim}{b}=1\ \Rightarrow\ \underset{\sim}{a} = \underset{\sim}{b}\ \Rightarrow\ \underset{\sim}{b} \cdot \underset{\sim}{c} = \underset{\sim}{c} \cdot \underset{\sim}{a}\)

\(\text{Contradicts}\ \ \underset{\sim}{b} \cdot \underset{\sim}{c} = 2\ \ \text{and}\ \ \underset{\sim}{c} \cdot \underset{\sim}{a} = 3\)

\(\text{Similar reasoning rules out any pair satisfying all conditions (eliminate}\ A). \)
 

\(\text{Option}\ C:\ \text{If}\ \ \underset{\sim}{a} = \underset{\sim}{0}, \  \underset{\sim}{a} \cdot \underset{\sim}{b} = 0 \neq 1\ \text{(eliminate}\ C). \)

\(\text{Option}\ D:\)

\(\text{Consider the vectors below that satisfy the conditions,}\)

\[\underset{\sim}{a}=\left(\begin{array}{c} 1 \\ 1 \\ 1 \end{array}\right),\ \  \underset{\sim}{b}=\left(\begin{array}{c} 1 \\ 0 \\ 0 \end{array}\right), \ \  \underset{\sim}{c}=\left(\begin{array}{c} 2 \\ 0 \\ 1 \end{array}\right) \]

\(\text{However,}\ r\underset{\sim}{a}+s \underset{\sim}{b}+t \underset{\sim}{c}=\underset{\sim}{0}\ \text{requires}\ \ r=s=t=0\ \ \text{which are not}\)

\(\text{positive constants (eliminate}\ D).\)

\(\Rightarrow B\)

♦♦♦ Mean mark 15%.

Filed Under: Basic Concepts and Arithmetic, Vectors and Geometry Tagged With: Band 6, smc-1195-40-Unit Vectors and Projections, smc-1210-50-Circle/Sphere

Networks, GEN1 2023 VCAA 38 MC

A particular building project has ten activities that must be completed.

These activities and their immediate predecessor(s) are shown in the table below.

\begin{array} {|c|c|}
\hline
\rule{0pt}{2.5ex} \textbf{Activity} \rule[-1ex]{0pt}{0pt} & \textbf{Immediate predecessor(s)} \\
\hline
A  & - \\
\hline
B  & - \\
\hline
C  & A \\
\hline
 D  & A \\
\hline
E  & B \\
\hline
 F  & D, E \\
\hline
 G  & C, F \\
\hline
 H  & F \\
\hline
 I  & D, E \\
\hline
 J  & H, I \\
\hline
\end{array}

A directed graph that could represent this project is
 

Show Answers Only

\(D\)

Show Worked Solution

\(\text{Activity}\ H\ \text{has only one immediate predecessor,}\ F. \)

\(\text{Eliminate}\ A, B, C\ \text{and}\ E. \)

\(\Rightarrow D\)

Filed Under: Critical Path Analysis Tagged With: Band 6, smc-621-10-Network table, smc-621-50-Dummy activities

Complex Numbers, EXT2 N2 2023 HSC 16a

Let \(w\) be the complex number  \(z=e^{\small{\dfrac{2i \pi}{3}}} \).

  1. Show that  \(1+w+w^2=0\).   (2 marks)

    --- 8 WORK AREA LINES (style=lined) ---

The vertices of a triangle can be labelled \(A, B\) and \(C\) in anticlockwise or clockwise direction, as shown.
 

Three complex numbers \(a, b\) and \(c\) are represented in the complex plane by points \(A, B\) and \(C\) respectively.

  1. Show that if triangle \(A B C\) is anticlockwise and equilateral, then  \(a+b w+c w^2=0\).   (2 marks)

    --- 8 WORK AREA LINES (style=lined) ---

  2. It can be shown that if triangle \(A B C\) is clockwise and equilateral, then \(a+b w^2+c w=0\). (Do NOT prove this.)
  3. Show that if \(A B C\) is an equilateral triangle, then

\(a^2+b^2+c^2=a b+b c+c a .\)  (2 marks)

--- 8 WORK AREA LINES (style=lined) ---

Show Answers Only
  1. \(\text{See Worked Solutions}\)
  2. \(\text{See Worked Solutions}\)
  3. \(\text{See Worked Solutions}\)
Show Worked Solution

i.    \(w=e^{\small{\dfrac{2i \pi}{3}}} \)

\(w^2=e^{\small{-\dfrac{2i \pi}{3}}} = \overline w \)

\(\text{Re}(w)=\cos \Big{(}\dfrac{2\pi}{3} \Big{)}=-\dfrac{1}{2} \)

\(1+w+w^2\) \(=1+w+\overline w \)  
  \(=1+ 2 \times \text{Re}(w) \)  
  \(=1+2 \times -\dfrac{1}{2} \)  
  \(=0\)  

 
ii.
    \(\text{Rotate}\ \ b-c\ \ \text{anticlockwise by}\ \ \dfrac{2\pi}{3} \)

\(\Rightarrow (b-c)w = c-a\)

\(\therefore bw-cw-c+a = a+bw-c(1+w) = 0 \)

\(\text{Substitute}\ \ 1+w=-w^2\ \ \text{(using part (i))} \)

\(a+bw-c(-w^2) \) \(=0\)  
\(a+bw+cw^2\) \(=0\ \ …\ \text{as required} \)  
♦♦♦ Mean mark (ii) 18%.

iii.   \(a+b w^2+c w=0\ \ \text{(if}\ \Delta ABC\ \text{is clockwise – given)} \)

\(a+bw+cw^2=0\ \ \text{(if}\ \Delta ABC\ \text{is anticlockwise)} \)

\(\Rightarrow (a+b w^2+c w)(a+bw+cw^2) = 0\ …\ (1)\)
 

\(\text{Expand (1) using part (i):}\ \ w+w^2=-1\ \ \text{and}\ \ w^3 = z^3 = 1 \)

\(a^2+abw^2+acw+bwa+b^2w^3+bcw^2+cw^2a+cbw^4+c^2w^3\) \(=0\)  
\(a^2+b^2+c^2+ab(w+w^2)+bc(w+w^2)+ca(w+w^2)\) \(=0\)  
\(a^2+b^2+c^2+ab(-1)+bc(-1)+ca(-1) \) \(=0\)  

 
\(\therefore a^2+b^2+c^2 = ab+bc+ca\ …\ \text{as required} \)

♦♦♦ Mean mark (iii) 11%.

Filed Under: Geometrical Implications of Complex Numbers Tagged With: Band 3, Band 6, smc-1052-20-Triangles, smc-1052-55-Rotations, smc-1052-70-Vectors

Financial Maths, GEN1 2023 VCAA 23 MC

Tavi took out a loan of $20 000, with interest compounding quarterly. She makes quarterly repayments of $653.65.

The graph below represents the balance in dollars of Tavi's loan at the end of each quarter of the first year of the loan.
 

The effective interest rate for the first year of Tavi's loan is closest to

  1. 3.62%
  2. 3.65%
  3. 3.66%
  4. 3.67%
  5. 3.68%
Show Answers Only

\(D\)

Show Worked Solution

\(\text{After 1 quarter:}\)

\(\text{Principal paid}\ = 20\ 000-19\ 527.56= $472.44 \)

\(\text{Interest paid}\ = 653.65-472.44= $181.21\)

\(r = 4 \times \dfrac{181.21}{20\ 000} = 0.036242 = 3.6242\% \)

\(r_{effective}\) \(= \Bigg{[}\Big{(}1+\dfrac{r}{100n}\Big{)}^n-1 \Bigg{]} \times 100\%\)
  \(= \Bigg{[}\Big{(}1+\dfrac{0.03624}{4}\Big{)}^4-1 \Bigg{]} \times 100\%\)
  \(= 0.0367 \times 100\%\)
  \(= 3.67\%\)

 
\(\Rightarrow D\)

Filed Under: Borrowing and Loans Tagged With: Band 6, smc-603-25-Effective interest rate

PHYSICS, M2 2023 VCE 8

Maia is at a skatepark. She stands on her skateboard as it rolls in a straight line down a gentle slope at a constant speed of 3.0 m s\(^{-1}\), as shown in the figure below. The slope is 5° to the horizontal.

The combined mass of Maia and the skateboard is 65 kg.
  

  1. The combined system of Maia and the skateboard is modelled as a small box with point \(\text{M}\) at the centre of mass, as shown below.
  2. Draw and label arrows to represent each of the forces acting on the system - that is, Maia and skateboard as they roll down the slope.   (3 marks)


--- 0 WORK AREA LINES (style=lined) ---

  1. Calculate the magnitude of the total frictional forces acting on Maia and the skateboard.  (2 marks)

    --- 5 WORK AREA LINES (style=lined) ---

Near the bottom of the ramp, Maia takes hold of a large pole and comes to a complete rest while still standing on the skateboard. Maia and the skateboard now have no momentum or kinetic energy.

  1. Explain what happened to both the momentum and the kinetic energy of Maia and the skateboard. No calculations are required.  (2 marks)

    --- 3 WORK AREA LINES (style=lined) ---

Show Answers Only

a.
         

b.     55.5 N

c.    Momentum:

  • Maia and the skateboards momentum was transferred into the pole and hence into the Earth. Due to the Earth’s very large mass, the effect on its velocity is negligible.

Kinetic energy:

  • The kinetic energy of Maia and the skateboard would have been transformed into heat energy between the contact of Maia and the pole and/or transferred into the work done by Maia’s muscles in slowing herself down.

Show Worked Solution

a.
        

b.     Total frictional forces:

  • Constant speed means that the force down the slope of the incline is equal to the sum of the frictional forces acting on Maia and the skateboard.
\(F_{\text{down slope}}\) \(=F_f\) \(=mg\, \sin\, \theta\)
    \(=65 \times 9.8 \times \sin\,5^{\circ}\)
    \(=55.5\ \text{N}\)
♦ Mean mark (b) 50%.

c.    Momentum:

  • Maia and the skateboards momentum was transferred into the pole and hence into the Earth. Due to the Earth’s very large mass, the effect on its velocity is negligible.

Kinetic energy:

  • The kinetic energy of Maia and the skateboard would have been transformed into heat energy between the contact of Maia and the pole and/or transferred into the work done by Maia’s muscles in slowing herself down.
♦♦♦ Mean mark (c) 26%.

Filed Under: Forces, Acceleration and Energy, Momentum, Energy and Simple Systems Tagged With: Band 4, Band 5, Band 6, smc-4276-20-Friction, smc-4277-20-Momentum conservation, smc-4277-30-Energy conservation

ENGINEERING, PPT 2023 HSC 27b

A portion of a roller coaster wheel sub-assembly is shown.
 

An exploded pictorial of the wheel sub-assembly is shown.


Complete an assembled sectioned front view of the wheel sub-assembly at scale 1: 2. Apply AS 1100 drawing standards. Do NOT add dimensions.  (6 marks)

--- 0 WORK AREA LINES (style=lined) ---


Show Answers Only

Show Worked Solution


♦ Mean mark 49%.

Filed Under: Communication Tagged With: Band 5, Band 6, smc-3721-20-Sectional views, smc-3721-40-AS 1100

ENGINEERING, CS 2023 HSC 26c

A truss is loaded as shown.


Showing working, complete the table.   (6 marks)
 

\begin{array} {|l|c|c|}
\hline
\rule{0pt}{2.5ex}  \rule[-1ex]{0pt}{0pt} & \textit{Magnitude} & \textit{Nature of force}\\ & \text{(kN)} & \text{(T or C)} \\
\hline
\rule{0pt}{2.5ex} \text{Internal reaction of member}\ EF \rule[-1ex]{0pt}{0pt} &  & \\
\hline
\rule{0pt}{2.5ex} \text{Internal reaction of member}\ CH \rule[-1ex]{0pt}{0pt} &  & \\
\hline
\end{array}
Show Answers Only

\begin{array} {|l|c|c|}
\hline
\rule{0pt}{2.5ex}  \rule[-1ex]{0pt}{0pt} & \textit{Magnitude} & \textit{Nature of force}\\ & \text{(kN)} & \text{(T or C)} \\
\hline
\rule{0pt}{2.5ex} \text{Internal reaction of member}\ EF \rule[-1ex]{0pt}{0pt} & 73.2\ \text{kN} & \text{Compression} \\
\hline
\rule{0pt}{2.5ex} \text{Internal reaction of member}\ CH \rule[-1ex]{0pt}{0pt} & 71.138\ \text{kN} & \text{Tension} \\
\hline
\end{array}

Show Worked Solution

\begin{array} {|l|c|c|}
\hline
\rule{0pt}{2.5ex}  \rule[-1ex]{0pt}{0pt} & \textit{Magnitude} & \textit{Nature of force}\\ & \text{(kN)} & \text{(T or C)} \\
\hline
\rule{0pt}{2.5ex} \text{Internal reaction of member}\ EF \rule[-1ex]{0pt}{0pt} & 73.2\ \text{kN} & \text{Compression} \\
\hline
\rule{0pt}{2.5ex} \text{Internal reaction of member}\ CH \rule[-1ex]{0pt}{0pt} & 71.138\ \text{kN} & \text{Tension} \\
\hline
\end{array}

\(\text{Consider member}\ EF:\)


  • \(\text{Force diagram closes with two collinear forces}\)
  • \(FG\ \text{is a zero force member}\)
  • \(EF = 73.2\ \text{kN (compression)} \)
♦♦♦ Mean mark 36%.

\(\text{Consider member}\ CH:\)
 

\(+ \uparrow \Sigma F_{V}\) \(=0\)  
\(0\) \(=-125 + 73.2 \times \sin\,60^{\circ} + CH \times \sin\,60^{\circ}\)  
\(CH \times \sin\,60^{\circ}\) \(=61.607\)  
\(CH\) \(= \dfrac{61.607}{\sin\,60^{\circ}} =71.138\ \text{kN (tension)} \)  

Filed Under: Engineering Mechanics Tagged With: Band 5, Band 6, smc-3714-10-Truss analysis, smc-3714-70-Compressive stress

ENGINEERING, PPT 2023 HSC 25d

A uniform 8-metre ladder with a mass of 12 kg has been placed against a smooth wall. 
 

Determine the minimum coefficient of static friction between the ground and the ladder. Assume there is no friction between the ladder and the wall.   (4 marks)

--- 5 WORK AREA LINES (style=lined) ---

Show Answers Only

\(\mu = 0.287\)

Show Worked Solution

Graphical solution:

\(\phi = 16^{\circ}\)

\(\mu = \tan \phi = \tan 16^{\circ} = 0.287\ \text{(3 d.p.)}\)

♦♦ Mean mark 31%.

Analytical solution:

\(\cos 60^{\circ} = \dfrac{\text{d}_1}{4}\ \Rightarrow \ \text{d}_1 = 2\ \text{m} \)

\(\sin 60^{\circ} = \dfrac{\text{d}_2}{8}\ \Rightarrow \ \text{d}_2 = 6.928\ \text{m} \)

\( \Sigma \text{M}_{\text{G}} \) \(=0\)  
\(0\) \(=(120 \times 2)-(\text{F}_{\text{W}} \times 6.928) \)  
\(\text{F}_{\text{W}}\) \(=\dfrac{240}{6.928}= 34.64\ \text{N}\)  

 
\(\therefore \text{F}_{\text{F}} = 34.64 \text{ N}\)

\(\text{F}_{\text{g}}=mg=120\ \text{N}\)

 
\(\therefore \text{N} = 120 \text{N}\uparrow \)
 

\(\text{F}_{\text{F}}\) \(= \mu \text{N}\)  
\(\mu\) \(= \dfrac{34.64}{120}=0.289\ \text{(3 d.p.)} \)  

Filed Under: Mechanics Tagged With: Band 5, Band 6, smc-3718-30-Friction

ENGINEERING, PPT 2023 HSC 24b

A roller coaster component is fabricated using cold rolled steel. Two webs are welded onto a base plate as shown.   (2 marks)
 

The diagram shows a partially completed microstructure of the parent and weld metals.

Complete the microstructure by drawing and labelling the following grain types in the heat-affected zone for ONE of the webs:

    • chill crystals
    • equi-axed grains
    • columnar grains.

Show Answers Only

Correct answers include one of the labelled grain types:

Show Worked Solution

Correct answers include one of the labelled grain types:
 

Filed Under: Materials Tagged With: Band 6, smc-3719-10-Manufacturing - Ferrous

BIOLOGY, M2 EQ-Bank 29

The countercurrent flow in the gills of fish allow for up to 95% of oxygen to be extracted from water.

Explain how the structure of fish gills and the countercurrent flow contribute to the efficiency of the gas exchange process.   (4 marks)

--- 8 WORK AREA LINES (style=lined) ---

Show Answers Only
  • Fish do not breathe air like humans but instead acquire oxygen through water when it flows over their gills.
  • The gill is structured by a gill bar (in bony fish) and contains thousands of leaf like filaments called lamellae.
  • Gas exchange can occur when water flows over the lamellae and their abundance drastically increases surface area, allowing for a higher frequency of gas exchange.
  • Gills also utilise countercurrent flow, where the water and deoxygenated blood will flow in opposite directions.
  • This allows for a concentration gradient to be maintained, rather than co-current flow which results in diffusion stopping when the oxygen is ‘evenly split’ 50/50 between the water and the blood.
Show Worked Solution
  • Fish do not breathe air like humans but instead acquire oxygen through water when it flows over their gills.
  • The gill is structured by a gill bar (in bony fish) and contains thousands of leaf like filaments called lamellae.
  • Gas exchange can occur when water flows over the lamellae and their abundance drastically increases surface area, allowing for a higher frequency of gas exchange.
  • Gills also utilise countercurrent flow, where the water and deoxygenated blood will flow in opposite directions.
  • This allows for a concentration gradient to be maintained, rather than co-current flow which results in diffusion stopping when the oxygen is ‘evenly split’ 50/50 between the water and the blood.

Filed Under: Organisation of Cells Tagged With: Band 5, Band 6, smc-4304-75-Cardiorespiratory System

PHYSICS, M3 EQ-Bank 5

A 50 gram copper ball is placed into an insulated container containing 50 mL of water and immediately sealed. The initial temperature of the metal ball and water is 50°C and 10°C respectively. 

A student hypothesises that since the water and copper ball both have the same mass, the temperature of the metal ball and water, once thermal equilibrium is established, would be 30°C.

When the student measured the temperature inside the container, it was 26°C.

Explain the results of the experiment and why the student's hypothesis is incorrect.   (4 marks)

--- 10 WORK AREA LINES (style=lined) ---

Show Answers Only
  • Although the masses of the copper ball and water are the same, the specific heat capacities of the objects are different which leads to different changes in temperature.
  • The student’s hypothesis is incorrect as they did not take the specific heat capacity values into account.
  • The specific heat capacity of water is greater than that of copper, thus a greater amount of energy would be required to heat water to a certain temperature than to heat copper to that same temperature.
  • Therefore, when reaching a state of thermal equilibrium, the energy transfer between the copper ball and water cools the copper ball down faster than the water heats up.
  • This leads to the final temperature within the container of 26°C, which is closer to the initial temperature of the water than the copper ball.
Show Worked Solution
  • Although the masses of the copper ball and water are the same, the specific heat capacities of the objects are different which leads to different changes in temperature.
  • The student’s hypothesis is incorrect as they did not take the specific heat capacity values into account.
  • The specific heat capacity of water is greater than that of copper, thus a greater amount of energy would be required to heat water to a certain temperature than to heat copper to that same temperature.
  • Therefore, when reaching a state of thermal equilibrium, the energy transfer between the copper ball and water cools the copper ball down faster than the water heats up.
  • This leads to the final temperature within the container of 26°C, which is closer to the initial temperature of the water than the copper ball.

Filed Under: Thermodynamics Tagged With: Band 5, Band 6, smc-4282-10-Specific heat capacity

PHYSICS, M3 EQ-Bank 1

Jack enjoys drinking green tea at 60°C.

He pours 200 mL of 90°C green tea into a cup and then adds 4°C chilled water to the same cup to cool it down.

What is the minimum amount of chilled water, to the nearest mL, required to cool Jack's green tea to 60°C?   (4 marks)

(Assume the green tea is essentially water and no energy is lost to the surroundings) 

--- 9 WORK AREA LINES (style=lined) ---

Show Answers Only

\(107\ \text{mL}\)

Show Worked Solution
  • The energy contained in the temperature of the green tea that is lost to reduce it to 60°C needs to be used to heat up the chilled water from 4°C to 60°C.
  • Green tea’s change in temperature \(=90^{\circ}-60^{\circ}=30^{\circ}\).
  • The energy that needs to be lost from the green tea can be quantised:
  •    \(Q=mc\Delta t=200 \times 4.18 \times -30=-25\ 080\ \text{J}\)
  • This \(25\ 080\ \text{J}\) then goes into heating up a required amount of chilled water from \(4^{\circ}\) to \(60^{\circ}\).
\(Q\) \(=mc\Delta t\)  
\(25\ 080\) \(=m \times 4.18 \times 56\)  
\(m\) \(=\dfrac{25\ 080}{4.18 \times 56}\)  
  \(=107\ \text{g}\)  
  \(=107\ \text{mL}\)  

Filed Under: Thermodynamics Tagged With: Band 6, smc-4282-30-Q=mcΔt, smc-4282-35-Quantitative calcs

PHYSICS, M1 EQ-Bank 5

Car A approaches an intersection at 10 ms\(^{-1}\) from the South as shown. As Car B approaches the intersection, it measures the velocity of Car A to be 22.36 ms\(^{-1}\) NW.
 

Draw Car B on the diagram showing its direction and speed. Show all working.   (3 marks)

--- 8 WORK AREA LINES (style=lined) ---

Show Answers Only

  • Velocity of A relative to B = \(v_A-v_B=v_A+-v_B\)

  • The direction of \(-v_B\) must be west, and therefore the direction of \(v_B\) is east.
  • Using Pythagoras theorem, the magnitude of \(-v_B\) is:
\(-v_B\) \(=\sqrt{22.36^2-10^2}\)  
  \(=20\ \text{ms}^{-1}\)  


  • Therefore the vector \(v_B\) is \(20\ \text{ms}^{-1}\) east.

Show Worked Solution

  • Velocity of A relative to B = \(v_A-v_B=v_A+-v_B\)

  • The direction of \(-v_B\) must be west, and therefore the direction of \(v_B\) is east.
  • Using Pythagoras theorem, the magnitude of \(-v_B\) is:
  •    \(-v_B=\sqrt{22.36^2-10^2}=20\ \text{ms}^{-1}\)
  • Thus the vector \(v_B\) is \(20\ \text{ms}^{-1}\) east.

Filed Under: Motion on a Plane Tagged With: Band 6, smc-4274-40-Relative motion, smc-4274-50-Vector diagrams

PHYSICS, M3 2018 VCE 11

The diagram shows two speakers, \(\text{A}\) and \(\text{ B}\), facing each other. The speakers are connected to the same signal generator/amplifier and the speakers are simultaneously producing the same 340 Hz sound.
 

Take the speed of sound to be 340 ms\( ^{-1}\).

  1. Calculate the wavelength of the sound.   (1 mark)

    --- 2 WORK AREA LINES (style=lined) ---

  2. A student stands in the centre, equidistant from speakers \(\text{A}\) and \(\text{B}\). He then moves towards speaker \(\text{B}\) and experiences a sequence of loud and quiet regions. He stops at the second region of quietness.
  3. How far has the student moved from the centre? Explain your reasoning.   (3 marks)

    --- 8 WORK AREA LINES (style=lined) ---

Show Answers Only

a.     \(\lambda=1\ \text{m}\)

b.   Distance moved from the centre:

  • At the centre of the speakers, there is an area of relative loudness
  • This is due to a path difference of 0 metres between the wavelengths of sounds coming from both speaker \(\text{A}\) and speaker \(\text{B}\). 
  • As the student moves towards speaker \(\text{B}\), the two sound waves will experience constructive and destructive interference.
  • The peak of speaker \(\text{A}\) will move into the trough of speaker \(\text{B}\) where he experiences the first region of quietness (node) which is 1 quarter wavelength (0.25m) from the centre.
  • The second region of quietness (node) will be half of a wavelength (0.5m) from the first region of quietness. Thus, the total distance from the centre to the second region of quietness is 0.75m.
Show Worked Solution

a.    \(\lambda=\dfrac{v}{f}=\dfrac{340}{340}=1\ \text{m}\)

  
b.   Distance moved from the centre:

  • At the centre of the speakers, there is an area of relative loudness
  • This is due to a path difference of 0 metres between the wavelengths of sounds coming from both speaker \(\text{A}\) and speaker \(\text{B}\). 
  • As the student moves towards speaker \(\text{B}\), the two sound waves will experience constructive and destructive interference.
  • The peak of speaker \(\text{A}\) will move into the trough of speaker \(\text{B}\) where he experiences the first region of quietness (node) which is 1 quarter wavelength (0.25m) from the centre.
  • The second region of quietness (node) will be half of a wavelength (0.5m) from the first region of quietness. Thus, the total distance from the centre to the second region of quietness is 0.75m.
♦♦♦ Mean mark (b) 20%.

Filed Under: Wave Properties and Behaviour Tagged With: Band 3, Band 6, smc-4278-20-Wave calculations, smc-4278-50-Wave superposition

CHEMISTRY, M2 2014 VCE 11*

Consider the following unbalanced ionic equation.

\(\ce{Hg(l) + Cr2O7^2–(aq) + H+(aq)\rightarrow Hg^2+(aq) + Cr^3+(aq) + H2O(l)}\)

When this equation is completely balanced including the total charge on each side of the equation, find the coefficient of \(\ce{Hg(l)}\).   (3 marks)

--- 3 WORK AREA LINES (style=lined) ---

Show Answers Only

\(3\)

Show Worked Solution
  • By balancing the equations by the total number of atoms of each side
  •    \(\ce{Hg(l) + Cr2O7^2–(aq) + 14H+(aq)\rightarrow Hg^2+(aq) + 2Cr^3+(aq) + 7H2O(l)}\)
  • The charge on the left side is \(+12\) while the charge on the right side is \(+8\)
  • The charge on the right hand side needs to be increased by \(+4\)
  • This can be done by changing to \(\ce{3Hg^2+(aq)}\).
  • The total balanced equation while following law of conservation of charge is:
  •    \(\ce{3Hg(l) + Cr2O7^2–(aq) + 14H+(aq)\rightarrow 3Hg^2+(aq) + 2Cr^3+(aq) + 7H2O(l)}\)
  • Hence the coefficient of \(\ce{Hg(l)}\) is \(3\).

Filed Under: Chemical Reactions and Stoichiometry Tagged With: Band 6, smc-4259-50-Balancing Chemical Equations

PHYSICS, M4 2020 VCE 18

Students are modelling the effect of the resistance of electrical cables, \(r\), on the transmission of electrical power. They model the cables using the circuit shown in Figure 18.
 

The students investigate the effect of changing \(r\) by measuring the current in the electrical cables for a range of values. Their results are shown in Table 1 below.
 

\begin{array} {|c|c|c|}
\hline
\rule{0pt}{2.5ex} \text{Resistance of cables,}\ r\ (\Omega) \rule[-1ex]{0pt}{0pt} & \text{Current in cables},\ i\ (\text{A}) & \ \ \ \dfrac{1}{i} \Big{(}\text{A}^{-1}\Big{)}\ \ \  \\
\hline
\rule{0pt}{2.5ex} 2.4 \rule[-1ex]{0pt}{0pt} & 2.4 &  \\
\hline
\rule{0pt}{2.5ex} 3.6 \rule[-1ex]{0pt}{0pt} & 2.0 &  \\
\hline
\rule{0pt}{2.5ex} 6.4 \rule[-1ex]{0pt}{0pt} & 1.7 &  \\
\hline
\rule{0pt}{2.5ex} 7.6 \rule[-1ex]{0pt}{0pt} & 1.5 &  \\
\hline
\rule{0pt}{2.5ex} 10.4 \rule[-1ex]{0pt}{0pt} & 1.3 &  \\
\hline
\end{array}

  1. To analyse the data, the students use the following equation to calculate the resistance of the cables for the circuit.
  2.         \(r=\dfrac{24}{i}-R\)
  3. Show that this equation is true for the circuit shown in Figure 18. Show your working.  (2 marks)

    --- 3 WORK AREA LINES (style=lined) ---

  4. Calculate the values of \(\dfrac{1}{i}\) and write them in the spaces provided in the last column of Table 1 . (1 mark)

    --- 0 WORK AREA LINES (style=lined) ---

  5. Plot a graph of \(r\) on the \(y\)-axis against \(\dfrac{1}{i}\) on the \(x\)-axis on the grid provided below. On your graph:
    • choose an appropriate scale and numbers for the \(x\)-axis
    • draw a straight line of best fit through the plotted points  (3 marks)


--- 0 WORK AREA LINES (style=lined) ---

  1. Use the straight line of best fit to find the value of the constant resistance globe, \(R\). Give your reasoning.  (2 marks)

    --- 5 WORK AREA LINES (style=lined) ---

Show Answers Only

a.      \(V\) \(=iR\)  
\(V\) \(=i(r+R)\)  
\(\dfrac{V}{i}\) \(=r+R\)  
\(r\) \(=\dfrac{V}{i}-R\)  
\(r\) \(=\dfrac{24}{i}-R\)  

b.   

\begin{array} {|c|c|c|}
\hline
\rule{0pt}{2.5ex} \text{Resistance of cables,}\ r\ (\Omega) \rule[-1ex]{0pt}{0pt} & \text{Current in cables},\ i\ (\text{A}) & \ \ \ \dfrac{1}{i} \Big{(}\text{A}^{-1}\Big{)}\ \ \  \\
\hline
\rule{0pt}{2.5ex} 2.4 \rule[-1ex]{0pt}{0pt} & 2.4 & 0.42 \\
\hline
\rule{0pt}{2.5ex} 3.6 \rule[-1ex]{0pt}{0pt} & 2.0 & 0.5 \\
\hline
\rule{0pt}{2.5ex} 6.4 \rule[-1ex]{0pt}{0pt} & 1.7 & 0.59 \\
\hline
\rule{0pt}{2.5ex} 7.6 \rule[-1ex]{0pt}{0pt} & 1.5 & 0.67 \\
\hline
\rule{0pt}{2.5ex} 10.4 \rule[-1ex]{0pt}{0pt} & 1.3 & 0.77 \\
\hline
\end{array}

c.    
       

d.    The equation for the line:  \(r=\dfrac{24}{i}-R\).

  • The \(y\)-intercept of the graph correlates to the value of \(R\).
  • Reading from the graph, \(R= 7\ \Omega\).

Show Worked Solution

a.      \(V\) \(=iR\)  
\(V\) \(=i(r+R)\)  
\(\dfrac{V}{i}\) \(=r+R\)  
\(r\) \(=\dfrac{V}{i}-R\)  
\(r\) \(=\dfrac{24}{i}-R\)  
♦♦ Mean mark (a) 37%.

b.   

\begin{array} {|c|c|c|}
\hline
\rule{0pt}{2.5ex} \text{Resistance of cables,}\ r\ (\Omega) \rule[-1ex]{0pt}{0pt} & \text{Current in cables},\ i\ (\text{A}) & \ \ \ \dfrac{1}{i} \Big{(}\text{A}^{-1}\Big{)}\ \ \  \\
\hline
\rule{0pt}{2.5ex} 2.4 \rule[-1ex]{0pt}{0pt} & 2.4 & 0.42 \\
\hline
\rule{0pt}{2.5ex} 3.6 \rule[-1ex]{0pt}{0pt} & 2.0 & 0.5 \\
\hline
\rule{0pt}{2.5ex} 6.4 \rule[-1ex]{0pt}{0pt} & 1.7 & 0.59 \\
\hline
\rule{0pt}{2.5ex} 7.6 \rule[-1ex]{0pt}{0pt} & 1.5 & 0.67 \\
\hline
\rule{0pt}{2.5ex} 10.4 \rule[-1ex]{0pt}{0pt} & 1.3 & 0.77 \\
\hline
\end{array}

c.    
       

d.    The equation for the line:  \(r=\dfrac{24}{i}-R\).

  • The \(y\)-intercept of the graph correlates to the value of \(R\).
  • Reading from the graph, \(R= 7\ \Omega\).
♦♦ Mean mark (d) 33%.

Filed Under: Electric Circuits Tagged With: Band 5, Band 6, smc-4284-10-V=IR, smc-4284-20-Resistence in circuits, smc-4284-40-Heating effects of current

PHYSICS, M3 2021 VCE 14

A distant fire truck travelling at 20 ms\(^{-1}\) to a fire has its siren emitting sound at a constant frequency of 500 Hz.

Chris is standing on the edge of the road. Assume that the fire truck is travelling directly towards him as it approaches and directly away from him as it goes past. The arrangement is shown in the diagram.
 

  1. On the diagram below, sketch the frequency that Chris will hear as the truck moves towards him and then moves away from him. The \(500 \text{ Hz}\) siren signal is shown as a dotted line for reference. No calculations are required.   (2 marks)


  1. Name the physics principle involved in Chris’s experience.   (1 mark)
Show Answers Only

a.    

  
b.   The Doppler effect
Show Worked Solution

a.    

♦♦♦ Mean mark (a) 13%.
COMMENT: Poorly completed by most students, many incorrectly drew a smooth line that passed Chris at 500 Hz.
  
b.   The Doppler effect

Filed Under: Sound Waves Tagged With: Band 3, Band 6, smc-4280-10-Doppler effect

PHYSICS, M2 2021 VCE 4

Liesel, a student of yoga, sits on the floor in the lotus pose, as shown in Figure 4. The action force, \(F_g\), on Liesel due to gravity is 500 N down.
 

Identify and explain what the reaction force is to the action force, \(F_{ g }\), shown in the diagram above.   (2 marks)

--- 5 WORK AREA LINES (style=lined) ---

Show Answers Only
  • As the action force, \(F_g\), is the gravitational force on Liesel due to the Earth, then the reaction force is the gravitational force on the Earth due to Liesel, by Newton’s third law of motion.
  • This would be a force of 500 N of Liesel pulling up on the Earth (the Earth being attracted\accelerated to Liesel due to her own gravitational force).
Show Worked Solution
  • As the action force, \(F_g\), is the gravitational force on Liesel due to the Earth, then the reaction force is the gravitational force on the Earth due to Liesel, by Newton’s third law of motion.
  • This would be a force of 500 N of Liesel pulling up on the Earth (the Earth being attracted\accelerated to Liesel due to her own gravitational force).
♦♦♦ Mean mark 9%.
COMMENT: Many students confused Newton’s third law with balancing forces. The 500N pushing up on Liesel is the normal force not the reaction force (which are not the same).

Filed Under: Forces Tagged With: Band 6, smc-4275-20-Newtons 3rd Law

PHYSICS, M4 2022 VCE 4*

Two point charges, \(Q\) and \(4Q\), are placed 12 cm apart, as shown in the diagram below.
 

On the straight line between the charges \(Q\) and \(4Q\), find where the electric field is zero.   (3 marks)

--- 7 WORK AREA LINES (style=lined) ---

Show Answers Only

\(\text{4cm to the right of}\ Q\)

Show Worked Solution
  • The point where the force on a charged particle \(q\) as a result of the two fields from \(Q\) and \(4Q\) is equal and opposite is where the electric field strength would be zero.
  • Let \(x\) equal the distance from \(Q\) to \(q\) and \(y\) be the distance from \(4Q\) to \(q\) so  \(x +y=12\)
     

\(F_{\text{\(Q\) on \(q\)}}\) \(=F_{\text{\(4Q\) on \(q\)}}\)  
\(\dfrac{1}{4 \pi \varepsilon_0} \dfrac{Q \times q}{x^2}\) \(=\dfrac{1}{4 \pi \varepsilon_0} \dfrac{4Q \times q}{y^2}\)  
\(\dfrac{1}{x^2}\) \(=\dfrac{4}{y^2}\)  
\(y^2\) \(=4x^2\)  
\(y\) \(=2x\)  


  • \(x+2x=12\ \ \Rightarrow\ \ x=4\ \text{cm} \)
♦♦♦ Mean mark 18%.

Filed Under: Electrostatics Tagged With: Band 6, smc-4283-10-Electric fields

PHYSICS, M1 2012 HSC 21

  1. Outline a first-hand investigation that could be performed to measure a value for acceleration due to gravity.   (3 marks)

    --- 8 WORK AREA LINES (style=lined) ---

  2. How would you assess the accuracy of the result of the investigation?   (1 mark)

    --- 2 WORK AREA LINES (style=lined) ---

  3. How would you increase the reliability of the data collected?   (1 mark)

    --- 2 WORK AREA LINES (style=lined) ---

  4. How would you assess the reliability of the data collected?   (1 mark)

    --- 2 WORK AREA LINES (style=lined) ---

Show Only

a.    Timing of a falling mass.

  • Set up an electronic and automatic timing system with sensors to detect the presence of a small falling metal ball.
  • Heights for the ball should be set up between 0.2 m to 1 m with intervals every 0.2 m. To increase the reliability of the results, multiple trials should be conducted at each height and the average falling time for each height should be calculated which can then be used to graph the data.
  • The results should be plotted on a graph of height vs time\(^2\). This uses the equation  \(s=ut +\dfrac{1}{2}at^2\)  where  \(u=0\)  which becomes  \(s=\dfrac{1}{2}at^2\).
  • After plotting the data, the acceleration due to gravity, \(a\), can be calculated using  \(a=\dfrac{2s}{t^2}\), which will make it equal to 2 × the gradient of the line of best fit.

b.    Assessing accuracy of results:

  • Look up known value on a reliable website (e.g. National Measurement Institute).
  • Ensure the value is for the location of the experiment (it can differ slightly).
  • Compare the known value to the value determined experimentally and the closer they are, the greater the accuracy of the experiment.

c.    Increasing data reliability:

  • Conduct multiple trials at each height.
  • Use the average of the calculations as stated in the method above.

d.   Assessing data reliability:

  • Compare the values obtained at a single height.
  • If there is a large variation in the calculations conducted at the same height, the data collected is less reliable.

Show Worked Solution

a.    Timing of a falling mass.

  • Set up an electronic and automatic timing system with sensors to detect the presence of a small falling metal ball.
  • Heights for the ball should be set up between 0.2 m to 1 m with intervals every 0.2 m. To increase the reliability of the results, multiple trials should be conducted at each height and the average falling time for each height should be calculated which can then be used to graph the data.
  • The results should be plotted on a graph of height vs time\(^2\). This uses the equation  \(s=ut +\dfrac{1}{2}at^2\)  where  \(u=0\)  which becomes  \(s=\dfrac{1}{2}at^2\).
  • After plotting the data, the acceleration due to gravity, \(a\), can be calculated using  \(a=\dfrac{2s}{t^2}\), which will make it equal to 2 × the gradient of the line of best fit.
♦ Mean mark (a) 55%.

b.    Assessing accuracy of results:

  • Look up known value on a reliable website (e.g. National Measurement Institute).
  • Ensure the value is for the location of the experiment (it can differ slightly).
  • Compare the known value to the value determined experimentally and the closer they are, the greater the accuracy of the experiment.
♦♦♦ Mean mark (b) 26%.

c.    Increasing data reliability:

  • Conduct multiple trials at each height.
  • Use the average of the calculations as stated in the method above.

d.   Assessing data reliability:

  • Compare the values obtained at a single height.
  • If there is a large variation in the calculations conducted at the same height, the data collected is less reliable.
♦♦♦ Mean mark (d) 7%.

Filed Under: Motion in a Straight Line Tagged With: Band 3, Band 5, Band 6, smc-4273-30-Acceleration

Complex Numbers, EXT2 N1 2023 HSC 7 MC

Which of the following statements about complex numbers is true?

  1. For all real numbers \(x, y, \theta\)  with  \(x \neq 0\),

\(\tan \theta=\dfrac{y}{x} \ \Rightarrow \ x+i y=r e^{i \theta}\), for some real number \(r\).

  1. For all non-zero complex numbers \(z_1\) and \(z_2\),

\(\operatorname{Arg}\left(z_1\right)=\theta_1\)  and  \(\operatorname{Arg}\left(z_2\right)=\theta_2 \ \Rightarrow \ \operatorname{Arg}\left(z_1 z_2\right)=\theta_1+\theta_2,\)

where \(\operatorname{Arg}\) denotes the principal argument.

  1. For all real numbers \(r_1, r_2, \theta_1, \theta_2\)  with  \(r_1, r_2>0\),

\(r_1 e^{i \theta_1}=r_2 e^{i \theta_2} \ \Rightarrow \ r_1=r_2\)  and  \(\theta_1=\theta_2 \text {. }\)

  1. For all real numbers \(x, y, r, \theta\)  with  \(r>0\)  and  \(x \neq 0\),

\(x+i y=r e^{i \theta} \ \Rightarrow \ \theta=\arctan  \Big(\dfrac{y}{x} \Big)\)

Show Answers Only

\(A\)

Show Worked Solution

\(\text{Eliminating options by contradiction}\)

\(\text{Option}\ B:\)

\(\text{If}\ \ \theta_1= \pi\ \ \text{and}\ \ \theta_2=\dfrac{\pi}{2}, \ \theta_1 + \theta_2 = \dfrac{3\pi}{2} > \pi \)

\( -\pi < \operatorname{Arg}\left(z_1 z_2\right) < \pi\ \ \ \  \text{(Eliminate}\ B) \)

♦♦♦ Mean mark 18%.

\(\text{Option}\ C:\)

\(\text{If}\ \ \theta_1= \pi\ \ \text{and}\ \ \theta_2=3\pi, \ \operatorname{Arg}(e^{i\pi}) =  \operatorname{Arg}(e^{3i\pi}) \)

\( \text{However,}\ \ \theta_1 \neq \theta_2\ \ \ \  \text{(Eliminate}\ C) \)
 

\(\text{Option}\ D:\)

\(\text{If}\ \ x=y=-1, \ \theta=-\dfrac{3\pi}{4} \ \ (r>0) \)

\( \text{However,}\ \ \arctan\Big(\dfrac{-1}{-1}\Big)=\dfrac{\pi}{4} \ \ \  \text{(Eliminate}\ D) \)

\(\Rightarrow A\)

Filed Under: Argand Diagrams and Mod/Arg form, Exponential Form Tagged With: Band 6, smc-1049-40-Mod/Arg arithmetic, smc-1191-70-Other

PHYSICS, M4 2017 HSC 8 MC

An electron is fired in a vacuum towards a screen. With no electric field being applied, the electron hits the screen at \(P\). A uniform electric field is turned on and another electron is fired towards the screen from the same location, at the same velocity, striking the screen at point \(Q\).

With the electric field still turned on, a proton is fired towards the screen from the same starting point as the electrons and with the same velocity.

At what point does the proton strike the screen?

  1. \(A\)
  2. \(B\)
  3. \(C\)
  4. \(D\)
Show Answers Only

\(C\)

Show Worked Solution
  • As the proton has an equal but opposite charge to the electron it will experience a force in the opposite direction. Hence it will hit the screen to the right of \(P\).
  • Due to the proton having a greater mass, it will be deflected by a smaller amount and so will hit the screen at \(C\).

\(\Rightarrow C\)

♦♦♦ Mean mark 25%.

Filed Under: Electrostatics Tagged With: Band 6, smc-4283-30-Forces on charges

CHEMISTRY, M8 2023 HSC 36

An organic reaction pathway involving compounds \(\text{A, B,}\) and \(\text{C}\) is shown in the flow chart.
 

The molar mass of \(\text{A}\) is 84.156 g mol\(^{-1}\).

A chemist obtained some spectral data for the compounds as shown.
 

\( \text{Data from} \ ^{1} \text{H NMR spectrum of compound C} \)
 \( Chemical \ Shift \ \text{(ppm)} \) \( Relative \ peak \ area \) \( Splitting \ pattern \)
\(1.01\) \(3\) \(\text{Triplet}\)
\(1.05\) \(3\) \(\text{Triplet}\)
\(1.65\) \(2\) \(\text{Multiplet}\)
\(2.42\) \(2\) \(\text{Triplet}\)
\(2.46\) \(2\) \(\text{Quartet}\)
\( ^{1} \text{H NMR chemical shift data}\)
\( Type \ of \ proton \)  \(  \text{δ/ppm} \)
\( \ce{R - C\textbf{H}3,R - C\textbf{H}2 - R}\) \(0.7-1.7\)
\( \left.\begin{array}{l}\ce{\textbf{H}3C - CO - \\-C\textbf{H}2 - CO -}\end{array}\right\} \begin{aligned} & \text { (aldehydes, ketones,} \\ &\text{carboxylic acids or esters) }\end{aligned}\) \(2.0-2.6\) 
\( \ce{R - C\textbf{H}O} \) \(9.4-10.00\)
\( \ce{R - COO\textbf{H}} \) \(9.0-13.0\)
 

Identify the functional group present in each of compounds \(\text{A}\) to \(\text{C}\) and draw the structure of each compound. Justify your answer with reference to the information provided.  (9 marks) 

--- 28 WORK AREA LINES (style=lined) ---

Show Answers Only

Compound \(\text{A}\): Alkene


Compound \(\text{B}\): Secondary alcohol

Compound \(\text{C}\): Ketone


Reasoning as follows:

  • Compound \(\text{A}\) is able to undergo an addition reaction to add water across a \(\ce{C=C}\) bond  \(\Rightarrow \)  Alkene
  • Compound \(\text{B}\) is the product of the above hydration reaction and is therefore an alcohol.
  • The \(\ce{^{13}C\ NMR}\) spectrum of Compound \(\text{A}\) confirms it is an alkene (132 ppm peak corresponding to the \(\ce{C=C}\) atoms). 3 spectrum peaks indicate 3 carbon environments. The molar mass of compound \(\text{A}\) is 84.156 g mol\(^{-1}\) which suggests symmetry within the molecule.
  • The Infrared Spectrum of Compound \(\text{B}\) has a broad peak at approximately 3400 cm\(^{-1}\). This indicates the presence of an hydroxyl group and confirms \(\text{B}\) is an alcohol.
  • Compound \(\text{C}\) is produced by the oxidation of Compound \(\text{B}\) with acidified potassium permanganate.
  • Compound \(\text{C}\) is a carboxylic acid if \(\text{B}\) is a primary alcohol or a ketone if \(\text{B}\) is a secondary alcohol.
  • Since the \(\ce{^{1}H NMR}\) spectrum of \(\text{C}\) does not show any peaks between 9.0 − 13.0 ppm, it cannot be a carboxylic acid. Compound \(\text{C}\) is therefore a ketone and Compound \(\text{B}\) is a secondary alcohol.
  • The \(\ce{^{1}H NMR}\) spectrum shows 5 peaks \(\Rightarrow \) 5 hydrogen environments.
  • Chemical shift and splitting patterns information indicate:
  • 1.01 ppm – 1.05 ppm: \(\ce{CH3}\) (next to a \(\ce{CH2}\))
  •   1.65 ppm: \(\ce{CH2}\) (with multiple neighbouring hydrogens)
  •   2.42 ppm: \(\ce{CH2}\) (next to the ketone \(\ce{C=O}\) and a \(\ce{CH2}\))
  •   2.46 ppm: \(\ce{CH2}\) (next to the ketone \(\ce{C=O}\) and a \(\ce{CH3}\))
Show Worked Solution

Compound \(\text{A}\): Alkene


Compound \(\text{B}\): Secondary alcohol

Compound \(\text{C}\): Ketone


Reasoning as follows:

  • Compound \(\text{A}\) is able to undergo an addition reaction to add water across a \(\ce{C=C}\) bond  \(\Rightarrow \)  Alkene
  • Compound \(\text{B}\) is the product of the above hydration reaction and is therefore an alcohol.
  • The \(\ce{^{13}C\ NMR}\) spectrum of Compound \(\text{A}\) confirms it is an alkene (132 ppm peak corresponding to the \(\ce{C=C}\) atoms). 3 spectrum peaks indicate 3 carbon environments. The molar mass of compound \(\text{A}\) is 84.156 g mol\(^{-1}\) which suggests symmetry within the molecule.
  • The Infrared Spectrum of Compound \(\text{B}\) has a broad peak at approximately 3400 cm\(^{-1}\). This indicates the presence of an hydroxyl group and confirms \(\text{B}\) is an alcohol.
  • Compound \(\text{C}\) is produced by the oxidation of Compound \(\text{B}\) with acidified potassium permanganate.
  • Compound \(\text{C}\) is a carboxylic acid if \(\text{B}\) is a primary alcohol or a ketone if \(\text{B}\) is a secondary alcohol.
  • Since the \(\ce{^{1}H NMR}\) spectrum of \(\text{C}\) does not show any peaks between 9.0 − 13.0 ppm, it cannot be a carboxylic acid. Compound \(\text{C}\) is therefore a ketone and Compound \(\text{B}\) is a secondary alcohol.
  • The \(\ce{^{1}H NMR}\) spectrum shows 5 peaks \(\Rightarrow \) 5 hydrogen environments.
  • Chemical shift and splitting patterns information indicate:
  • 1.01 ppm – 1.05 ppm: \(\ce{CH3}\) (next to a \(\ce{CH2}\))
  •   1.65 ppm: \(\ce{CH2}\) (with multiple neighbouring hydrogens)
  •   2.42 ppm: \(\ce{CH2}\) (next to the ketone \(\ce{C=O}\) and a \(\ce{CH2}\))
  •   2.46 ppm: \(\ce{CH2}\) (next to the ketone \(\ce{C=O}\) and a \(\ce{CH3}\))

Filed Under: Organic Substances Tagged With: Band 4, Band 5, Band 6, smc-3683-10-C NMR, smc-3683-20-H NMR, smc-3683-50-Combining Techniques, smc-3683-55-C=C Bonds, smc-3683-60-Hydroxyl Group, smc-3683-70-Carboxylic Acid Group

PHYSICS, M8 2023 HSC 20 MC

In 1995 , observational evidence showed that Hubble's description of the expansion of the universe was inaccurate.

It was discovered that the expansion of the universe was accelerating. This discovery was based on observations of light from galaxies whose distances from Earth could be accurately measured, and were significantly more distant than any observed by Hubble.

Which graph relating velocities of galaxies to their distances from Earth is consistent with an accelerating rate of expansion of the universe?


Show Answers Only

\(D\)

Show Worked Solution
  • Light from the most distant galaxies has taken the longest time to reach the Earth and so distance can also be regarded as a measure of time.
  • The light from these galaxies was around when the acceleration of the universe was smaller than it is today.
  • Hence, it is expected that the gradient of the graph at large distances from Earth will be flatter as the acceleration of the universe was smaller.
  • Light coming from galaxies closer to the Earth is younger and so the closer the distance a galaxy is from Earth, the steeper the curve. 
  • The difference in velocities between galaxies closer to the Earth is greater due to the accelerating rate of the universe.

\(\Rightarrow D\)

♦♦♦ Mean mark 11%.

Filed Under: Origins of Elements Tagged With: Band 6, smc-3700-30-Hubble

PHYSICS, M8 2023 HSC 33

Consider the following statement.

The interaction of subatomic particles with fields, as well as with other types of particles and matter, has increased our understanding of processes that occur in the physical world and of the properties of the subatomic particles themselves.

Justify this statement with reference to observations that have been made and experiments that scientists have carried out.   (9 marks)

--- 22 WORK AREA LINES (style=lined) ---

Show Answers Only

Thomson’s Experiment:

  • Thomson’s experiment tested the interaction of cathode rays (which he discovered were negatively charged subatomic particles and named them electrons) with electric and magnetic fields to determine the charge to mass ratio (\(\dfrac{q}{m}\)) of the electrons.
  • Using both the electric and magnetic fields, Thomson balanced the forces to ensure the cathode rays travelled through undeflected. Thus:
  •    \(F_E = F_B \ \ \Rightarrow \ \ qE=qvB \ \ \Rightarrow \ \ v=\dfrac{E}{B}\)
  • Using the magnetic field and known velocity, the cathode rays travelled in a circular path due to their negative charges interacting with the magnetic field. Thus:
  •    \(F_c=F_B\ \ \Rightarrow \ \ \dfrac{mv^2}{r}=qvB \ \ \Rightarrow \ \ \dfrac{q}{m}=\dfrac{v}{Br}\)
  • The charge to mass ratio was determined to be 0.77 \(\times\) 10\(^{11}\) Ckg\(^{-1}\) and was \(\dfrac{1}{1800}\) times smaller than the charge to mass ratio of the proton. The number was also the same regardless of the metal cathode used, thus Thomson determined this particle was a fundamental constitute of all matter. 
  • Therefore, the statement is true as the observations and experiment undertaken by Thomson using the interactions of particles and fields led to a greater understanding of the electrons. 

Chadwick’s Experiment:

  • In Chadwick’s experiment, he irradiated beryllium with alpha particles which emitted a deeply penetrating radiation with neutral charge. When this particle was directed into paraffin wax, protons were emitted and detected on a screen. 
  • Using the Laws of conservation of energy and momentum, Chadwick proposed the idea of a neutral particle and named it the neutron. He determined that the mass of this particle must be slightly greater than the mass of the proton.
  • Therefore, Chadwick’s observations of the neutrons led to a greater understanding of the properties of the particle, thus justifying the statement above.  

Observations using particle accelerators:

  • Particle accelerators have led to many new scientific discoveries as a result of the interaction of particles with fields and particle-particle interactions.
  • Scientists have come to a greater understanding of quarks and other subatomic particles within the standard model of matter and processes of the physical world including decay trails and momentum dilation.
  • The Large Hadron Collider (LHC) can accelerate particles close to the speed of light using electric and magnetic fields. When particles collide, the kinetic energy is converted into mass using Einstein’s equation  \(E=mc^2\).
  • The new particles formed as a result of these collisions led to the development of the standard model and increased scientific understanding of subatomic particles including up and down quarks, W/Z bosons and the Higgs Boson.
  • These subatomic particles have very short lifetimes before decaying into more stable particles. Our knowledge of them is primarily from studying their decay properties which has led to a greater understanding of particle decay trails.
  • Observations of interactions within particles accelerators has also increased the scientific understanding of momentum dilation. As particles reach relativistic speeds, a greater force is required to accelerate them than classical physics predicts which is due to mass and momentum dilation. 

Other Answers could include:

  • Millikan’s Oil drop experiment.
  • The photoelectric effect.
  • Geiger Marsden experiment.
  • Davisson Germer experiment.
  • Observations of Muons.
Show Worked Solution

One (of many) exemplar responses.

Thomson’s Experiment:

  • Thomson’s experiment tested the interaction of cathode rays (which he discovered were negatively charged subatomic particles and named them electrons) with electric and magnetic fields to determine the charge to mass ratio (\(\dfrac{q}{m}\)) of the electrons.
  • Using both the electric and magnetic fields, Thomson balanced the forces to ensure the cathode rays travelled through undeflected. Thus:
  •    \(F_E = F_B \ \ \Rightarrow \ \ qE=qvB \ \ \Rightarrow \ \ v=\dfrac{E}{B}\)
  • Using the magnetic field and known velocity, the cathode rays travelled in a circular path due to their negative charges interacting with the magnetic field. Thus:
  •    \(F_c=F_B\ \ \Rightarrow \ \ \dfrac{mv^2}{r}=qvB \ \ \Rightarrow \ \ \dfrac{q}{m}=\dfrac{v}{Br}\)
  • The charge to mass ratio was determined to be 0.77 \(\times\) 10\(^{11}\) Ckg\(^{-1}\) and was \(\dfrac{1}{1800}\) times smaller than the charge to mass ratio of the proton. The number was also the same regardless of the metal cathode used, thus Thomson determined this particle was a fundamental constitute of all matter. 
  • Therefore, the statement is true as the observations and experiment undertaken by Thomson using the interactions of particles and fields led to a greater understanding of the electrons.

Chadwick’s Experiment:

  • In Chadwick’s experiment, he irradiated beryllium with alpha particles which emitted a deeply penetrating radiation with neutral charge. When this particle was directed into paraffin wax, protons were emitted and detected on a screen. 
  • Using the Laws of conservation of energy and momentum, Chadwick proposed the idea of a neutral particle and named it the neutron. He determined that the mass of this particle must be slightly greater than the mass of the proton.
  • Therefore, Chadwick’s observations of the neutrons led to a greater understanding of the properties of the particle, thus justifying the statement above.  

Observations using particle accelerators:

  • Particle accelerators have led to many new scientific discoveries as a result of the interaction of particles with fields and particle-particle interactions.
  • Scientists have come to a greater understanding of quarks and other subatomic particles within the standard model of matter and processes of the physical world including decay trails and momentum dilation.
  • The Large Hadron Collider (LHC) can accelerate particles close to the speed of light using electric and magnetic fields. When particles collide, the kinetic energy is converted into mass using Einstein’s equation  \(E=mc^2\).
  • The new particles formed as a result of these collisions led to the development of the standard model and increased scientific understanding of subatomic particles including up and down quarks, W/Z bosons and the Higgs Boson.
  • These subatomic particles have very short lifetimes before decaying into more stable particles. Our knowledge of them is primarily from studying their decay properties which has led to a greater understanding of particle decay trails.
  • Observations of interactions within particles accelerators has also increased the scientific understanding of momentum dilation. As particles reach relativistic speeds, a greater force is required to accelerate them than classical physics predicts which is due to mass and momentum dilation. 

Other Answers could include:

  • Millikan’s Oil drop experiment.
  • The photoelectric effect.
  • Geiger Marsden experiment.
  • Davisson Germer experiment.
  • Observations of Muons.
♦♦ Mean mark 45%.

Filed Under: Deep Inside the Atom, Quantum Mechanical Nature of the Atom, Structure of the Atom Tagged With: Band 5, Band 6, smc-3701-10-Cathode Rays and Thomson, smc-3701-20-Millikan, smc-3701-60-Chadwick, smc-3702-40-De Broglie, smc-3704-10-Standard Model, smc-3704-25-Linear Accelerator

CHEMISTRY, M5 2023 HSC 37

When performing industrial reductions with \(\mathrm{CO}(\mathrm{g})\), the following equilibrium is of great importance.

\( \ce{2CO(g) \rightleftharpoons CO2(g) + C(s) \quad \quad $K$_{e q}  = 10.00  at 1095 K } \)

A 1.00 L sealed vessel at a temperature of 1095 K contains \( \ce{CO(g)} \) at a concentration of 1.10 × 10\(^{-2}\) mol L\(^{-1}\), \(\ce{CO2(g)} \) at a concentration of 1.21 × 10\(^{-3}\) mol L\(^{-1}\), and excess solid carbon.

  1. Is the system at equilibrium? Support your answer with calculations.   (2 marks)

--- 3 WORK AREA LINES (style=lined) ---

  1. Carbon dioxide gas is added to the system above and the mixture comes to equilibrium. The equilibrium concentrations of \( \ce{CO(g)}\) and \(\ce{CO2(g)} \) are equal. Excess solid carbon is present and the temperature remains at 1095 K.

    Calculate the amount (in mol) of carbon dioxide added to the system.   (3 marks)

--- 14 WORK AREA LINES (style=lined) ---

Show Answers Only

a.    \(Q=\dfrac{\ce{[CO2]}}{\ce{[CO]^2}}=\dfrac{1.21 \times 10^{-3}}{(1.10 \times 10^{-2})^2}=10.0\)

\(\text{Since}\ \ Q=K_{eq},\ \text{system is in equilibrium.}\)
 

b.    \(0.143\ \text{mol} \)

Show Worked Solution

a.    \(Q=\dfrac{\ce{[CO2]}}{\ce{[CO]^2}}=\dfrac{1.21 \times 10^{-3}}{(1.10 \times 10^{-2})^2}=10.0\)

\(\text{Since}\ \ Q=K_{eq},\ \text{system is in equilibrium.}\)
 

b.    \(\ce{\text{Given}\ \ [CO]=[CO2]}, \)

\(K_{eq} =\dfrac{\ce{[CO2]}}{\ce{[CO]^2}} =\dfrac{1}{\ce{[CO]}} = 10.00\)

\(\Rightarrow \ce{[CO] = \dfrac{1}{10.00} = 0.1000 \text{mol L}^{-1}} \)

\(\Rightarrow \ce{[CO2] = 0.1000 \text{mol L}^{-1}} \)

From this point, the change in \(\ce{CO}\) and \(\ce{CO2}\) concentrations can be calculated…

♦♦♦ Mean mark (b) 24%.

\begin{array} {|l|c|c|c|}
\hline  & \ce{2CO(g)} & \ce{CO2(g)} & \ce{C(s)} \\
\hline \text{Initial} & 1.10 \times 10^{-2} &  1.21 \times 10^{-3} &  \\
\hline \text{Change} & +0.0890 & +0.0988 &  \\
\hline \text{Equilibrium} & \ \ \ 0.1000 & \ \ \ 0.1000 &  \\
\hline \end{array}

However, the change in moles of \(\ce{CO2}\) in the system consists of:

  • Change in \(\ce{CO2}\) concentration
  • Change in \(\ce{CO}\) concentration (as some of the added \(\ce{CO2}\) was converted into \(\ce{CO}\))

\(\ce{n(CO2)\ \text{required to increase}\ [CO] by 0.0988\ \text{mol}\ \ \ \text{(1 litre vessel)}}\)

\(\ce{\text{Formula ratio shows}\ \ CO2:CO = 1\ \text{mol} : 2\ \text{mol}} \)

\(\ce{n(CO2)\ \text{to add to increase}\ [CO2] = 0.0988\ \text{mol}\ \ \ \text{(1 litre vessel)}}\)

\(\ce{n(CO2)_{\text{total to add}} = 0.0988\ \text{mol} + n(CO2\ \text{to make CO)}} \)

\(\ce{n(CO2)\ \text{to add to increase}\ [CO] = \dfrac{0.0890}{2} = 0.0445\ \text{mol}}\)

\(\ce{n(CO2)_{\text{total to add}} = 0.0988 + 0.0445 = 0.143\ \text{mol}} \)

Filed Under: Equilibrium Constant Tagged With: Band 4, Band 6, smc-3671-20-Calcs given K(eq), smc-3671-35-Chemical equation given

PHYSICS, M5 2023 HSC 32

A horizontal disc rotates at 3 revolutions per second around its centre, with the top of the disc at ground level.

At 2 m from the centre of the disc, a ball is held in place at ground level on the top of the disc by a spring-loaded projectile launcher. At position \(X\), the launcher fires the ball vertically upward with a velocity of 5.72 m s\(^{-1}\).


Calculate the ball's position relative to the launcher's new position, at the instant the ball hits the ground.   (7 marks)

--- 14 WORK AREA LINES (style=lined) ---

Show Answers Only

The position of the ball relative to the launcher’s new position is 44.19 m, 5.2\(^{\circ}\) below the horizontal line of the launcher.

Show Worked Solution

Find horizontal velocity of the ball, \(v_{\text{x}}\):

\(T=\dfrac{1}{3} = 0.333\ \text{seconds} \)

\(v_{\text{x}}=\dfrac{2\pi r}{T}=\dfrac{2\pi \times 2}{0.333…}=37.699\ \text{ms}^{-1}\)

♦ Mean mark 53%.

Calculating the time of flight, \(t_1\):

Let  \(t_2\) = time to max height

\(v_{\text{y}}\) \(=u_{\text{y}} + at_2\)  
\(t_2\) \(=\dfrac{v_{\text{y}}-u_{\text{y}}}{a}=\dfrac{0-5.72}{-9.8}=0.58367\ \text{sec} \)  


Time of flight (\(t_1)= 2 \times t_2= 1.167\ \text{s}\)
 

Range of the ball from launch position:

\(s_{\text{x}}=v_{\text{x}} \times t_2=37.699 \times 1.167=44.0\ \text{m}\)
 

Position of the launcher (L) when the ball hits the ground:

  • Revolutions (before ball lands) = 3 × 1.167 = 3.5 revolutions
  • The Launcher (L) is \(\frac{1}{2}\) a revolution past its starting point.
  • Thus, the positions of both the ball and the launcher at the time when the ball hits the ground can be demonstrated in the diagram below.


\(D\) \(=\sqrt{44.0^2+4^2}=44.18\ \text{m}\)  
\(\theta\) \(=\tan ^{-1}\left(\dfrac{4}{44.0}\right)=5.2^{\circ}\)  


  • The final position of the ball relative to \(L\) is 44.18 m, 5.2\(^{\circ}\) below the horizontal line at \(L\).

Filed Under: Circular Motion, Projectile Motion Tagged With: Band 5, Band 6, smc-3690-25-Range, smc-3690-35-Initial Velocity, smc-3690-45-Time of Flight, smc-3691-20-Applications of Circular Motion

PHYSICS, M6 2023 HSC 31

A roller coaster uses a braking system represented by the diagrams.
 

When the roller coaster car reaches the end of the ride, the two rows of permanent magnets on the car pass on either side of a thick aluminium conductor called a braking fin.

The graph shows the acceleration of the roller coaster reaching the braking fin at two different speeds.


Explain the similarities and differences between these two sets of data.   (5 marks)

--- 15 WORK AREA LINES (style=lined) ---

Show Answers Only

Similarities:

  • Both graphs show peak negative acceleration at 0.8 seconds.
  • Acceleration curves converge at 3-4 seconds as both cars stop simultaneously.
  • The braking fin passing through permanent magnets experiences flux change, inducing EMF (Faraday’s Law).
  • This EMF creates eddy currents that oppose motion (Lenz’s Law), causing negative acceleration
  • After peak deceleration, magnetic braking effects decrease as slower speeds reduce flux change and eddy current magnitude.
  • Kinetic energy continuously converts to electrical resistive heating through eddy currents.

Differences:

  • The cart with \(u = 12\ \text{ms}^{-1}\). experiences greater negative acceleration than the cart where \(u = 10\ \text{ms}^{-1}\).
  • Higher initial velocity causes greater flux change rate in the braking fin.
  • This produces stronger induced EMF and larger eddy currents.
  • Since repulsive force is proportional to eddy current strength, the faster cart experiences greater deceleration.

Show Worked Solution

Similarities:

  • Both graphs show peak negative acceleration at 0.8 seconds.
  • Acceleration curves converge at 3-4 seconds as both cars stop simultaneously.
  • The braking fin passing through permanent magnets experiences flux change, inducing EMF (Faraday’s Law).
  • This EMF creates eddy currents that oppose motion (Lenz’s Law), causing negative acceleration
  • After peak deceleration, magnetic braking effects decrease as slower speeds reduce flux change and eddy current magnitude.
  • Kinetic energy continuously converts to electrical resistive heating through eddy currents.

Differences:

  • The cart with \(u = 12\ \text{ms}^{-1}\). experiences greater negative acceleration than the cart where \(u = 10\ \text{ms}^{-1}\).
  • Higher initial velocity causes greater flux change rate in the braking fin.
  • This produces stronger induced EMF and larger eddy currents.
  • Since repulsive force is proportional to eddy current strength, the faster cart experiences greater deceleration.

Filed Under: Applications of the Motor Effect Tagged With: Band 5, Band 6, smc-3695-70-Magnetic Breaking

BIOLOGY, M7 2023 HSC 6 MC

Liver fluke is a disease caused by parasites that infect grazing animals, including sheep. The life cycle of the liver fluke is shown.


How could the transmission of this disease to humans be prevented?

  1. Eradicating the snails
  2. Administering antibiotics to sheep
  3. Wearing gloves when handling sheep
  4. Regularly spraying fields with herbicides
Show Answers Only

\(A\)

Show Worked Solution
  • Option \(A\) will serve as an effective option which will interrupt the lifecycle of liver fluke and hence prevent it’s transmission to humans.

\(\Rightarrow A\)

♦♦♦ Mean mark 26%.

Filed Under: Prevention, Treatment and Control Tagged With: Band 6, smc-3658-30-Procedures to Prevent Spread

Vectors, EXT2 V1 2023 HSC 15c

A curve \( \mathcal{C}\) spirals 3 times around the sphere centred at the origin and with radius 3, as shown.

A particle is initially at the point \((0,0,-3)\) and moves along the curve \(\mathcal{C}\) on the surface of the sphere, ending at the point \((0,0,3)\).
 

By using the diagram below, which shows the graphs of the functions  \(f(x)=\cos (\pi x)\)  and  \(g(x)=\sqrt{9-x^2}\), and considering the graph  \(y=f(x)g(x)\), give a possible set of parametric equations that describe the curve \( \mathcal{C}\).  (3 marks)
 

--- 6 WORK AREA LINES (style=lined) ---

Show Answers Only

\(x= \cos{(\pi t)}\sqrt{9-t^2} \)

\(y= -\sin{(\pi t)}\sqrt{9-t^2} \)

\( z=t \)

Show Worked Solution

\(\text{Since the curve lies on a sphere with radius 3:}\)

\(x^2+y^2+z^2=3^3 \)

\(\text{Considering the graph}\ \ y=\cos (\pi t)\sqrt{9-t^2}\ \ \text{(as per hint)} \)

\(\Big(\cos (\pi t)\sqrt{9-t^2}\Big)^2+\Big(\sin (\pi t)\sqrt{9-t^2}\Big)^2+t^2=3^2 \ \ …\ (1) \)

\(\text{Since}\ z\ \text{increases and}\ x\ \text{and}\ y\ \text{change signs} \)

\( \Rightarrow z=t \)
 

\(\text{In order to satisfy the equation in (1): } \)

\( x,y\ \text{must be one of }\ \ \pm \cos{(\pi t)}\sqrt{9-t^2}\ \ \text{or}\ \ \pm \sin{(\pi t)}\sqrt{9-t^2} \)
 

\(\text{At}\ \ z=0,\ t=0, \ x=3\ \ \text{(from graph):} \)

\( \Rightarrow x= \cos{(\pi t)}\sqrt{9-t^2} \)
 

\(\text{At}\ \ z=0+\epsilon,\ t=0+\epsilon, \ y \lt 0\ \ \text{(from graph):} \)

\( \Rightarrow y= -\sin{(\pi t)}\sqrt{9-t^2} \)

♦♦♦ Mean mark 22%.

Filed Under: Vectors and Geometry Tagged With: Band 6, smc-1210-50-Circle/Sphere, smc-1210-85-Parametric

Measurement, STD1 M5 2023 HSC 31

A scale drawing of a garden plan, where 1 cm represents 2 m, is shown.

The shaded areas in the diagram represent the garden beds.
 

Woodchips will be laid as a mulch on the garden beds to a depth of \(10 cm\).

What is the volume of woodchips required?  (5 marks)

Show Only

\(10.113\ \text{m}^3\)

Show Worked Solution

\(\text{Scale }\longrightarrow 1\ \text{cm}=2\ \text{m}\)
 

\(\text{Area of triangle}\) \(=\dfrac{1}{2}\times 8\times 4\)
  \(=16\ \text{m}^2\)


\(\text{Area of L-shape}\) \(=2\times 10+2\times 20\)
  \(=60\ \text{m}^2\)


\(\text{Area of semi-cirle}\) \(=\dfrac{1}{2}\times \pi\times 4^2\)
  \(=25.13\dots\ \text{m}^2\)


\(\text{Total Area}\) \(=16+60+25.13\)
  \(=101.13\ \text{m}^2\)


\(\text{Volume}\) \(=101.13\times 0.1\)
  \(=10.113\ \text{m}^3\)

♦♦♦♦ Mean mark 15%.

Filed Under: M5 Scale Drawings (Y12) Tagged With: Band 6, smc-1105-20-Maps and Scale Drawings

Measurement, STD1 M3 2023 HSC 29

The diagram shows the location of three places \(X\), \(Y\) and \(C\).

\(Y\) is on a bearing of 120° and 15 km from \(X\).

\(C\) is 40 km from \(X\) and lies due west of \(Y\).

\(P\) lies on the line joining \(C\) and \(Y\) and is due south of \(X\).
  

  1. Find the distance from \(X\) to \(P\).  (2 marks)

    --- 4 WORK AREA LINES (style=lined) ---

  2. What is the bearing of \(C\) from \(X\), to the nearest degree?  (2 marks)

    --- 5 WORK AREA LINES (style=lined) ---

Show Answers Only
  1. \(7.5\ \text{km}\)
  2. \(259^{\circ}\)
Show Worked Solution

a.    \(\text{In}\ \Delta XPY:\)

\(\angle PXY=180-120=60^{\circ}\)

\(\cos 60^{\circ}\) \(=\dfrac{XP}{15}\)  
\(XP\) \(=15\times \cos 60^{\circ}\)  
  \(=7.5\ \text{km}\)  

♦♦ Mean mark (a) 24%.

b.    \(\text{In}\ \Delta XPC:\)

\(\text{Let}\ \theta = \angle CXP\)

\(\cos \theta\) \(=\dfrac{7.5}{40}\)  
\(\theta\) \(=\cos^{-1} \Big(\dfrac{7.5}{40}\Big)\)  
  \(=79.193…\)  
  \(=79^{\circ}\ \text{(nearest degree)}\)  


\(\text{Bearing}\ C\ \text{from}\ X\) \(=180+79\)  
  \(=259^{\circ}\)  

♦♦♦♦ Mean mark (b) 9%.

Filed Under: M3 Right-Angled Triangles (Y12) Tagged With: Band 5, Band 6, smc-1103-20-Right-angled Trig, smc-1103-60-Bearings, std2-std1-common

Vectors, EXT1 V1 2023 HSC 14c

  1. Given a non-zero vector  \(\left(\begin{array}{l}p \\ q\end{array}\right)\),  it is known that the vector  \(\left(\begin{array}{c}q \\ -p\end{array}\right)\) is perpendicular to  \(\left(\begin{array}{l}p \\ q\end{array}\right)\)  and has the same magnitude. (Do NOT prove this.)
  2. Points \(A\) and \(B\) have position vectors  \(\overrightarrow{O A}=\left(\begin{array}{l}a_1 \\ a_2\end{array}\right)\)  and  \(\overrightarrow{O B}=\left(\begin{array}{l}b_1 \\ b_2\end{array}\right)\), respectively.
  3. Using the given information, or otherwise, show that the area of triangle  \(O A B\)  is  \(\dfrac{1}{2}\left|a_1 b_2-a_2 b_1\right|\).  (3 marks)

    --- 8 WORK AREA LINES (style=lined) ---

  4. The point \(P\) lies on the circle centred at  \(I(r, 0)\)  with radius  \(r>0\),  such that  \(\overrightarrow{I P}\)  makes an angle of \(t\) to the horizontal.

  5. The point \(Q\) lies on the circle centred at  \(J(-R, 0)\)  with radius  \(R>0\),  such that  \(\overrightarrow{J Q}\)  makes an angle of \(2 t\) to the horizontal.

  1. Note that  \(\overrightarrow{O P}=\overrightarrow{O I}+\overrightarrow{I P}\)  and  \(\overrightarrow{O Q}=\overrightarrow{O J}+\overrightarrow{J Q}\).
  2. Using part (i), or otherwise, find the values of \(t\), where  \(-\pi \leq t \leq \pi\), that maximise the area of triangle \(O P Q\).  (4 marks)

    --- 10 WORK AREA LINES (style=lined) ---

Show Answers Only

  1. \(\text{See Worked Solutions}\)
  2. \(t=\dfrac{\pi}{3}, \ – \dfrac{\pi}{3} \)

Show Worked Solution

i.   
     

♦♦♦ Mean mark (i) 18%.
\(\Big{|}\text{proj}_{\overrightarrow{OA^{′}}} \overrightarrow{OB} \Big{|}\) \(=\ \text{⊥ height of}\ \triangle OAB\ \text{from side}\ \overrightarrow{OA} \)  
  \(= \Bigg{|} \dfrac{\overrightarrow{OB} \cdot \overrightarrow{OA^{′}}}{|\overrightarrow{OA^{′}}|} \Bigg{|} \)  
  \(= \Bigg{|} \dfrac{b_1a_2-b_2a_1}{|\overrightarrow{OA^{′}}|} \Bigg{|} \)  


\(\text{Area}\ \triangle AOB\) \(=\dfrac{1}{2} \Bigg{|} \dfrac{b_1a_2-b_2a_1}{|\overrightarrow{OA^{′}}|} \Bigg{|} \cdot |\overrightarrow{OA} | \)  
  \(=\dfrac{1}{2}\left|a_1 b_2-a_2 b_1\right|\ \ \ (\text{noting}\ \ |\overrightarrow{OA} |=|\overrightarrow{OA^{′}} |) \)  


ii.    \(\overrightarrow{OP}\) \(=\overrightarrow{OI}+\overrightarrow{IP}\)
    \(= \left(\begin{array}{l}r \\ 0\end{array}\right) + \left(\begin{array}{c} r\ \cos \ t \\ r\ \sin \ t\end{array}\right) \)
    \(= \left(\begin{array}{c} r(1+ \cos \ t) \\ r\ \sin \ t\end{array}\right) \)
♦♦♦ Mean mark (ii) 8%.
\(\overrightarrow{OQ}\) \(=\overrightarrow{OJ}+\overrightarrow{JQ}\)
  \(= \left(\begin{array}{c} -R \\ 0 \end{array}\right) + \left(\begin{array}{l} R\ \cos\ 2t \\ R\ \sin\ 2t\end{array}\right) \)
  \(= \left(\begin{array}{c} R(\cos\ 2t-1) \\ R\ \sin\ 2t\end{array}\right) \)

 
\(\text{Using part (i):}\)

\(A_{\triangle OPQ}\)

\(=\dfrac{1}{2} \big{|} r(1+\cos\ t) \cdot R \sin\ 2t-r\ \sin\ t\ \cdot R(\cos\ 2t-1)\ \big{|} \)

 
  \(=\dfrac{rR}{2} \big{|} \sin\ 2t+\cos\ t\ \sin\ 2t-\sin\ t\ \cos\ 2t+\sin\ t\ \big{|} \)  
  \(=\dfrac{rR}{2} \big{|} \sin\ 2t+\sin\ t\ + \sin(2t-t) \big{|} \)  
  \(=\dfrac{rR}{2} \big{|} 2\sin\ t\ \cos\ t +2\sin\ t \big{|} \)  
  \(= rR \big{|} \sin\ t(\cos\ t+1) \big{|} \)  

 
\(\text{Let}\ \ f(t)=\sin\ t(\cos\ t+1) \)

\(f^{′}(t) \) \(=\cos\ t(\cos\ t+1)+\sin\ t(-\sin\ t) \)  
  \(=\cos^{2}t+\cos\ t-\sin^{2}t\)  
  \(=\cos^{2}t+\cos\ t-(1-\cos^{2}t) \)  
  \(=2\cos^{2}t+\cos\ t-1 \)  
  \(=(2\cos^{2}t-1)(\cos\ t+1) \)  

 
\(\text{SP’s when}\ \ f^{′}(t)=0:\)

\(\cos\ t\) \(=\dfrac{1}{2} \) \(\cos\ t\) \(=-1\)
\(t\) \(=\dfrac{\pi}{3}, \ – \dfrac{\pi}{3} \) \(t\) \(=\pi, \ -\pi \)

 
\(\text{Testing SP’s:}\)

\(f(\pi) = f(- \pi) = 0\)

\(\therefore A_{\triangle AOB}\ \text{is maximum when}\ \ t=\dfrac{\pi}{3}, \ – \dfrac{\pi}{3} \)

Filed Under: Vectors and Geometry (Ext1) Tagged With: Band 6, smc-1211-10-Triangle, smc-1211-70-Projections

Combinatorics, EXT1 A1 2023 HSC 10 MC

A group with 5 students and 3 teachers is to be arranged in a circle.

In how many ways can this be done if no more than 2 students can sit together?

  1. \(4 ! \times 3!\)
  2. \(5 ! \times 3!\)
  3. \(2 ! \times 5 ! \times 3!\)
  4. \(2 ! \times 2 ! \times 2 ! \times 3!\)
Show Answers Only

\(B\)

Show Worked Solution

\(\text{Fix 1st teacher in a seat}\)

\(\text{Split remaining 5 students into 3 groups (2 × 2 students and 1 × 1 student)}\)
 

\(\text{Combinations of other teachers = 2! }\)

\(\text{Combinations of students within groups = 5! }\)

\(\text{Combinations of student groups between teachers = 3 }\)

\(\therefore\ \text{Total combinations}\ = 2! \times 5! \times 3 = 3! \times 5! \)

\(\Rightarrow B\)

♦♦♦ Mean mark 13%.

Filed Under: Permutations and Combinations (Ext1) Tagged With: Band 6, smc-1082-30-Combinations in a Circle

Functions, EXT1 F2 2023 HSC 14b

Consider the hyperbola  \(y=\dfrac{1}{x}\)  and the circle  \((x-c)^2+y^2=c^2\), where \(c\) is a constant.

  1. Show that the \(x\)-coordinates of any points of intersection of the hyperbola and circle are zeros of the polynomial  \(P(x)=x^4-2 c x^3+1\).  (1 mark)

    --- 4 WORK AREA LINES (style=lined) ---

  2. The graphs of  \(y=x^4-2 c x^3+1\)  for  \(c=0.8\)  and  \(c=1\) are shown.
     

  1. By considering the given graphs, or otherwise, find the exact value of  \(c>0\)  such that the hyperbola  \(y=\dfrac{1}{x}\)  and the circle  \((x-c)^2+y^2=c^2\)  intersect at only one point.  (3 marks)

    --- 10 WORK AREA LINES (style=lined) ---

Show Answers Only

  1. \(\text{See Worked Solutions}\)
  2. \(\sqrt[4]{\dfrac{16}{27}}\approx 0.877\)

Show Worked Solution

i.     \(y=\dfrac{1}{x}\ …\ (1) \)

\((x-c)^2+y^2=c^2\ …\ (2) \)

\(\text{Substitute (1) into (2):}\)

\((x-c)^2+\Big{(}\dfrac{1}{x}\Big{)}^2 \) \(=c^2\)  
\(x^2-2cx+c^2+\dfrac{1}{x^2}\) \(=c^2\)  
\(x^4-2cx^3+1\) \(=0\)  
Mean mark (i) 53%.

ii.    \(\text{The two graphs show that for some value of}\ \ 0.8 \leq c \leq 1,\)

\(P(x)\ \text{has a minimum that touches the}\ x\text{-axis once.}\)

\(P(x)\) \(=x^4-2cx^3+1\)  
\(P^{′}(x)\) \(=4x^3-6cx^2\)  

 
\(\text{Find}\ x\ \text{when}\ P^{′}(x)=0: \)

\(4x^3-6cx^2\) \(=0\)  
\(2x^2(2x-3c)\) \(=0\)  
\(x\) \(=\dfrac{3c}{2}\ \ (x \neq 0)\)  

 
\(\text{Find}\ c\ \text{when}\ P(\frac{3c}{2})=0: \)

\(\Big{(} \dfrac{3c}{2} \Big{)}^4-2c\Big{(} \dfrac{3c}{2} \Big{)}^3+1 \) \(=0\)  
\(\dfrac{81c^4}{16}-\dfrac{54c^4}{8}+1\) \(=0\)  
\(\dfrac{(108-81)c^4}{16}\) \(=1\)  
\(\dfrac{27c^4}{16}\) \(=1\)  
\(c^4\) \(=\dfrac{16}{27}\)  
\(c\) \(=\sqrt[4]{\dfrac{16}{27}} \)  
  \(\approx 0.877\)  
Mean mark (ii) 19%.

Filed Under: Sum, Products and Multiplicity of Roots (Ext1) Tagged With: Band 4, Band 6, smc-1205-20-Multiplicity of Roots, smc-1205-30-Other

Calculus, EXT1 C3 2023 HSC 13a

A hemispherical water tank has radius \(R\) cm. The tank has a hole at the bottom which allows water to drain out.

Initially the tank is empty. Water is poured into the tank at a constant rate of  \(2 k R\) cm³ s\(^{-1}\), where \(k\) is a positive constant.

After \(t\) seconds, the height of the water in the tank is \(h\) cm, as shown in the diagram, and the volume of water in the tank is \(V\) cm³.
  

It is known that  \(V= \pi \Big{(} R h^2-\dfrac{h^3}{3}\Big{)}. \)    (Do NOT prove this.)

While water flows into the tank and also drains out of the bottom, the rate of change of the volume of water in the tank is given by  \(\dfrac{d V}{d t}=k(2 R-h)\).

  1. Show that  \(\dfrac{d h}{d t}=\dfrac{k}{\pi h}\).  (2 marks)

    --- 5 WORK AREA LINES (style=lined) ---

  2. Show that the tank is full of water after  \(T=\dfrac{\pi R^2}{2 k}\) seconds.  (2 marks)

    --- 6 WORK AREA LINES (style=lined) ---

  3. The instant the tank is full, water stops flowing into the tank, but it continues to drain out of the hole at the bottom as before.
  4. Show that the tank takes 3 times as long to empty as it did to fill.  (3 marks)

    --- 9 WORK AREA LINES (style=lined) ---

Show Answers Only
  1. \(\text{See Worked Solutions}\)
  2. \(\text{See Worked Solutions}\)
  3. \(\text{See Worked Solutions}\)
Show Worked Solution

i.    \(V=\pi \Big{(}Rh^2-\dfrac{h^3}{3} \Big{)} \)

\(\dfrac{dV}{dh} = \pi(2Rh-h^2) \)

\(\dfrac{dV}{dt} = k(2R-h)\ \ \ \text{(given)} \)

\(\dfrac{dh}{dt}\) \(= \dfrac{dV}{dt} \cdot \dfrac{dh}{dV} \)  
  \(=k(2R-h) \cdot \dfrac{1}{\pi} \cdot \dfrac{1}{h(2R-h)} \)  
  \(= \dfrac{k}{\pi h} \)  

 
ii.
    \(\dfrac{dt}{dh} = \dfrac{\pi h}{k} \)

\(t\) \(= \displaystyle \int \dfrac{dt}{dh}\ dh \)  
  \(= \dfrac{\pi}{k} \displaystyle \int h\ dh \)  
  \(= \dfrac{\pi}{k} \Big{[} \dfrac{h^2}{2} \Big{]} +c \)  

 
\(\text{When}\ \ t=0, h=0 \)

\(\Rightarrow c=0 \)

\( t= \dfrac{\pi h^2}{2k} \)

 
\(\text{Tank is full at time}\ T\ \text{when}\ \ h=R: \)

\( T= \dfrac{\pi R^2}{2k}\ \text{seconds} \)

♦ Mean mark (ii) 41%.

iii.   \(\text{Net water flow}\ = k(2R-h)\ \ \text{(given)} \)

\(\text{Flow in}\ =2kR\ \ \text{(given)} \)

\(\text{Flow out}\ = k(2R-h)-2kR=-kh \)
 

\( \dfrac{dh}{dt}= \dfrac{-kh}{\pi h(2R-h)} = \dfrac{-k}{\pi (2R-h)} \)

♦♦♦ Mean mark (iii) 20%.
 

\(\dfrac{dt}{dh}\) \(=\dfrac{- \pi (2R-h)}{k} \)  
\( \displaystyle \int k\ dt\) \(=- \pi \displaystyle \int (2R-h)\ dh \)  
\(kt\) \(=- \pi \Big{(} 2Rh-\dfrac{h^2}{2} \Big{)}+c \)  

 
\(\text{When}\ \ t=0, \ h=R: \)

\(0\) \(=- \pi \Big{(}2R^2-\dfrac{R^2}{2} \Big{)} + c\)  
\(c\) \(= \pi \Big{(} \dfrac{3R^2}{2} \Big{)} \)  

 
\(\text{Find}\ t\ \text{when}\ h=0: \)

\(kt\) \(=- \pi(0) + \pi \dfrac{3R^2}{2} \)  
\(t\) \(= \dfrac{3 \pi R^2}{2k} \)  
  \(= 3 \times \dfrac{\pi R^2}{2k} \)  

 
\(\therefore\ \text{Tank takes 3 times longer to empty than fill.} \)

Filed Under: Applications of Differential Equations, Related Rates of Change (Ext1) Tagged With: Band 3, Band 5, Band 6, smc-1079-10-Volume, smc-1198-45-Flow in/out

Statistics, STD1 S1 2023 HSC 20

Consider the following dataset.

22, 27, 29, 32, 36, 37, 39, 45, 47, 58

Is 58 an outlier in this dataset? Justify your answer with working.  (3 marks)

--- 6 WORK AREA LINES (style=lined) ---

Show Answers Only

\(\text{Median}=\dfrac{36+37}{2}=36.5\)

\(Q_1=29\ \ \text{and}\ \ Q_3=45\)

\(IQR=Q_3-Q_1=45-29=16\)

\(Q_3+1.5\times IQR=45+1.5\times 16=69\)

\(\therefore\ \text{58 is not an outlier (58 < 69).}\)

Show Worked Solution

\(\text{Median}=\dfrac{36+37}{2}=36.5\)

\(Q_1=29\ \ \text{and}\ \ Q_3=45\)

\(IQR=Q_3-Q_1=45-29=16\)

\(Q_3+1.5\times IQR=45+1.5\times 16=69\)

\(\therefore\ \text{58 is not an outlier (58 < 69).}\)


♦♦♦ Mean mark 17%.

Filed Under: Summary Statistics (Std 1) Tagged With: Band 6, smc-1131-30-IQR and Outliers

Networks, STD1 N1 2023 HSC 18

A network of running tracks connects the points \(A, B, C, D, E, F, G, H\), as shown. The number on each edge represents the time, in minutes, that a typical runner should take to run along each track.


  1. Which path could a typical runner take to run from point \(A\) to point \(D\) in the shortest time?  (2 marks)

    --- 4 WORK AREA LINES (style=lined) ---

  2. A spanning tree of the network above is shown.
     

  1. Is it a minimum spanning tree? Give a reason for your answer.  (2 marks)

    --- 4 WORK AREA LINES (style=lined) ---

Show Answers Only

a.    \(ABFGD\)

b.    \(\text{See worked solutions}\)

Show Worked Solution

a.    \(\text{Using Djikstra’s Algorithm:}\)
 

\(\text{Shortest route}\) \(=ABFGD\)  
  \(=3+1+5+5\)  
  \(=14\)  

 
b.
  \(\text{Total time of given spanning tree}\)

\(=3+11+1+2+4+5+5\)

\(=31\)
 

\(\text{Consider the MST below:}\)
 

\(\text{Total time (MST)}= 3+1+2+4+5+5+9=29\)

\(\therefore \text{ Given tree is NOT a MST.}\)

♦♦ Mean mark (b) 21%.

Filed Under: Minimum Spanning Trees, Shortest Paths Tagged With: Band 3, Band 6, smc-1137-10-Network Diagram, smc-1138-40-Draw Tree

Statistics, STD1 S1 2023 HSC 13

The graph shows the frequency of scores out of 10 awarded to a museum by visitors.
 

  1. What is the mode of these data?  (1 mark)

    --- 2 WORK AREA LINES (style=lined) ---

  2. Describe TWO features of this graph.  (2 marks)

    --- 5 WORK AREA LINES (style=lined) ---

Show Answers Only

a.    \(\text{Mode = Score with the highest frequency}=9\)
 

b.    \(\text{Features could include any 2 of the following:}\)

  • \(\text{Data is negatively skewed as the mean and median are to the left of the mode}\)
  • \(\text{23 of the 24 scores, or 95.8%, are 5 or above.}\)
  • \(Q_2\text{(Median)}=8\)
  • \(Q_1=7\text{ and }Q_3=9\)
  • \(IQR=Q_1-Q_3=9-7=2\)
  • \(Q_1-1.5\times IQR=7-1.5\times 2=4\ \ \Rightarrow \ \ \text{1 is an outlier}\)
  • \(\text{Mean}=\dfrac{189}{24}=7.875\)
  • \(\text{If the outlier (1) was removed, Mean}=\dfrac{188}{23}=8.174\text{ (2 d.p.)}\)

Show Worked Solution

a.    \(\text{Mode = Score with the highest frequency}=9\)
 

b.    \(\text{Features could include any 2 of the following:}\)

  • \(\text{Data is negatively skewed as the mean and median are to the left of the mode}\)
  • \(\text{23 of the 24 scores, or 95.8%, are 5 or above.}\)
  • \(Q_2\text{(Median)}=8\)
  • \(Q_1=7\text{ and }Q_3=9\)
  • \(IQR=Q_1-Q_3=9-7=2\)
  • \(Q_1-1.5\times IQR=7-1.5\times 2=4\ \ \Rightarrow \ \ \text{1 is an outlier}\)
  • \(\text{Mean}=\dfrac{189}{24}=7.875\)
  • \(\text{If the outlier (1) was removed, Mean}=\dfrac{188}{23}=8.174\text{ (2 d.p.)}\)

♦ Mean mark (a) 47%.
♦♦♦ Mean mark (b) 18%.

Filed Under: Bar Charts, Histograms and Other Graphs (Std 1), Summary Statistics (Std 1) Tagged With: Band 5, Band 6, smc-1128-10-Bar Charts, smc-1128-15-Histograms, smc-1131-10-Mean, smc-1131-20-Median and Mode

Statistics, STD1 S1 2023 HSC 11

A company employs 50 people.

The annual income of the employees is shown in the grouped frequency distribution table.

\begin{array} {|c|c|c|c|}
\hline
\textit{Annual income} & \textit{Class centre} & \textit{Number of} & fx \\ \text{(\$)} & (x) & \textit{employees}\ (f) &  \\
\hline
\rule{0pt}{2.5ex} \text{40 000 – 49 999} \rule[-1ex]{0pt}{0pt} & 45\ 000 & 12 & 540\ 000 \\
\hline
\rule{0pt}{2.5ex} \text{50 000 – 59 999} \rule[-1ex]{0pt}{0pt} & 55\ 000 & 13 & 715\ 000 \\
\hline\rule{0pt}{2.5ex} \text{60 000 – 69 999} \rule[-1ex]{0pt}{0pt} & 65\ 000 & 15 & A \\
\hline\rule{0pt}{2.5ex} \text{70 000 – 79 999} \rule[-1ex]{0pt}{0pt} & 75\ 000 & 7 & 525\ 000 \\
\hline\rule{0pt}{2.5ex} \text{80 000 – 89 999} \rule[-1ex]{0pt}{0pt} & 85\ 000 & 3 & 255\ 000 \\
\hline
\hline\rule{0pt}{2.5ex}  \rule[-1ex]{0pt}{0pt} &  & \textit{Total}\ = 50 & \textit{Total = B} \\
\hline
\end{array}  

  1. What are the values of \(A\) and \(B\)?  (2 marks)

    --- 4 WORK AREA LINES (style=lined) ---

  2. Find the mean for this distribution.  (1 mark)

    --- 2 WORK AREA LINES (style=lined) ---

Show Answers Only

a.    \(A=$975\ 000\), \(B=$3\ 010\ 000\)

b.    \($60\ 200\)

Show Worked Solution

a.    \(A=65\ 000\times 15 = $975\ 000\)

\(B=540\ 000+715\ 000+975\ 000+525\ 000+255\ 000=$3\ 010\ 000\)


b.    \(\text{Mean}=\dfrac{\text{Total }fx}{\text{Total }f}=\dfrac{3\ 010\ 000}{50}=$60\ 200\)

♦♦♦ Mean mark (b) 12%.

Filed Under: Summary Statistics (Std 1) Tagged With: Band 3, Band 6, smc-1131-10-Mean, smc-1131-40-Class Centres, smc-1131-60-Frequency Tables

Financial Maths, STD1 F1 2023 HSC 7 MC

An item was purchased for a price of \($880\), including \(10\%\) GST.

What is the amount of GST included in the price?

  1. \($8.00\)
  2. \($8.80\)
  3. \($80.00\)
  4. \($88.00\)
Show Answers Only

\(C\)

Show Worked Solution

\(\text{Let}\ C =\text{Original cost}\)

\(C+0.1 \times C\) \(=880\)  
\(1.1C\) \(=880\)  
\(C\) \(=\dfrac{880}{1.1}\)  
  \(=$800\)  

 
\(\therefore \text{GST}=800\times 0.1=$80\)

\(\Rightarrow C\)

♦ Mean mark 15%.

Filed Under: Tax and Percentage Increase/Decrease (Std 1) Tagged With: Band 6, smc-1125-20-GST, std2-std1-common

Functions, 2ADV F1 2023 HSC 10 MC

The graph  \(y = x^2\)  meets the line  \(y = k\)  (where \(k>0\)) at points \(P\) and \(Q\) as shown in the diagram. The length of the interval \(PQ\) is \(L\).
 

Let \(a\) be a positive number. The graph  \(y=\dfrac{x^2}{a^2}\)  meets the line  \(y=k\)  at points \(S\) and \(T\).

What is the length of \(ST\)?

  1. \(\dfrac{L}{a}\)
  2. \(\dfrac{L}{a^2}\)
  3. \(aL\)
  4. \(a^2L\)
Show Answers Only

\(C\)

Show Worked Solution

\(\text{Intersection of}\ \ y=x^2\ \ \text{and}\ \ y=k:\)

\(x^2=k\ \ \Rightarrow\ \ x=\pm \sqrt k\)

\(\therefore L=2\sqrt k\)

\(\text{Intersection of}\ \ y=\dfrac{x^2}{a^2}\ \ \text{and}\ \ y=k:\)

\(\dfrac{x^2}{a^2} \) \(=k\)  
\(x^2\) \(=a^2k\)  
\(x\) \(=\pm a\sqrt k\)  

\(\therefore ST=a \times 2\sqrt k = aL \)

\(\Rightarrow C\)

♦♦♦ Mean mark 24%.

Filed Under: Quadratics and Cubic Functions (Adv-2027), Quadratics and Cubic Functions (Y11) Tagged With: Band 6, smc-6215-10-Quadratics, smc-6215-60-Intersections, smc-984-10-Quadratics

Calculus, 2ADV C4 2023 HSC 32

The curves  \(y=e^{-2 x}\)  and  \(y=e^{-x}-\dfrac{1}{4}\)  intersect at exactly one point as shown in the diagram. The point of intersection has coordinates \(\left(\ln 2, \dfrac{1}{4}\right)\). (Do NOT prove this.)
 

  1. Show that the area bounded by the two curves and the \(y\)-axis, as shaded in the diagram, is  \(\dfrac{1}{4} \ln 2-\dfrac{1}{8}\).  (3 marks)

    --- 7 WORK AREA LINES (style=lined) ---

  2. Find the values of \(k\) such that the curves  \(y=e^{-2 x}\)  and  \(y=e^{-x}+k\)  intersect at two points.  (3 marks)

    --- 8 WORK AREA LINES (style=lined) ---

Show Answers Only

a.    \(\text{See Worked Solutions}\)

b.    \( -\dfrac{1}{4} < k < 0 \)

Show Worked Solution

a.     \(A\) \(= \int_0^{\ln2} e^{-2x}-(e^{-x}-\dfrac{1}{4})\ dx\)
    \(=\Big{[}-\dfrac{1}{2} e^{-2x}+e^{-x}+\dfrac{1}{4}x \Big{]}_0^{\ln2} \)
    \(=\Big{[}(-\dfrac{1}{2} e^{-2\ln2}+e^{-\ln2}+\dfrac{1}{4}\ln2)-(-\dfrac{1}{2}e^0+e^0-0)\Big{]} \)
    \(=\Big{[}(-\dfrac{1}{2} e^{\ln{(2^{-2})}}+e^{\ln{(2^{-1})}}+\dfrac{1}{4}\ln2+\dfrac{1}{2}-1)\Big{]} \)
    \(=\Big{[}(-\dfrac{1}{2} e^{\ln \frac{1}{4}}+e^{\ln \frac{1}{2}}+\dfrac{1}{4}\ln2-\dfrac{1}{2}\Big{]} \)
    \(=-\dfrac{1}{2} \times \dfrac{1}{4} +\dfrac{1}{2}+\dfrac{1}{4}\ln2-\dfrac{1}{2} \)
    \(=\dfrac{1}{4}\ln2-\dfrac{1}{8} \)

 
b.
    \(\text{Intersection occurs when}\)

\(e^{-2x}\) \(=e^{-x}+k\)  
\(e^{-2x}-e^{-x}-k\) \(=0\)  

 
\(\text{Let}\ X=e^{-x} \)

\(X^2-X-k=0 \)

\(X\) \(=\dfrac{1\pm \sqrt{1^2-4(1)(-k)}}{2} \)  
  \(=\dfrac{1\pm \sqrt{1+4k}}{2} \)  


\(\text{2 solutions}\ \Rightarrow\ \Delta >0 \)

\(1+4k>0\ \ \Rightarrow \ k>-\dfrac{1}{4} \)
 

\(\text{Since}\ X=e^{-x} >0:\)

\(\Rightarrow\ \text{Both real solutions to the quadratic MUST be positive.}\)

\(\sqrt{1+4k}\) \(<1\)  
\(1+4k\) \(<1\)  
\(k\) \(<0\)  

 
\(\therefore\ -\dfrac{1}{4} < k < 0 \)

♦♦♦ Mean mark (b) 14%.

Filed Under: Areas Under Curves (Y12) Tagged With: Band 4, Band 6, smc-975-40-Exponential

Probability, 2ADV S1 2023 HSC 31

Four Year 12 students want to organise a graduation party. All four students have the same probability, \(P(F)\), of being available next Friday. All four students have the same probability, \(P(S)\), of being available next Saturday.

It is given that  \(P(F)=\dfrac{3}{10}, P(S\mid F)=\dfrac{1}{3}\), and \(P(F\mid S)=\dfrac{1}{8}\).

Kim is one of the four students.

  1. Is Kim's availability next Friday independent from his availability next Saturday? Justify your answer.  (1 mark)

    --- 2 WORK AREA LINES (style=lined) ---

  2. Show that the probability that Kim is available next Saturday is \(\dfrac{4}{5}\).  (2 marks)

    --- 5 WORK AREA LINES (style=lined) ---

  3. What is the probability that at least one of the four students is NOT available next Saturday?  (2 marks)

    --- 3 WORK AREA LINES (style=lined) ---

Show Answers Only

a.    \(P(F) \neq P(F|S)\ \text{which is not the case}\ \ (\dfrac{3}{10} \neq \dfrac{1}{8}) \)

\(\therefore\ \text{Kim’s availability on Friday is not independent of Saturday}\)

b.    \(\text{See Worked Solutions} \)

c.    \(\dfrac{369}{625} \)

Show Worked Solution

a.    \(P(F) \neq P(F|S)\ \text{which is not the case}\ \ (\dfrac{3}{10} \neq \dfrac{1}{8}) \)

\(\therefore\ \text{Kim’s availability on Friday is not independent of Saturday}\)

♦♦♦ Mean mark (a) 18%.
b.     \(P(S|F) \) \(= \dfrac{P(S) \cap P(F)}{P(F)} \)
  \(\dfrac{1}{3}\) \(= \dfrac{P(S) \cap P(F)}{\frac{3}{10}} \)
  \(\dfrac{1}{10}\) \(=P(S) \cap P(F) \)
♦ Mean mark (b) 44%.
\(P(F|S)\)  \(= \dfrac{P(F) \cap P(S)}{P(S)} \)  
\(\dfrac{1}{8}\) \(=\dfrac{\frac{1}{10}}{P(S)} \)  
\(\dfrac{1}{8} \times P(S) \) \(=\dfrac{1}{10} \)  
\(P(S)\) \(=\dfrac{4}{5} \)  


c.     \(P\text{(at least 1 not available)}\) \(=1-P\text{(all are available)} \)
    \(=1-\left(\dfrac{4}{5}\right)^4 \)
    \(=\dfrac{369}{625} \)
♦♦ Mean mark (c) 34%.

Filed Under: Conditional Probability and Venn Diagrams (Adv-2027), Conditional Probability and Venn Diagrams (Y11) Tagged With: Band 5, Band 6, smc-6470-10-Conditional Prob Formula, smc-6470-30-Independent Events, smc-991-10-Conditional Prob Formula, smc-991-30-Independent Events

Statistics, 2ADV S3 2023 HSC 29

A continuous random variable \(X\) has probability density function \(f(x)\) given by
 

\(f(x)=\left\{\begin{array}{cl} 12 x^2(1-x), & \text { for } 0 \leq x \leq 1 \\ 0, & \text { for all other values of } x \end{array}\right.\)


  1. Find the mode of \(X\).  (2 marks)

    --- 6 WORK AREA LINES (style=lined) ---

  2. Find the cumulative distribution function for the given probability density function.  (2 marks)

    --- 6 WORK AREA LINES (style=lined) ---

  3. Without calculating the median, show that the mode is greater than the median.  (2 marks)

    --- 5 WORK AREA LINES (style=lined) ---

Show Answers Only

a.   \(x=\dfrac{2}{3} \)

b.   \(F(x)=\left\{\begin{array}{cl} 0, & \text { for } x \lt 0 & \\ 4x^3-3x^4, & \text { for } 0 \leq x \leq 1 \\ 1, & \text { for } x > 1 \end{array}\right.\)

c.    \(\text{See Worked Solutions}\)

Show Worked Solution

a.    \(\text{Mode}\ \rightarrow \ f(x)_\text{max} \)

\(f(x)=12 x^2(1-x)=12x^2-12x^3 \)

\(f^{′}(x)=24x-36x^2=12x(2-3x) \)

\(f^{″}(x)=24-72x \)

♦ Mean mark (a) 45%.

\(\text{Max/min when}\ f^{′}(x)=0 \)

\(2-3x=0\ \ ⇒\ \ x=\dfrac{2}{3} \ \ (x \neq 0) \)

\(\text{At}\ x=\dfrac{2}{3}, \ f^{″}(x)=24-72(\dfrac{2}{3})=-24<0 \)

\(\therefore \ \text{Mode (max) at}\ x=\dfrac{2}{3} \)
  

b.     \(F(x)\) \(= \int 12x^2-12x^3\ dx\)
    \(=4x^3-3x^4+c \)

 
\(\text{At}\ x=0, F(x)=0\ \ ⇒\ \ c=0 \)

\(F(x)=4x^3-3x^4 \)
 

\(F(x)=\left\{\begin{array}{cl} 0, & \text { for } x \lt 0 & \\ 4x^3-3x^4, & \text { for } 0 \leq x \leq 1 \\ 1, & \text { for } x > 1 \end{array}\right.\)

 
c.
    \(\text{Find}\ F\Big{(}\dfrac{2}{3}\Big{)}: \)

\(F\Big{(}\dfrac{2}{3}\Big{)} \) \(=4 \times \Big{(}\dfrac{2}{3}\Big{)}^3-3 \times \Big{(}\dfrac{2}{3}\Big{)}^4 \)  
  \(=\dfrac{16}{27}>0.5 \)  

 
\(\therefore\ \text{Mode > median}\)

♦♦♦ Mean mark (c) 17%.

Filed Under: Probability Density Functions (Y12) Tagged With: Band 4, Band 5, Band 6, smc-994-10-Median, smc-994-20-Mode, smc-994-40-Cumulative Distribution Fn, smc-994-60-Polynomial PDF

Functions, 2ADV F2 2023 HSC 27

The graph of  \(y=f(x)\), where  \(f(x)=a|x-b|+c\), passes through the points \((3,-5), (6,7)\) and \((9,-5)\) as shown in the diagram.
 

  1. Find the values of  \(a, b\) and \(c\).  (3 marks)

    --- 6 WORK AREA LINES (style=lined) ---

  2. The line  \(y=m x\)  cuts the graph of  \(y=f(x)\)  in two distinct places.
  3. Find all possible values of \(m\).  (2 marks)

    --- 5 WORK AREA LINES (style=lined) ---

Show Answers Only

a.    \(\ a=-4\) , \(\ b=6\) , \(\ c=7\)

b.   \( \text{2 solutions when}\ \ -4<m<7/6 \)

Show Worked Solution

a.    \(\text{Consider the transformation of}\ \ y=-|x|\)

\(\text{Translate 6 units to the right}\)

\(y=-|x|\ \ \rightarrow\ \ y=-|x-6| \)

\(\therefore b=6\)
 

\(\text{Translate 7 units vertically up}\)

\(y=-|x-6|\ \ \rightarrow\ \ y=-|x-6|+7 \)

\(\therefore c=7\)
 

\(f(x)=a|x-6|+7\ \ \text{passes through}\ (3, -5):\)

\(-5\) \(=a|3-6|+7\)  
\(-5\) \(=3a+7\)  
\(3a\) \(=-12\)  
\(\therefore a\) \(=-4\)  

 
b.
    \(y=mx\ \ \text{passes through (0, 0)}\)

\( \text{One solution when}\ \ y=mx\ \ \text{passes through (0, 0) and (6, 7)}\)

\(m=\dfrac{7-0}{6-0}=\dfrac{7}{6}\)

\(\text{As graph gets flatter and turns negative ⇒ 2 solutions}\)
 

\(\text{2 solutions continue until}\ \ y=mx\ \ \text{is parallel to}\)

\(\text{the line joining (6, 7) to}\ (9,-5),\ \text{where}: \)

\(m=\dfrac{7-(-5)}{6-9}=-\dfrac{12}{3}=-4 \)
 

\(\therefore \ \text{2 solutions when}\ \ -4<m< \dfrac{7}{6} \)

♦♦♦ Mean mark (b) 23%.

Filed Under: Graph Transformations (Adv-2027), Transformations (Y12) Tagged With: Band 4, Band 6, smc-1008-20-Absolute Value, smc-1008-70-Combinations, smc-6408-15-Absolute Value, smc-6408-60-Combinations

Functions, 2ADV F1 2023 HSC 9 MC

Let \(f(x)\) be any function with domain all real numbers.

Which of the following is an even function, regardless of the choice of \(f(x)\)?

  1. \(2 f(x)\)
  2. \(f(f(x))\)
  3. \((f(-x))^2\)
  4. \(f(x) f(-x)\)
Show Answers Only

\(D\)

Show Worked Solution

\(\text{Even function}\ \rightarrow \ f(x)=f(-x)\)

\(\text{Consider the function}\ \ f(x) = x-2\)

\( 2f(1)=-2,\ \ 2f(-1)=-6\ \ \text{(not even)}\)

\( f(f(1))=f(-1)=-3,\ \ f(f(-1))=f(-3)=-5\ \ \text{(not even)}\)

\( (f(-1))^2=(-3)^2=9,\ \ (f(1))^2=(-1)^2=1\ \ \text{(not even)}\)

\( f(1)f(-1)=-1 \times -3=3,\ \ f(-1)f(1)=-3 \times -1=3 \ \text{(possibly even)}\)

\(=>D\)

♦♦♦ Mean mark 24%.

Filed Under: Further Functions and Relations (Y11), Quadratics and Cubic Functions (Adv-2027) Tagged With: Band 6, smc-6215-75-Odd/Even Functions, smc-987-70-Odd/even functions

Statistics, STD2 S4 2023 HSC 34

A university uses gas to heat its buildings. Over a period of 10 weekdays during winter, the gas used each day was measured in megawatts (MW) and the average outside temperature each day was recorded in degrees Celsius (°C).

Using `x` as the average daily outside temperature and `y` as the total daily gas usage, the equation of the least-squares regression line was found.

The equation of the regression line predicts that when the temperature is 0°C, the daily gas usage is 236 MW.

The ten temperatures measured were: 0°, 0°, 0°, 2°, 5°, 7°, 8°, 9°, 9°, 10°,

The total gas usage for the ten weekdays was 1840 MW.

In any bivariate dataset, the least-squares regression line passes through the point `(bar x,bar y)`, where `bar x` is the sample mean of the `x`-values and `bary` is the sample mean of the `y`-values.

  1. Using the information provided, plot the point `(bar x,bar y)` and the `y`-intercept of the least-squares regression line on the grid.  (3 marks)


  1. What is the equation of the regression line?  (2 marks)

    --- 4 WORK AREA LINES (style=lined) ---

  2. In the context of the dataset, identify ONE problem with using the regression line to predict gas usage when the average outside temperature is 23°C.  (1 mark)

    --- 2 WORK AREA LINES (style=lined) ---

Show Answers Only

a.    
         

b.    `y=-10.4x+236`

c.    `text{Answers could include one of the following:}`

`text{→ 23°C is outside the range of the dataset and requires the trend}`

`text{to be extrapolated.}`

`text{→ At 23°C, the equation predicts negative daily gas usage.}`

Show Worked Solution

a.    `barx=(0+0+0+2+5+7+8+9+9+10)/10=5^@text{C}`

`bary=1840/10=184`

`text{Regression line passes through:}\ (0,236) and (5,184)`
 

♦ Mean mark (a) 44%.

b.    `m=(y_2-y_1)/(x_2-x_1)=(184-236)/(5-0)=-10.4`

`text{Equation of line}\ m=-10.4\ text{passing through}\ (0,236):`

`(y-y_1)` `=m(x-x_1)`  
`y-236` `=-10.4(x-0)`  
`y` `=-10.4x+236`  
♦♦♦ Mean mark (b) 21%.

 
c.
    `text{Answers could include one of the following:}`

`text{→ 23°C is outside the range of the dataset and requires the trend}`

`text{to be extrapolated.}`

`text{→ At 23°C, the equation predicts negative daily gas usage.}`

♦♦♦ Mean mark 23%.

Filed Under: S4 Bivariate Data Analysis (Y12) Tagged With: 2adv-std2-common, Band 5, Band 6, smc-785-20-Least-Squares Regression Line

Financial Maths, STD2 F4 2023 HSC 29

The table shows monthly repayments for each $1000 borrowed.
 

  1. A couple borrows $520 000 to buy a house at 8% per annum over 25 years.
  2. How much does the couple repay in total for this loan?  (3 marks)

    --- 7 WORK AREA LINES (style=lined) ---

  3. Chris borrows some money at 7% per annum. Chris will repay the loan over 15 years, paying $3596 per month.
  4. How much money does Chris borrow?  (1 mark)

    --- 3 WORK AREA LINES (style=lined) ---

Show Answers Only
  1. `$1\ 204\ 320`
  2. `400\ 000`
Show Worked Solution

a.    `text{8.0% interest over a 25 year loan}`

`text{Monthly repayments to borrow $1000 = $7.72}`

`text{Total months}\ = 25 xx 12 = 300`

`text{Monthly repayments}` `=520 xx 7.72`  
  `=$4014.40`  


`:.\ text{Total repayments}` `= 4014.40 xx 300`  
  `=$1\ 204\ 320`  
♦ Mean mark (a) 50%.

 
b.
    `text{7.0% interest over a 15 year loan}`

`text{Monthly repayments to borrow $1000 = $8.99}`

`:.\ text{Amount borrowed}` `=3596/8.99 xx $1000`  
  `=400\ 000`  
♦♦♦ Mean mark (b) 11%.

Filed Under: Loans and Credit Cards (Std 2) Tagged With: Band 5, Band 6, smc-814-30-Other Loan Tables

Measurement, STD2 M1 2023 HSC 9 MC

The length and width of a rectangle are measured to be 8 cm and 5 cm respectively, to the nearest centimetre.

What are the lower and upper bounds for the area of the rectangle?

  1. `text{28 cm}^2\ text{and 54 cm}^2`
  2. `text{36 cm}^2\ text{and 42 cm}^2`
  3. `text{38.25 cm}^2\ text{and 41.25 cm}^2`
  4. `text{33.75 cm}^2\ text{and 46.75 cm}^2`
Show Answers Only

`D`

Show Worked Solution

`text{Absolute error}\ = 1/2 xx text{precision}\ =0.5\ text{cm}`

`text{8 cm side: upper limit = 8.5 cm, lower limit = 7.5 cm}`

`text{5 cm side: upper limit = 5.5 cm, lower limit = 4.5 cm}`

`text{Rectangle upper limit}\ =8.5xx5.5=46.75\ text{cm}^2`

`text{Rectangle lower limit}\ =7.5xx4.5=33.75\ text{cm}^2`

`=>D`

♦♦♦ Mean mark 29%.

Filed Under: Units and Measurement Error (Std 2) Tagged With: Band 6, smc-797-10-Measurement Error

BIOLOGY, M1 2014 HSC 19 MC

What is the best explanation for the fish surviving gradual temperature change but not a rapid temperature change?

  1. It takes time for each gene to be expressed.
  2. Enzyme activity is decreased at low temperatures.
  3. The fish produce different enzymes at different temperatures.
  4. Some enzymes will not denature if the temperature change is gradual.
Show Answers Only

\(A\)

Show Worked Solution
  • It takes time for each gene to be expressed, due to the time taken to both detect change and for the fish to create the optimal enzymes.
  • Rapid change would result in not enough time for the new enzyme to be utilised, and the fish may not survive due to denatured enzymes.

\(\Rightarrow A\)

♦♦♦ Mean mark 25%.

Filed Under: Cell Function Tagged With: Band 6, smc-4303-60-Enzymes

BIOLOGY, M2 2015 HSC 36e

'Science has been used to solve problems in the investigation of photosynthesis, and so has provided information of benefit to society.' 

Justify this statement with reference to the scientific knowledge behind radioactive tracers for the study of photosynthesis.   (7  marks)

--- 20 WORK AREA LINES (style=lined) ---

Show Answers Only
  • The intricate nature of photosynthesis has posed many barriers when scientists attempt to study it. To overcome this scientists have used radioactive tracers, synthetic chemicals which are taken up by the plant and act as normal organic chemicals except they contain a radioactive component.
  • Radioactive atoms release radiation that can be seen by technologies like X-ray film, geiger counters etc. The pathway of a radioactive substance through the living thing can be followed, as can the biochemical pathways that the molecule/atom is involved in.
  • \(\ce{C^{14}O2}\) and \(\ce{H2O^{18}}\) are both radioactive tracers that can be used to study photosynthesis.
  • If plants are surrounded by \(\ce{C^{14}O2 (g)}\) the radioactivity is soon seen in starch granules in the leaves of the plant. This shows that the starch is formed from the \(\ce{CO2}\) in the air, and is composed of carbon atoms from the air. None of the \(\ce{C^{14}}\) in the \(\ce{C^{14}O2 (g)}\) taken in by the plant is lost.
  • If plants are watered with \(\ce{H2O^{18} (l)}\) the radioactivity is seen in the \(\ce{O2}\) that the plant releases into the air around the plant and not in molecules constructed by photosynthesis contained within the leaf.
  • Therefore in photosynthesis the water is split and the oxygen released into the atmosphere, the \(\ce{H}\) incorporated into the plant within intermediate molecules in a biochemical pathway, and then finally into a starch molecule.
  • This knowledge is of benefit to society because we need to find ways of reducing the carbon in the atmosphere because of excess use of fossil fuel combustion and its resultant climate change. We can understand that land clearing with its removal of photosynthetic species will exacerbate the build up of carbon in the atmosphere because of the loss of photosynthesis it causes.
  • Society is also concerned about the need to generate oxygen such as in the context of massive amounts of fossil fuel combustion also removing oxygen from the atmosphere. Understanding that plants release oxygen in photosynthesis is part of the offsets for fossil fuel use in re-forestation projects as the carbon is locked up in the plant and oxygen is released into the atmosphere.
Show Worked Solution
  • The intricate nature of photosynthesis has posed many barriers when scientists attempt to study it. To overcome this scientists have used radioactive tracers, synthetic chemicals which are taken up by the plant and act as normal organic chemicals except they contain a radioactive component.
  • Radioactive atoms release radiation that can be seen by technologies like X-ray film, geiger counters etc. The pathway of a radioactive substance through the living thing can be followed, as can the biochemical pathways that the molecule/atom is involved in.
  • \(\ce{C^{14}O2}\) and \(\ce{H2O^{18}}\) are both radioactive tracers that can be used to study photosynthesis.
  • If plants are surrounded by \(\ce{C^{14}O2 (g)}\) the radioactivity is soon seen in starch granules in the leaves of the plant. This shows that the starch is formed from the \(\ce{CO2}\) in the air, and is composed of carbon atoms from the air. None of the \(\ce{C^{14}}\) in the \(\ce{C^{14}O2 (g)}\) taken in by the plant is lost.
  • If plants are watered with \(\ce{H2O^{18} (l)}\) the radioactivity is seen in the \(\ce{O2}\) that the plant releases into the air around the plant and not in molecules constructed by photosynthesis contained within the leaf.
  • Therefore in photosynthesis the water is split and the oxygen released into the atmosphere, the \(\ce{H}\) incorporated into the plant within intermediate molecules in a biochemical pathway, and then finally into a starch molecule.
  • This knowledge is of benefit to society because we need to find ways of reducing the carbon in the atmosphere because of excess use of fossil fuel combustion and its resultant climate change. We can understand that land clearing with its removal of photosynthetic species will exacerbate the build up of carbon in the atmosphere because of the loss of photosynthesis it causes.
  • Society is also concerned about the need to generate oxygen such as in the context of massive amounts of fossil fuel combustion also removing oxygen from the atmosphere. Understanding that plants release oxygen in photosynthesis is part of the offsets for fossil fuel use in re-forestation projects as the carbon is locked up in the plant and oxygen is released into the atmosphere.

Filed Under: Nutrient and Gas Requirements Tagged With: Band 4, Band 5, Band 6, smc-4305-75-Autoradiography

BIOLOGY, M2 2018 HSC 18 MC

The micrograph shows normal-sized human red blood cells.

Within three of these red blood cells, an infection known as Plasmodium falciparum appears under the microscope view as a dark ring shape.
 

Which of the following is the best estimate of the diameter of the Plasmodium?

  1. \(0.002\ \text{mm}\)
  2. \(0.8\ \mu \text{m}\)
  3.  \(2\ \text{mm}\)
  4.  \(8\ \mu \text{m}\)
Show Answers Only

\(A\)

Show Worked Solution
  • The plasmodium are about 25% the size of the red blood cells.
  • As red blood cells are around 8µm, the plasmodium is approximately 2µm in diameter, or 0.002mm.

\(\Rightarrow A\)

♦♦♦ Mean mark 22%.

Filed Under: Transport Tagged With: Band 6, smc-4306-10-Blood

BIOLOGY, M1 2015 HSC 18 MC

Students conducted a large first-hand investigation into enzyme activity.

The aim in the report is shown.

Aim: To determine the optimum pH of four different enzymes.

How many independent variables were in this first-hand investigation?

  1. 1
  2. 2
  3. 4
  4. 5
Show Answers Only

\(B\)

Show Worked Solution
  • There are two independent variables, the pH and the selected enzyme. Both are changed in order to measure something, e.g. substrate concentration, in order to determine optimum pH for each of the enzymes individually.

\(\Rightarrow B\)

♦♦♦ Mean mark 22%.

Filed Under: Cell Function Tagged With: Band 6, smc-4303-60-Enzymes

BIOLOGY, M1 2017 HSC 36e

Analyse the impact of the development of the electron microscope on the understanding of chloroplast structure and function.  (7 marks)

--- 14 WORK AREA LINES (style=lined) ---

Show Answers Only
  • Using light microscopes, scientists were able to view and identify chloroplasts. However, it wasn’t until the development of the electron microscope with its greater magnification and resolution, that scientists were able to view a chloroplast’s internal structure.
  • Structures such as the grana, stroma and thylakoids could then be identified. The role of each in the process of photosynthesis could then be studied.
  • Thylakoids are flattened, hollow discs which are arranged in stacks called grana. The stacking of the layers into grana increases stability and surface area for the capture of light.
  • The membranes of these thylakoids contain chlorophyll and are the site for the light-dependent reactions of photosynthesis.
  • The space outside the thylakoid is called the stroma, which is an aqueous fluid present within the inner membrane of the chloroplast. It contains DNA, ribosomes, lipid droplets and starch granules. This is where the light independent reactions, the Calvin cycle, takes place.
  • The functions described would not have been linked to the internal structures of the chloroplast without the development of an electron microscope.
Show Worked Solution
  • Using light microscopes, scientists were able to view and identify chloroplasts. However, it wasn’t until the development of the electron microscope with its greater magnification and resolution, that scientists were able to view a chloroplast’s internal structure.
  • Structures such as the grana, stroma and thylakoids could then be identified. The role of each in the process of photosynthesis could then be studied.
  • Thylakoids are flattened, hollow discs which are arranged in stacks called grana. The stacking of the layers into grana increases stability and surface area for the capture of light.
  • The membranes of these thylakoids contain chlorophyll and are the site for the light-dependent reactions of photosynthesis.
  • The space outside the thylakoid is called the stroma, which is an aqueous fluid present within the inner membrane of the chloroplast. It contains DNA, ribosomes, lipid droplets and starch granules. This is where the light independent reactions, the Calvin cycle, takes place.
  • The functions described would not have been linked to the internal structures of the chloroplast without the development of an electron microscope.

Filed Under: Cell Function, Cell Structure Tagged With: Band 4, Band 5, Band 6, smc-4302-30-Technology, smc-4303-10-Photosynthesis

CHEMISTRY, M2 2011 HSC 18* MC

A household cleaning agent contains a weak base with the formula \( \ce{NaX}\). 1.00 g of this compound was dissolved in water to give 100.0 mL of solution. A 20.0 mL sample of the solution was mixed with 0.100 mol L\(^{-1}\) hydrochloric acid, and required 24.4 mL of the acid for neutralisation.

\(\ce{NaX + HCl -> NaCl + HX}\)

What is the molar mass of the weak base?

  1. 82.0 g mol\(^{-1}\)
  2. 84.0 g mol\(^{-1}\)
  3. 122 g mol\(^{-1}\)
  4. 410 g mol\(^{-1}\)
Show Answers Only

\(A\)

Show Worked Solution

\(\ce{n(HCl)} = 0.100 \times 24.4 \times 10^{-3} = 2.44 \times 10^{-3}\ \text{mol}\)

\(\ce{n(NaX)}=2.44 \times 10^{-3}\ \text{mol in 20 mL sample.}\)

\(\ce{c(NaX)}=\dfrac{2.44 \times 10^{-3}}{20 \times 10^{-3}} =0.122\ \text{mol L}^{-1}\)

\(\ce{n(NaX)}=0.122 \times 0.1=0.0122\ \text{mol (in 100 mL sample)}\)

\(\ce{MM(NaX)}=\dfrac{1}{0.0122}=82\ \text{g mol}^{-1}\)

\(\Rightarrow A\)

Filed Under: Concentration and Molarity Tagged With: Band 6, smc-4261-20-Concentration Calculations, smc-4261-60-Dilutions, smc-4261-70-Standard Solutions

CHEMISTRY, M2 2013 HSC 17* MC

A 25.0 mL sample of a 0.100 mol L\(^{-1}\) hydrochloric acid solution completely reacted with 23.4 mL of sodium hydroxide solution.

\(\ce{HCl + NaOH -> NaCl + H2O}\)

\(\ce{CH3COOH + NaOH -> CH3COONa + H2O}\)

Given the two equations above. What volume of the same sodium hydroxide solution would be required to completely react with 25.0 mL of a 0.100 mol L\(^{-1}\) acetic acid solution \(\ce{(CH3COOH)}\)?

  1. Less than  23.4 mL
  2. 23.4 mL
  3. More than  23.4 mL
  4. Unable to calculate unless the concentration of the sodium hydroxide solution is also known
Show Answers Only

\(B\)

Show Worked Solution
  • The strength of the acid does not affect the volume of \(\ce{NaOH}\) required for nuetralisation.
  • It is dependent on stoichiometric ratios and both \(\ce{HCl}\) and \(\ce{CH3COOH}\) are monoprotic and so react in 1:1 ratio with sodium hydroxide.

\(\Rightarrow B\)

Filed Under: Concentration and Molarity Tagged With: Band 6, smc-4261-30-Volume Calculations

CHEMISTRY, M2 2013 HSC 22b

A solution contains three cations, \( \ce{Ba}^{2+}, \ce{Cu}^{2+}\) and \(\ce{Pb}^{2+}\). The flow chart indicates the plan used to confirm the identity of these cations.


Write a balanced net ionic equation for the formation of Precipitate 1.  (2 marks)

--- 4 WORK AREA LINES (style=lined) ---

Show Answers Only

\(\ce{Pb^{2+}(aq) + 2Cl-(aq) \rightarrow PbCl2(s)}\)

Show Worked Solution

\(\ce{Pb^{2+}(aq) + 2Cl-(aq) \rightarrow PbCl2(s)}\)

  • In the above flow chart, the addition of excess HCl causes one of the cations to precipitate out of the solution.
  • The remaining two are then distinguished through precipitation with excess sulfuric acid \(\ce{(H2SO4)}\).
  • Of the possible salts, only \(\ce{PbCl2(s)}\) is insoluble. Therefore Precipitate 1 is Lead \(\text{(II)}\) Chloride.
  • Balanced net ionic equation:  \(\ce{Pb^{2+}(aq) + 2Cl-(aq) \rightarrow PbCl2(s)}\)
♦♦♦ Mean mark 27%.

Filed Under: Chemical Reactions and Stoichiometry Tagged With: Band 6, smc-4259-50-Balancing Chemical Equations

CHEMISTRY, M1 2011 HSC 36bii

Explain the fact that Group I and Group II metal ions have one oxidation state while the transition metals often have multiple oxidation states.  (3 marks)

Show Answers Only


Show Worked Solution
  • Group I and II metals lose one or two ‘s’ valence shell electrons easily to acquire a noble gas electron configuration.
  • Removal of further electrons is difficult.
  • Thus Group I metals lose one electron and Group II metals lose two electrons to form +1 and +2 cations respectively.
  • Transitions elements lose ‘d’ shell electrons, to obtain a variety of oxidation states.

Filed Under: Atomic Structure and Atomic Mass Tagged With: Band 6, smc-4256-30-Electronic Configuration

BIOLOGY, M2 2016 HSC 31

As altitude increases, the partial pressure of oxygen \( \text{(p} \ce{O_2)}\) in air decreases. 

Species A and B are closely related endotherms that live in different habitats in Asia. The minimum \( \text{p} \ce{O_2}\) required for 100% blood oxygen saturation differs in these species because of differences in their haemoglobin structure. Data related to these two species are shown below.

\begin{equation}
\begin{array}{|c|c|c|}
\hline \text { Endotherm species } & \text { Habitat altitude } & \text { Minimum } \mathrm{pO}_2 \text { for } 100 \%\ \mathrm{Hb} \text { saturation } \\
\hline \mathrm{A} & \mathrm{High} & 54 \\
\mathrm{~B} & \text { Low } & 80 \\
\hline
\end{array}
\end{equation}

Explain how the differences in these species could have arisen, using the Darwin/Wallace theory of evolution and your understanding of the adaptive advantage of haemoglobin.  (8 marks)

--- 18 WORK AREA LINES (style=lined) ---

Show Answers Only
  • Haemoglobin is a protein that provides a mechanism for transport of oxygen around the body. As it is a protein, it’s structure is dependant on the individual’s genotype.
  • Species A and Species B are able to reach 100% saturation at differing partial pressures of oxygen, meaning they have different DNA which codes for different haemoglobin structures.
  • Species A and B are likely to have diverged from a common ancestor because of differing environmental pressures resulting in two different species. Within the ancestral population there was variation which resulted from random mutations. One mutation would have resulted in haemoglobin that is able to reach 100% saturation at a lower partial pressure of oxygen.
  • When members of the ancestral species moved to a higher altitude the ability of their haemoglobin to reach saturation at a lower \( \text{p} \ce{O_2}\) gave them a survival advantage. These individuals were then more likely to reproduce and pass on their favourable genes.
  • For individuals living at lower altitudes, there is no survival advantage to being able to reach 100% saturation at lower \( \text{p} \ce{O_2}\) which means this trait was not selected for.
  • Over time, due to the isolation at a higher altitude a new species evolved.
Show Worked Solution
  • Haemoglobin is a protein that provides a mechanism for transport of oxygen around the body. As it is a protein, it’s structure is dependant on the individual’s genotype.
  • Species A and Species B are able to reach 100% saturation at differing partial pressures of oxygen, meaning they have different DNA which codes for different haemoglobin structures.
  • Species A and B are likely to have diverged from a common ancestor because of differing environmental pressures resulting in two different species. Within the ancestral population there was variation which resulted from random mutations. One mutation would have resulted in haemoglobin that is able to reach 100% saturation at a lower partial pressure of oxygen.
  • When members of the ancestral species moved to a higher altitude the ability of their haemoglobin to reach saturation at a lower \( \text{p} \ce{O_2}\) gave them a survival advantage. These individuals were then more likely to reproduce and pass on their favourable genes.
  • For individuals living at lower altitudes, there is no survival advantage to being able to reach 100% saturation at lower \( \text{p} \ce{O_2}\) which means this trait was not selected for.
  • Over time, due to the isolation at a higher altitude a new species evolved.
♦♦ Mean mark 41%.

Filed Under: Natural Selection Tagged With: Band 4, Band 5, Band 6, smc-4309-10-Biological diversity

  • « Previous Page
  • 1
  • …
  • 6
  • 7
  • 8
  • 9
  • 10
  • …
  • 28
  • Next Page »

Copyright © 2014–2025 SmarterEd.com.au · Log in