`12.5 xx Z = 2.5`
Find the value of `Z` in order to make this number sentence correct
|
|
1.35 |
|
|
0.40 |
|
|
5.0 |
|
|
0.20 |
Aussie Maths & Science Teachers: Save your time with SmarterEd
`12.5 xx Z = 2.5`
Find the value of `Z` in order to make this number sentence correct
|
|
1.35 |
|
|
0.40 |
|
|
5.0 |
|
|
0.20 |
`1.36 xx B = 0.68`
Find the value of `B` that makes this number sentence correct.
|
|
0.75 |
|
|
0.60 |
|
|
0.50 |
|
|
0.20 |
The results of a men's 100 metre swimming race is recorded in the table below.
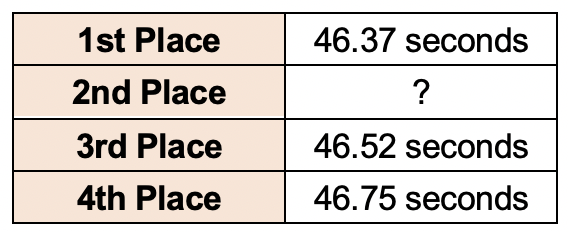
What could be the finishing time of the 2nd placed swimmer?
|
|
46.28 seconds |
|
|
46.61 seconds |
|
|
46.48 seconds |
|
|
46.80 seconds |
The result of a 100-metre dash was recorded in the table shown below.

What could be the time of the runner in 3rd place?
|
|
13.85 seconds |
|
|
14.26 seconds |
|
|
14.58 seconds |
|
|
14.92 seconds |
Lester schedules a company meeting twice every 5 working days.
Today is a working day.
What is the probability that there is a meeting scheduled?
|
|
`2/7` |
|
|
`0.40` |
|
|
`3/5` |
|
|
`text(25%)` |
Laura's country hut is visited by a possum twice every week.
What is the probability that the possum visits her hut today?
|
|
`2/7` |
|
|
`2/5` |
|
|
`0.70` |
|
|
`text(25%)` |
Some tiles are missing in the tile pattern shown below.

When completed, the tile pattern has one line of symmetry
Which of these could be the missing tiles?
|
|
 |
|
|
 |
|
|
 |
|
|
 |
`text{The completed pattern is shown below.}`

Some shapes are missing in this pattern.

When completed, the pattern has one line of symmetry.
Which of these could be the missing part of the pattern?
|
|
 |
|
|
 |
|
|
 |
|
|
 |
`text(The completed pattern is shown below.)`

Henry got lost on his way to visit his uncle’s house and made 3 U-turns before arriving.
In total, how many degrees does Henry turn through when making U-turns on his trip?
|
|
150° |
|
|
270° |
|
|
540° |
|
|
1080° |
During an X-Games snowboarding competition, an athlete performed 4 full backward summersaults before landing.
By how many degrees did the athlete rotate her body during this move?
|
|
360° |
|
|
920° |
|
|
1080° |
|
|
1440° |
A pack of sugar weighs `1/4` of a kilogram.
Josh bought 6 packs for baking.
How many kilograms of sugar did he buy?
|
|
`2/3` |
|
|
`1 1/2` |
|
|
`2 1/4` |
|
|
`3` |
A box of apples weighs `2/3` of a kilogram
Lou bought 3 boxes.
How many kilograms of apples did he bought?
|
|
`1 frac{4}{9} \ text{kg}` |
|
|
`2 \ text{kg}` |
|
|
`frac{8}{9} \ text{kg}` |
|
|
`2 frac{2}{3} \ text{kg}` |
The arrow pictured below is spun once.

Which number is the spinner least likely to land on?
| 1 | 2 | 3 | 1 or 2 |
|
|
|
|
|
A disk is thrown onto the table pictured below.

It has an equal chance of landing in any square.
Which numbered square is the disk least likely to land in?
| 3 | 4 | 5 | same chance for each number |
|
|
|
|
|
The tallest living giraffe is measured at five thousand, seven hundred and eight millimetres tall.
Write this as a number in the box below
millimetres
The exact length of great white shark is measured as five thousand and ninety six millimetres.
Write this as a number in the box below
millimetres
Let `f(x) = x^2e^(−x)`.

Let `g(x) = x^n e^(−x)`, where `n ∈ Z`.


a. `f′(x) = 2xe^(−x) – x^2e^(−x)`
`text(SP’s when)\ \ f′(x) = 0:`
| `x^2e^(−x)` | `= 2xe^(−x)` |
| `x` | `= 2\ \ text(or)\ \ 0` |
`f(0) = 0; \ f(2) = 4e^(−2)`
`:. text(SP’s at)\ \ (0, 0) and (2, 4e^(−2))`
b. `text(As)\ \ x -> ∞, \ f(x) -> 0^+`
`:. text(Horizontal asymptote at)\ \ y = 0`
| c. | |
`text(POI when)\ \ f″(x) = 0`
`:. text(POI’s:)\ (0.59, 0.19), \ (3.41, 0.38)`
d. `g′(x) = x^(n – 1) e^(−x)(n – x)`
`g″(x) = x^(n – 2) e^(−x)(x^2 – 2xn + n^2 – n)`
e.i. `text(Solve:)\ \ x^2 – 2xn + n^2 – n = 0`
`x = n ± sqrtn`
| e.ii. | |
A spinning wheel has sections labelled with different numbers.
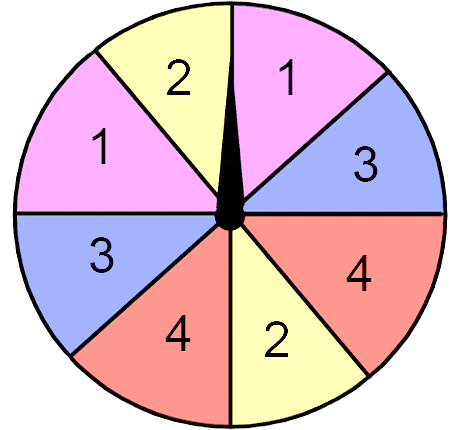
Which of the numbers in the wheel is the spinner most likely to land on?
|
|
1 or 3 |
|
|
1 |
|
|
2 or 4 |
|
|
All of the colours are equally likely |
A spinning wheel has 3 different colours.
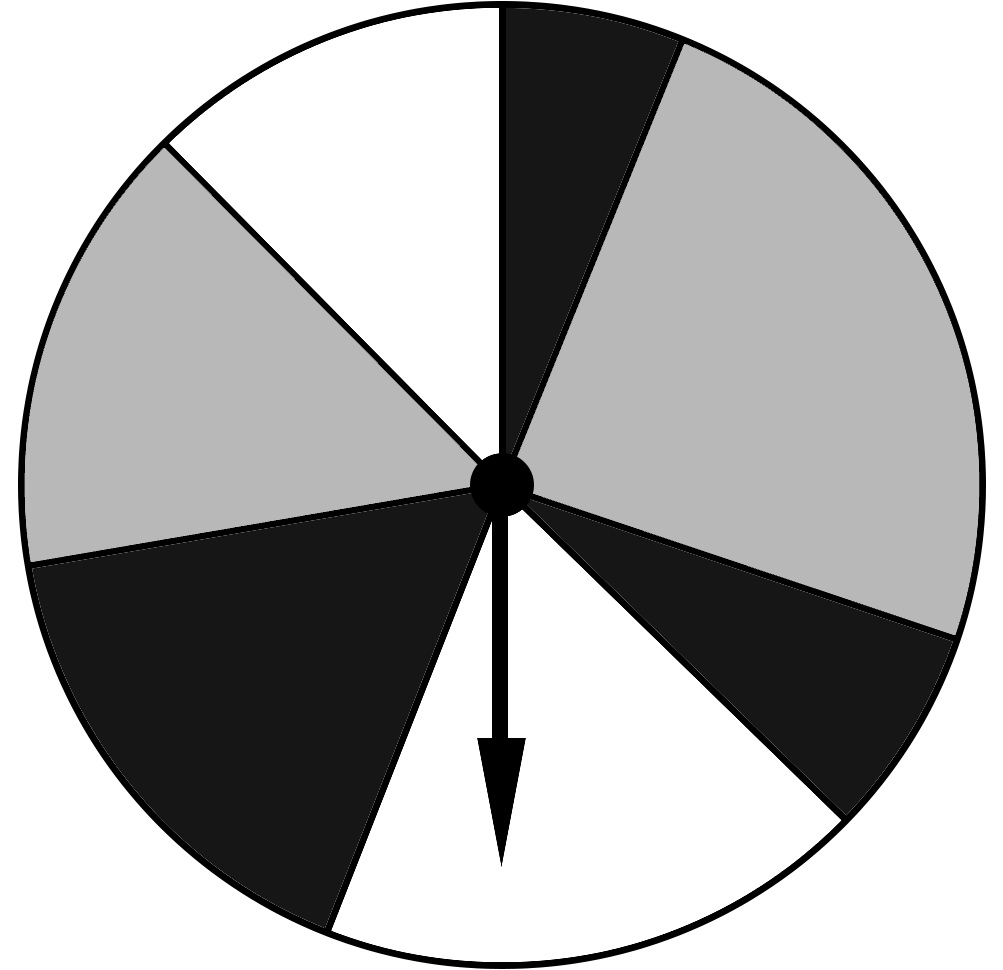
Which colour in the wheel is most likely to land on?
|
|
White |
|
|
Black |
|
|
Grey |
|
|
All of the colours are equally likely |
A circle is divided into 8 equal parts, as shown in the image below.

What percentage of the circle’s area has been labelled with letters?
|
|
30% |
|
|
37.5% |
|
|
42.5% |
|
|
45% |
|
|
47.5% |
Yohan was driving from the hospital to his house.

What directions best describe Yohan’s travel from the hospital to his house?
|
|
East, north-east, north |
|
|
West, north-west, north |
|
|
East, north-east, south |
|
|
West, north-west, south |
`text(The directions travelled by Yohan:)`

`text(The direction was East, North-East, and North)`
A man drives from his house to his office.

What directions best describe his way to the office?
|
|
North, north-west, west, south-west |
|
|
North, north-east, east, south-east |
|
|
North, north-east, east, south |
|
|
North, north-west, east, south-east |
`text(The directions travelled by the man:)`

`:.\ text(The direction was north, north-east, east, south-east.)`
Four triangular shaped playgrounds are shown below.
Which of these play grounds has the least surface area?
|
|
 |
|
|
 |
|
|
 |
|
|
 |
`text(Check each option:)`
`text(Option 1 -)\ \ 1/2 xx 34 xx 15 = 255\ text(m)^2`
`text(Option 2 -)\ \ 1/2 xx 20 xx 26 = 260\ text(m)^2`
`text(Option 3 -)\ \ 1/2 xx40 xx 18 = 360\ text(m)^2`
`text(Option 4 -)\ \ 1/2 xx28 xx 25 = 350\ text(m)^2`
`:.\ text(The backyard with the least area is:`
In a suburb, four families measured the dimensions of their rectangular backyards.
Which backyard has the largest area?
|
|
 |
|
|
 |
|
|
 |
|
|
 |
`text(Checking each option:)`
`text(Option 1:)\ 11 xx 18 = 198 text(m)^2`
`text(Option 2:)\ 16 xx 6 = 96 text(m)^2`
`text(Option 3:)\ 15 xx 10 = 150 text(m)^2`
`text(Option 4:)\ 14 xx 12 = 168 text(m)^2`
`:. text(The backyard with the largest area is the)\ 11\ text(m) xx 18\ text(m)`
`text(with a total area of 198 square metres.)`
A store sells second hand mobile phones.
The graph below shows the price of 2 similar second-hand phones.

Which of the following is true based on the graph shown?
|
|
Phone A is older and less expensive than Phone B |
|
|
Phone B is older and more expensive than phone A |
|
|
Phone A is newer and more expensive than Phone B |
|
|
Phone A is older and more expensive than Phone B |
A man bought a plot of land in the past and now he is selling it.
The graph marks the price of the land when the man bought it and the price of the land now.

Which of the following is true based on the graph shown?
|
|
The land is less expensive now than when it was purchased. |
|
|
The land is more expensive years ago than now. |
|
|
The land is more expensive now than years ago. |
|
|
The price of the land does not change with time. |
A circle is divided into 8 equal parts, as shown in the diagram below.

What percentage of the circle’s area has been labelled with even numbers?
|
|
37.5% |
|
|
50% |
|
|
57.5% |
|
|
62.5% |
|
|
70% |
For non-zero constants `a` and `b`, where `b < 0`, the expression `1/(ax(x^2 + b))` in partial fraction form with linear denominators, where `A, B` and `C` are real constants, is
Let `f(x) = sqrt(x - 1)/x` over its implied domain and `g(x) = text(cosec)^2 x` for `0 < x < pi/2`.
The rule for `f(g(x))` and the range, respectively, are given by
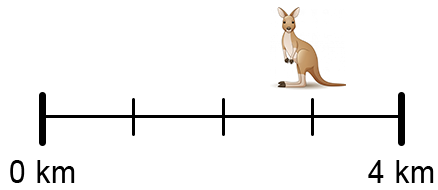
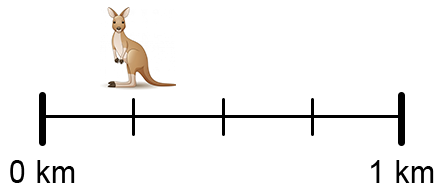
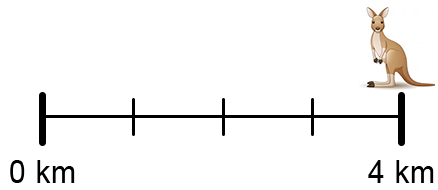
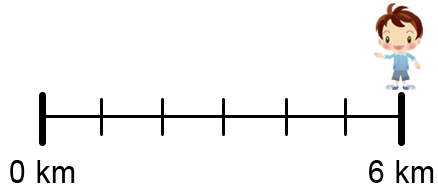
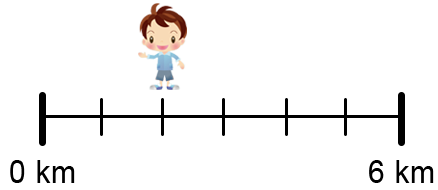
Julian was driving into town and hit a kangaroo `3/4` of a kilometre into his trip.
Which of these represent where Julian hit the kangaroo?
|
|
 |
|
|
 |
|
|
 |
|
|
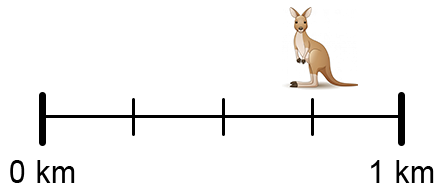 |
`text(Each spacing is worth)\ 1/4\ text(km.)`
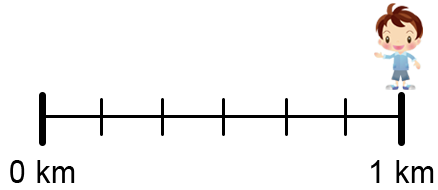
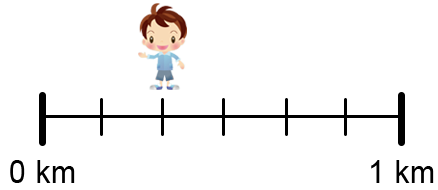
Axe went jogging and stopped after `2/6` of a kilometre to take a rest.
Which of these represents where Axe stopped jogging?
|
|
 |
|
|
 |
|
|
 |
|
|
 |
`text(Each spacing is worth)\ 1/6\ text(km.)`

Which of these is the left view of this object made from cubes?
|
|
 |
|
|
|
|
|
|
|

What number is exactly halfway between `4 frac{1}{4}` and `6 frac{3}{4}`
|
|
`4 frac{3}{4}` | |
|
|
`5` | |
|
|
`5 frac{1}{4}` | |
|
|
`5 frac{1}{2}` |
The directed network below shows the sequence of activities, `A` to `I`, that is required to complete an office renovation.
The time taken to complete each activity, in weeks, is also shown.

The project manager would like to complete the office renovation in less time.
The project manager asks all the workers assigned to activity `H` to also work on activity `F`.
This will reduce the completion time of activity `F` to three weeks.
The workers assigned to activity `H` cannot work on both activity `H` and activity `F` at the same time.
No other activity times will be changed.
This change to the network will result in a change to the completion time of the office renovation.
Which one of the following is correct?
`text{Original forward scan (note}\ F\ text{is 6 origionally but}`
`text{is reduced to 3 for the adjusted critical path):}`

`text(Original critical path is:)\ ACEFGI = 2+5+3+6+4+5=25`
`text(If activity)\ F\ text(is completed in 3 weeks, and then)`
`text(activity)\ H\ text(starts, new critical path is:)`
`ACEF\ text{(dummy)}\ HI = 24\ text(weeks)`
`=> A`
The flow of liquid through a series of pipelines, in litres per minute, is shown in the directed network below.

Five cuts labelled A to E are shown on the network.
The number of these cuts with a capacity equal to the maximum flow of liquid from the source to the sink, in litres per minute, is
Ray deposited $5000 in an investment account earning interest at the rate of 3% per annum, compounding quarterly.
A rule for the balance, `R_n` , in dollars, after `n` years is given by
Part of the graph of `y = f(x)`, where `f:(0, ∞) -> R, \ f(x) = xlog_e(x)`, is shown below.

The graph of `f` has a minimum at the point `Q(a, f(a))`, as shown above.
a. `y = xlog_e x`
| `(dy)/(dx)` | `= x · 1/x + log_e x` |
| `= 1 + log_e x` |
`text(Find)\ x\ text(when)\ (dy)/(dx) = 0:`
| `1 + log_e x` | `= 0` |
| `log_e x` | `= −1` |
| `x` | `= 1/e` |
| `y` | `= 1/e log_e (e^(−1))` |
| `= −1/e` |
`:. Q(1/e, −1/e)`
| b. | `int 2x log_e(x) + x\ dx` | `= x^2 log_e (x) + c` |
| `2 int x log_e(x)\ dx` | `= x^2 log_e (x) – intx\ dx + c` | |
| `:. int x log_e(x)\ dx` | `= (x^2 log_e (x))/2 – (x^2)/4 \ \ (c = 0)` |
| c. |  |
`text(When)\ \ x log_e x = 0 \ => \ x = 1`
`=> b = 1`
| `:.\ text(Area)` | `= −int_(1/e)^1 x log_e(x)\ dx` |
| `= [(x^2)/4 – (x^2 log_e(x))/2]_(1/e)^1` | |
| `= (1/4 – 0) – (1/(4e^2) – (log_e(e^(−1)))/(2e^2))` | |
| `= 1/4 – (1/(4e^2) + 1/(2e^2))` | |
| `= 1/4 – 3/(4e^2) \ text(u)^2` |
d.i. `text(When)\ \ f′(x) = m_text(tang) = 2,`
| `1 + log_e(x)` | `= 2` |
| `x` | `= e` |
`text(T)text(angent meets)\ \ g(x)\ \ text(at)\ \ (e, 2e)`
| `g(e)` | `= f(e) + k` |
| `2e` | `= e log_e e + k` |
| `:.k` | `= e` |
d.ii. `text(Find the value of)\ k\ text(when)\ \ y = x\ \ text(is a tangent to)\ g(x):`
`text(When)\ \ f′(x) = 1,`
| `1 + log_e(x)` | `= 1` |
| `x` | `= 1` |
`text(T)text(angent occurs at)\ (1, 1)`
`g(1) = f(1) + k \ => \ k = 1`
`:.\ text(Graphs don’t intersect for)\ k ∈ (1, ∞)`
Let `I_n = int_0^(frac{pi}{2}) sin^(2n + 1)(2theta)\ d theta, \ n = 0, 1, ...`
--- 8 WORK AREA LINES (style=lined) ---
--- 8 WORK AREA LINES (style=lined) ---
Let `J_n = int_0^1 x^n (1 - x)^n\ dx , \ n = 0, 1, 2,...`
--- 8 WORK AREA LINES (style=lined) ---
--- 10 WORK AREA LINES (style=lined) ---
i. `text{Prove} \ \ I_n = frac{2n}{2n + 1} I_(n-1) , \ n ≥ 1`
`I_n = int_0^(frac{pi}{2}) sin^(2n) (2 theta) * sin (2 theta)\ d theta`
`text{Integrating by parts:}`
| `u = sin^(2n) (2 theta)` | `u^(′) = 2n sin^(2n -1) (2 theta) xx -frac(1)(2) cos (2 theta)` | |
| `v = -frac{1}{2} cos (2 theta)` | `v^(′) = sin 2 theta` |
| `I_n` | `= [ sin^(2n) (2 theta) * -frac{1}{2} cos (2 theta)]_0^(frac{pi}{2}) -2n int_0^(frac{pi}{2}) sin^(2n -1) (2 theta) * 2 cos (2 theta) * -frac{1}{2} cos (2 theta)\ d theta` |
| `I_n` | `= 0 + 2n int_0^(frac{pi}{2}) sin^(2n-1) (2 theta) * cos^2 (2 theta)\ d theta` |
| `I_n` | `= 2 n int_0^(frac{pi}{2}) sin^(2n-1) (2 theta) (1 – sin^2 (2 theta))\ d theta` |
| `I_n` | `= 2 n int_0^(frac{pi}{2}) sin^(2n-1) ( 2 theta) – sin^(2n+1) (2 theta)\ d theta` |
| `I_n` | `= 2n (I_(n-1) – I_n)` |
| `I_n + 2 n I_n` | `= 2 n I_(n-1)` |
| `I_n (2n + 1)` | `= 2 n I_(n-1)` |
| `therefore I_n` | `= frac{2n}{2n +1} I_(n-1)` |
| ii. | `I_0` | `= int_0^(frac{pi}{2}) sin (2 theta)\ d theta` |
| `= [ -frac(1)(2) cos (2 theta) ]_0^(frac{pi}{2}` | ||
| `=( -frac{1}{2} cos pi + frac{1}{2} cos 0 )` | ||
| `= 1` | ||
| `I_n` | `= frac{2n}{2n + 1} I_(n-1)` |
| `I_(n-1)` | `= frac{2(n -1)}{2n -1} I_(n-2)` |
| `vdots` | |
| `I_1` | `= frac{2}{3} I_0` |
| `I_n` | `= frac{2n}{2n + 1} xx frac{2(n-1)}{2n-1} xx frac{2(n-2)}{2n-3} xx … xx frac{2}{3} xx 1` |
| `= frac{2n}{2n+1} xx frac{2n}{2n} xx frac{2(n-1)}{2n-1} xx frac{2(n-1)}{2n-2} xx … xx frac{2}{3} xx frac{2}{2} xx 1` | |
| `= frac{2^n (n xx (n-1) xx .. xx 1) xx 2^n (n xx (n – 1) xx … xx 1)}{(2n + 1)!}` | |
| `= frac{2^(2n) (n!)^2}{(2n + 1)!}` |
iii. `J_n = int_0^1 x^n (1-x)^n\ dx , \ n = 0, 1, 2, …`
| `text{Let} \ \ x` | `= sin^2 theta` |
| `frac{dx}{d theta}` | `= 2 sin theta \ cos theta \ => \ dx = 2 sin theta \ cos theta \ d theta` |
| `text{When}` | `x = 0 \ ,` | ` \ theta = 0` |
| `x = 1 \ ,` | ` \ theta = frac{pi}{2}` |
| `J_n` | `= int_0^(frac{pi}{2}) (sin^2 theta)^n (1 – sin^2 theta)^n * 2 sin theta \ cos theta \ d theta` |
| `= int_0^(frac{pi}{2}) sin^(2n) theta \ cos^(2n) theta * sin (2 theta)\ d theta` | |
| `= frac{1}{2^(2n)} int_0^(frac{pi}{2}) 2^(2n) sin^(2n) theta \ cos^(2n) theta * sin (2 theta)\ d theta` | |
| `= frac{1}{2^(2n)} int_0^(frac{pi}{2}) sin^(2n) (2 theta) * sin (2 theta)\ d theta` | |
| `= frac{1}{2^(2n)} int_0^(frac{pi}{2}) sin^(2n+1) (2 theta)\ d theta` | |
| `= frac{1}{2^(2n)} * frac{2^(2n) (n!)^2}{(2n+1)!}\ \ \ text{(using part (ii))}` | |
| `= frac{(n!)^2}{(2n + 1)!}` |
iv. `text{If} \ \ I_n ≤ 1,`
| `2^(2n) (n!)^2` | ` ≤ (2n + 1)!` |
| `(2^n n!)^2` | `≤ (2n + 1)!` |
`text{Show} \ \ I_n ≤ 1 :`
`text{Consider the graphs}`
`y = sin(2 theta) \ \ text{and}\ \ y = sin^(2n + 1) (2 theta) \ \ text{for} \ \ 0 ≤ theta ≤ frac{pi}{2}`

| `int_0^(frac{pi}{2}) sin(2 theta)` | `= [ – frac{1}{2} cos (2 theta) ]_0^(frac{pi}{2})` |
| `= – frac{1}{2} cos \ pi + frac{1}{2} cos \ 0` | |
| `= 1` |
`y = sin(2 theta) \ => \ text{Range} \ [0, 1] \ \ text{for}\ \ theta ∈ [0, frac{pi}{2}]`
| `sin^(2n+1) (2 theta)` | `≤ sin (2 theta) \ \ text{for}\ \ theta ∈ [0, frac{pi}{2}]` |
| `sin^(2n+1) (2 theta)` | `≤ 1` |
| `I_n` | `≤ 1` |
| `therefore (2^n n!)^2` | `≤ (2n + 1) !` |
Two similar right-angled triangles are shown.

The length of side `AB` is 8 cm and the length of side `EF` is 4 cm.
The area of triangle `ABC` is 20 cm2.
Calculate the length in centimetres of side `DF` in Triangle II, correct to two decimal places. (4 marks)
--- 8 WORK AREA LINES (style=lined) ---
--- 7 WORK AREA LINES (style=lined) ---
Show that `sin (3theta) = 1/2`. (2 marks)
--- 7 WORK AREA LINES (style=lined) ---
--- 10 WORK AREA LINES (style=lined) ---
There are two tanks on a property, Tank A and Tank B. Initially, Tank A holds 1000 litres of water and Tank B is empty.
The volume of water in Tank A is modelled by `V = 1000 - 20t` where `V` is the volume in litres and `t` is the time in minutes from when the tank begins to lose water.
On the grid below, draw the graph of this model and label it as Tank A. (1 mark)

--- 2 WORK AREA LINES (style=lined) ---

a. `text{T} text{ank} \ A \ text{will pass trough (0, 1000) and (50, 0)}`
b. `text{T} text{ank} \ B \ text{will pass through (15, 0) and (45, 900)}`

`text{By inspection, the two graphs intersect at} \ \ t = 29 \ text{minutes}`
c. `text{Strategy 1}`
`text{By inspection of the graph, consider} \ \ t = 45`
`text{T} text{ank A} = 100 \ text{L} , \ text{T} text{ank B} =900 \ text{L} `
`:.\ text(Total volume = 1000 L when t = 45)`
`text{Strategy 2}`
| `text{Total Volume}` | `=text{T} text{ank A} + text{T} text{ank B}` |
| `1000` | `= 1000 – 20t + (t – 15) xx 30` |
| `1000` | `= 1000 – 20t + 30t – 450 ` |
| `10t` | `= 450` |
| `t` | `= 45 \ text{minutes}` |
A plumber charges a call-out fee of $90 as well as $2 per minute while working.
Suppose the plumber works for `t` hours.
Which equation expresses the amount the plumber charges ($`C`) as a function of time (`t` hours)?
What is 0.002073 expressed in standard form with two significant figures?
Wilma deposited a lump sum into a new bank account which earns 2% per annum compound interest.
Present value interest factors for an annuity of $1 for various interest rates (`r`) and numbers of periods (`N`) are given in the table.

Wilma was able to make the following withdrawals from this account.
Calculate the minimum lump sum Wilma must have deposited when she opened the new account. (3 marks)
--- 6 WORK AREA LINES (style=lined) ---
Suppose `f(x) = tan(cos^(−1)(x))` and `g(x) = (sqrt(1 - x^2))/x`.
The graph of `y = g(x)` is given.

--- 8 WORK AREA LINES (style=lined) ---
--- 6 WORK AREA LINES (style=lined) ---
The intelligence Quotient (IQ) scores for adults in City A are normally distributed with a mean of 108 and a standard deviation of 10.
The IQ score for adults in City B are normally distributed with a mean of 112 and a standard deviation of 16.
--- 4 WORK AREA LINES (style=lined) ---
--- 4 WORK AREA LINES (style=lined) ---
--- 6 WORK AREA LINES (style=lined) ---
a. `text{In City A:}`
`z text{-score}\ (128) = frac {x -mu}{sigma} = frac{128 – 108}{10} = 2`

`therefore\ text{2.5% have a higher IQ in City} \ A.`
b. `text{In City B:}`
`z text{-score}\ (128) = frac{128 – 112}{16} = 1`

`therefore \ text{Adults in City} \ B \ text{with an IQ}\ < 128`
`= 84text(%) xx 1 \ 000 \ 000`
`= 840 \ 000`
c. `z text{-score in City A}\ = z text{-score in City B}`
| `frac{x – 108}{10} ` | `= frac{x -112}{16} \ \ text{(multiply b.s.} \ xx 160 text{)}` |
| `16 (x – 108)` | `= 10 (x – 112)` |
| `16 x – 1728` | `= 10 x – 1120` |
| `6x` | `= 608` |
| `x` | `= 101.3` |
`therefore \ text{Simon’s IQ} = 101.3 \ text{(to 1 d.p.)}`
A cricket is an insect. The male cricket produces a chirping sound.
A scientist wants to explore the relationship between the temperature in degrees Celsius and the number of cricket chirps heard in a 15-second time interval.
Once a day for 20 days, the scientist collects data. Based on the 20 data points, the scientist provides the information below.

The scientist fits a least-squares regression line using the data `(x, y)`, where `x` is the temperature in degrees Celsius and `y` is the number of chirps heard in a 15-second time interval. The equation of this line is
`y = −10.6063 + bx`,
where `b` is the slope of the regression line.
The least-squares regression line passes through the point `(barx, bary)`, where `barx` is the sample mean of the temperature data and `bary` is the sample mean of the chirp data.
Calculate the number of chirps expected in a 15-second interval when the temperature is 19° Celsius. Give your answer correct to the nearest whole number. (5 marks)
The graph shows the number of bacteria, `y`, at time `n` minutes. Initially (when `n = 0`) the number of bacteria is 1000.

--- 1 WORK AREA LINES (style=lined) ---
--- 4 WORK AREA LINES (style=lined) ---
to show that
`((2n),(n)) = ((n),(0))^2 + ((n),(1))^2 + … + ((n),(n))^2`,
where `n` is a positive integer. (2 marks)
--- 6 WORK AREA LINES (style=lined) ---
A group consisting of an even number `(0, 2, 4, …, 2n)` of members is chosen, with the number of men equal to the number of women.
Show, giving reasons, that the number of ways to do this is `((2n),(n))`. (2 marks)
--- 5 WORK AREA LINES (style=lined) ---
Show, giving reasons, that the number of ways to choose the even number of people and then the leaders is
`1^2 ((n),(1))^2 + 2^2((n),(2))^2 + … + n^2((n),(n))^2`. (2 marks)
--- 6 WORK AREA LINES (style=lined) ---
By considering this reversed process and using part (ii), find a simple expression for the sum in part (iii). (2 marks)
--- 6 WORK AREA LINES (style=lined) ---
The population of mice on an isolated island can be modelled by the function.
`m(t) = a sin (pi/26 t) + b`,
where `t` is the time in weeks and `0 <= t <= 52`. The population of mice reaches a maximum of 35 000 when `t=13` and a minimum of 5000 when `t = 39`. The graph of `m(t)` is shown.

--- 3 WORK AREA LINES (style=lined) ---
Find the values of `t, \ 0 <= t <= 52`, for which both populations are increasing. (3 marks)
--- 7 WORK AREA LINES (style=lined) ---
--- 5 WORK AREA LINES (style=lined) ---
| a. | `b` | `= (35\ 000 + 5000)/2` |
| `= 20\ 000` |
| `a` | `=\ text(amplitude of sin graph)` |
| `= 35\ 000 – 20\ 000` | |
| `= 15\ 000` |
b. `text(By inspection of the)\ \ m(t)\ \ text(graph)`
`m^{′}(t) > 0\ \ text(when)\ \ 0 <= t < 13\ \ text(and)\ \ 39 < t <= 52`
`text(Sketch)\ \ c(t):`

`text(Minimum)\ \ (cos0)\ \ text(when)\ \ t = 10`
`text(Maximum)\ \ (cospi)\ \ text(when)\ \ t = 36`
`:. c^{′}(t) > 0\ \ text(when)\ \ 10 < t < 36`
`:. text(Both populations are increasing when)\ \ 10 < t < 13`
c. `c(t)\ text(maximum when)\ \ t = 36`
| `m(t)` | `= 15\ 000 sin(pi/26 t) + 20\ 000` |
| `m^{′}(t)` | `= (15\ 000pi)/26 cos(pi/26 t)` |
| `m^{′}(36)` | `= (15\ 000pi)/26 · cos((36pi)/26)` |
| `= -642.7` |
`:.\ text(Mice population is decreasing at 643 mice per week.)`
The graph shows two functions `y = f(x)` and `y = g(x)`.

Define `h(x) = f(g(x))`.
How many stationary points does `y = h(x)` have for `1 <= x <= 5`?
When Jake stops drinking alcohol at 10:30 pm, he has a blood alcohol content (BAC) of 0.08375.
The number of hours required for a person to reach zero BAC after they stop consuming alcohol is given by the formula
`text(Time) = frac{ text(BAC)}{0.015}`.
At what time on the next day should Jake expect his BAC to be 0.05?
A particle with mass `m` moves horizontally against a resistance force `F`, equal to `mv(1 + v^2)` where `v` is the particle's velocity.
Initially, the particle is travelling in a positive direction from the origin at velocity `T`.
--- 6 WORK AREA LINES (style=lined) ---
--- 8 WORK AREA LINES (style=lined) ---
--- 6 WORK AREA LINES (style=lined) ---
A young tree is protected by a tree guard in the shape of a square-based pyramid.
The height of the tree guard is 54 cm, as shown in the diagram below.

The top section of the tree guard is removed along the dotted line to allow the tree to grow.
Removing this top section decreases the height of the tree guard to 45 cm, as shown in the diagram below.

The ratio of the volume of the tree guard that is removed to the volume of the tree guard that remains is
Let diagram below shows a trapezium with vertices at `(0, 0), (0, 2), (3, 2)` and `(b, 0)`, where `b` is a real number and `0 < b < 2`.

On the same axes as the trapezium, part of the graph of a cubic polynomial function is drawn. It has the rule `y = ax(x - b)^2`, where `a` is a non-zero real number and `0 ≤ x ≤ b`.
Find `a` in terms of `b`. (3 marks)
The area between the graph of the function and the `x`-axis is removed from the trapezium, as shown in the diagram.

Robyn has a current balance of $347 283.45 in her superannuation account.
Robyn’s employer deposits $350 into this account every fortnight.
This account earns interest at the rate of 2.5% per annum, compounding fortnightly.
Robyn will stop work after 15 years and will no longer receive deposits from her employer.
The balance of her superannuation account at this time will be invested in an annuity that will pay interest at the rate of 3.6% per annum, compounding monthly.
After 234 monthly payments there will be no money left in Robyn’s annuity.
The value of Robyn’s monthly payment will be closest to
A record producer gave the band $50 000 to write and record an album of songs.
This $50 000 was invested in an annuity that provides a monthly payment to the band.
The annuity pays interest at the rate of 3.12% per annum, compounding monthly.
After six months of writing and recording, the band has $32 667.68 remaining in the annuity.
To extend the time that the annuity will last, the band will work for three more months without withdrawing a payment.
After this, the band will receive monthly payments of $3800 for as long as possible.
The annuity will end with one final monthly payment that will be smaller than all of the others.
Calculate the total number of months that this annuity will last. (2 marks)
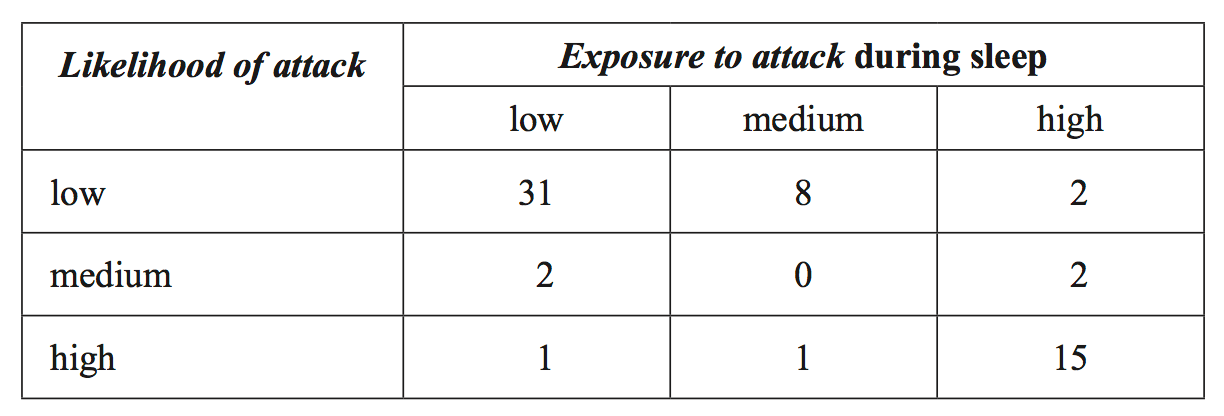
A random sample of 12 mammals drawn from a population of 62 types of mammals was categorized according to two variables.
likelihood of attack (1 = low, 2 = medium, 3 = high)
exposure to attack during sleep (1 = low, 2 = medium, 3 = high)
The data is shown in the following table.


The following two-way frequency table was formed from the data generated when the entire population of 62 types of mammals was similarly categorized.

a.
b. i. `15`
| ii. `text(Percentage)` | `= (2)/(4) xx 100` |
| `= 50%` |
iii. `text(The data supports the contention that animals with a low likelihood)`
`text(of attack is associated with low exposure to attack during sleep.)`
`text(- 91%) \ ({31}/{34}) \ text(of animals with low exposure to attack)`
`text(during sleep, have a low likelihood of attack.)`
`text(- Similarly, 89% of animals with a medium exposure to attack during)`
`text(sleep have a low likelihood of attack.)`
`text(- 11% of animals with a high exposure to attack during sleep have)`
`text(a low likelihood of attack)`
A farm contains four water sources, `P`, `Q`, `R` and `S`.
Part 1
Cows on the farm are free to move between the four water sources.
The change in the number of cows at each of these water sources from week to week is shown in the transition diagram below.

Let `C_n` be the state matrix for the location of the cows in week `n` of 2019.
The state matrix for the location of the cows in week 23 of 2019 is `C_23 = [(180),(200),(240),(180)]{:(P),(Q),(R),(S):}`
The state matrix for the location of the cows in week 24 of 2019 is `C_24 = [(160),(222),(203),(215)]{:(P),(Q),(R),(S):}`
Of the cows expected to be at `Q` in week 24 of 2019, the percentage of these cows at `R` in week 23 of 2019 is closest to
Part 2
Sheep on the farm are also free to move between the four water sources.
The change in the number of sheep at each water source from week to week is shown in matrix `T` below.
`{:(),(),(T=):}{:(qquadqquadqquadtext(this week)),((qquadP,quadQ,quadR,quadS)),([(0.4,0.3,0.2,0.1),(0.2,0.1,0.5,0.3),(0.1,0.3,0.1,0.2),(0.3,0.3,0.2,0.4)]):}{:(),(),({:(P),(Q),(R),(S):}):}{:(),(),(text(next week)):}`
In the long term, 635 sheep are expected to be at `S` each week.
In the long term, the number of sheep expected to be at `Q` each week is closest to
Jamie sold bottles of homemade lemonade to his neighbours on Saturday.
The revenue, in dollars, he made from selling `n` bottles of lemonade is given by
revenue = 3.5`n`
The cost, in dollars, of making `n` bottles of lemonade is given by
cost = 60 + `n`
The profit made by Jamie on Saturday could have been

