SmarterEd

Aussie Maths & Science Teachers: Save your time with SmarterEd

  • Login
  • Get Help
  • About

PHYSICS, M3 2021 VCE 14

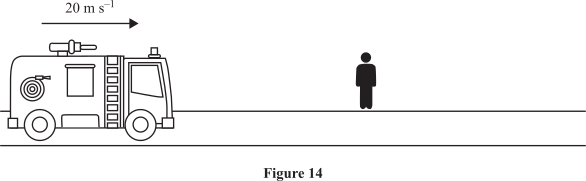
A distant fire truck travelling at 20 ms\(^{-1}\) to a fire has its siren emitting sound at a constant frequency of 500 Hz.

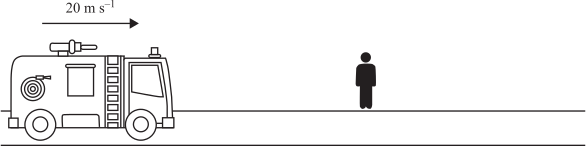
Chris is standing on the edge of the road. Assume that the fire truck is travelling directly towards him as it approaches and directly away from him as it goes past. The arrangement is shown in the diagram.
 

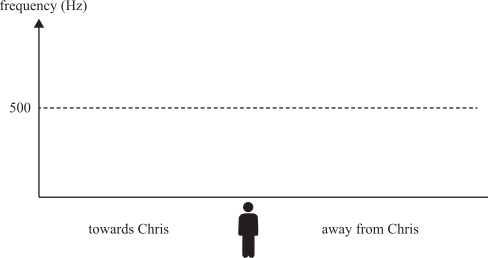
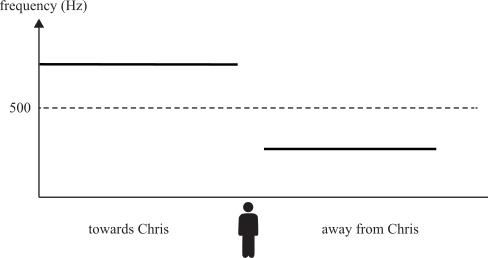
  1. On the diagram below, sketch the frequency that Chris will hear as the truck moves towards him and then moves away from him. The \(500 \text{ Hz}\) siren signal is shown as a dotted line for reference. No calculations are required.   (2 marks)


  1. Name the physics principle involved in Chris’s experience.   (1 mark)
Show Answers Only

a.    
  
b.   The Doppler effect
Show Worked Solution

a.    

♦♦♦ Mean mark (a) 13%.
COMMENT: Poorly completed by most students, many incorrectly drew a smooth line that passed Chris at 500 Hz.
  
b.   The Doppler effect
Filed Under: Sound Waves Tagged With: Band 3, Band 6, smc-4280-10-Doppler effect
PHYSICS, M2 2021 VCE 4

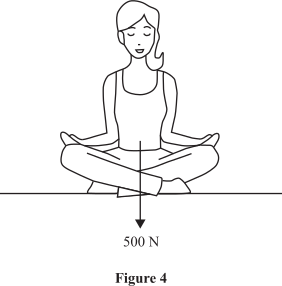
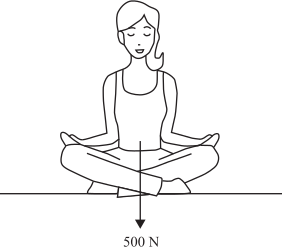
Liesel, a student of yoga, sits on the floor in the lotus pose, as shown in Figure 4. The action force, \(F_g\), on Liesel due to gravity is 500 N down.
 

Identify and explain what the reaction force is to the action force, \(F_{ g }\), shown in the diagram above.   (2 marks)

--- 5 WORK AREA LINES (style=lined) ---

Show Answers Only
  • As the action force, \(F_g\), is the gravitational force on Liesel due to the Earth, then the reaction force is the gravitational force on the Earth due to Liesel, by Newton’s third law of motion.
  • This would be a force of 500 N of Liesel pulling up on the Earth (the Earth being attracted\accelerated to Liesel due to her own gravitational force).
Show Worked Solution
  • As the action force, \(F_g\), is the gravitational force on Liesel due to the Earth, then the reaction force is the gravitational force on the Earth due to Liesel, by Newton’s third law of motion.
  • This would be a force of 500 N of Liesel pulling up on the Earth (the Earth being attracted\accelerated to Liesel due to her own gravitational force).
♦♦♦ Mean mark 9%.
COMMENT: Many students confused Newton’s third law with balancing forces. The 500N pushing up on Liesel is the normal force not the reaction force (which are not the same).

Filed Under: Forces Tagged With: Band 6, smc-4275-20-Newtons 3rd Law

PHYSICS, M4 2022 VCE 4*

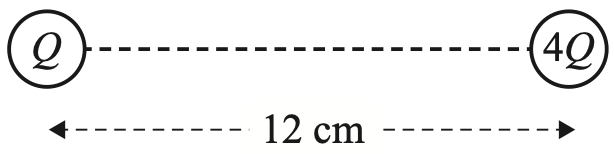
Two point charges, \(Q\) and \(4Q\), are placed 12 cm apart, as shown in the diagram below.
 

On the straight line between the charges \(Q\) and \(4Q\), find where the electric field is zero.   (3 marks)

--- 7 WORK AREA LINES (style=lined) ---

Show Answers Only

\(\text{4cm to the right of}\ Q\)

Show Worked Solution
  • The point where the force on a charged particle \(q\) as a result of the two fields from \(Q\) and \(4Q\) is equal and opposite is where the electric field strength would be zero.
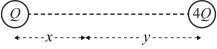
  • Let \(x\) equal the distance from \(Q\) to \(q\) and \(y\) be the distance from \(4Q\) to \(q\) so  \(x +y=12\)
     

\(F_{\text{\(Q\) on \(q\)}}\) \(=F_{\text{\(4Q\) on \(q\)}}\)  
\(\dfrac{1}{4 \pi \varepsilon_0} \dfrac{Q \times q}{x^2}\) \(=\dfrac{1}{4 \pi \varepsilon_0} \dfrac{4Q \times q}{y^2}\)  
\(\dfrac{1}{x^2}\) \(=\dfrac{4}{y^2}\)  
\(y^2\) \(=4x^2\)  
\(y\) \(=2x\)  


  • \(x+2x=12\ \ \Rightarrow\ \ x=4\ \text{cm} \)
♦♦♦ Mean mark 18%.

Filed Under: Electrostatics Tagged With: Band 6, smc-4283-10-Electric fields

PHYSICS, M1 2012 HSC 21

  1. Outline a first-hand investigation that could be performed to measure a value for acceleration due to gravity.   (3 marks)

    --- 8 WORK AREA LINES (style=lined) ---

  2. How would you assess the accuracy of the result of the investigation?   (1 mark)

    --- 2 WORK AREA LINES (style=lined) ---

  3. How would you increase the reliability of the data collected?   (1 mark)

    --- 2 WORK AREA LINES (style=lined) ---

  4. How would you assess the reliability of the data collected?   (1 mark)

    --- 2 WORK AREA LINES (style=lined) ---

Show Only

a.    Timing of a falling mass.

  • Set up an electronic and automatic timing system with sensors to detect the presence of a small falling metal ball.
  • Heights for the ball should be set up between 0.2 m to 1 m with intervals every 0.2 m. To increase the reliability of the results, multiple trials should be conducted at each height and the average falling time for each height should be calculated which can then be used to graph the data.
  • The results should be plotted on a graph of height vs time\(^2\). This uses the equation  \(s=ut +\dfrac{1}{2}at^2\)  where  \(u=0\)  which becomes  \(s=\dfrac{1}{2}at^2\).
  • After plotting the data, the acceleration due to gravity, \(a\), can be calculated using  \(a=\dfrac{2s}{t^2}\), which will make it equal to 2 × the gradient of the line of best fit.

b.    Assessing accuracy of results:

  • Look up known value on a reliable website (e.g. National Measurement Institute).
  • Ensure the value is for the location of the experiment (it can differ slightly).
  • Compare the known value to the value determined experimentally and the closer they are, the greater the accuracy of the experiment.

c.    Increasing data reliability:

  • Conduct multiple trials at each height.
  • Use the average of the calculations as stated in the method above.

d.   Assessing data reliability:

  • Compare the values obtained at a single height.
  • If there is a large variation in the calculations conducted at the same height, the data collected is less reliable.

Show Worked Solution

a.    Timing of a falling mass.

  • Set up an electronic and automatic timing system with sensors to detect the presence of a small falling metal ball.
  • Heights for the ball should be set up between 0.2 m to 1 m with intervals every 0.2 m. To increase the reliability of the results, multiple trials should be conducted at each height and the average falling time for each height should be calculated which can then be used to graph the data.
  • The results should be plotted on a graph of height vs time\(^2\). This uses the equation  \(s=ut +\dfrac{1}{2}at^2\)  where  \(u=0\)  which becomes  \(s=\dfrac{1}{2}at^2\).
  • After plotting the data, the acceleration due to gravity, \(a\), can be calculated using  \(a=\dfrac{2s}{t^2}\), which will make it equal to 2 × the gradient of the line of best fit.
♦ Mean mark (a) 55%.

b.    Assessing accuracy of results:

  • Look up known value on a reliable website (e.g. National Measurement Institute).
  • Ensure the value is for the location of the experiment (it can differ slightly).
  • Compare the known value to the value determined experimentally and the closer they are, the greater the accuracy of the experiment.
♦♦♦ Mean mark (b) 26%.

c.    Increasing data reliability:

  • Conduct multiple trials at each height.
  • Use the average of the calculations as stated in the method above.

d.   Assessing data reliability:

  • Compare the values obtained at a single height.
  • If there is a large variation in the calculations conducted at the same height, the data collected is less reliable.
♦♦♦ Mean mark (d) 7%.

Filed Under: Motion in a Straight Line Tagged With: Band 3, Band 5, Band 6, smc-4273-30-Acceleration

Complex Numbers, EXT2 N1 2023 HSC 7 MC

Which of the following statements about complex numbers is true?

  1. For all real numbers \(x, y, \theta\)  with  \(x \neq 0\),

\(\tan \theta=\dfrac{y}{x} \ \Rightarrow \ x+i y=r e^{i \theta}\), for some real number \(r\).

  1. For all non-zero complex numbers \(z_1\) and \(z_2\),

\(\operatorname{Arg}\left(z_1\right)=\theta_1\)  and  \(\operatorname{Arg}\left(z_2\right)=\theta_2 \ \Rightarrow \ \operatorname{Arg}\left(z_1 z_2\right)=\theta_1+\theta_2,\)

where \(\operatorname{Arg}\) denotes the principal argument.

  1. For all real numbers \(r_1, r_2, \theta_1, \theta_2\)  with  \(r_1, r_2>0\),

\(r_1 e^{i \theta_1}=r_2 e^{i \theta_2} \ \Rightarrow \ r_1=r_2\)  and  \(\theta_1=\theta_2 \text {. }\)

  1. For all real numbers \(x, y, r, \theta\)  with  \(r>0\)  and  \(x \neq 0\),

\(x+i y=r e^{i \theta} \ \Rightarrow \ \theta=\arctan  \Big(\dfrac{y}{x} \Big)\)

Show Answers Only

\(A\)

Show Worked Solution

\(\text{Eliminating options by contradiction}\)

\(\text{Option}\ B:\)

\(\text{If}\ \ \theta_1= \pi\ \ \text{and}\ \ \theta_2=\dfrac{\pi}{2}, \ \theta_1 + \theta_2 = \dfrac{3\pi}{2} > \pi \)

\( -\pi < \operatorname{Arg}\left(z_1 z_2\right) < \pi\ \ \ \  \text{(Eliminate}\ B) \)

♦♦♦ Mean mark 18%.

\(\text{Option}\ C:\)

\(\text{If}\ \ \theta_1= \pi\ \ \text{and}\ \ \theta_2=3\pi, \ \operatorname{Arg}(e^{i\pi}) =  \operatorname{Arg}(e^{3i\pi}) \)

\( \text{However,}\ \ \theta_1 \neq \theta_2\ \ \ \  \text{(Eliminate}\ C) \)
 

\(\text{Option}\ D:\)

\(\text{If}\ \ x=y=-1, \ \theta=-\dfrac{3\pi}{4} \ \ (r>0) \)

\( \text{However,}\ \ \arctan\Big(\dfrac{-1}{-1}\Big)=\dfrac{\pi}{4} \ \ \  \text{(Eliminate}\ D) \)

\(\Rightarrow A\)

Filed Under: Argand Diagrams and Mod/Arg form, Exponential Form Tagged With: Band 6, smc-1049-40-Mod/Arg arithmetic, smc-1191-70-Other

PHYSICS, M4 2017 HSC 8 MC

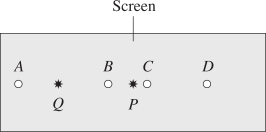
An electron is fired in a vacuum towards a screen. With no electric field being applied, the electron hits the screen at \(P\). A uniform electric field is turned on and another electron is fired towards the screen from the same location, at the same velocity, striking the screen at point \(Q\).

With the electric field still turned on, a proton is fired towards the screen from the same starting point as the electrons and with the same velocity.

At what point does the proton strike the screen?

  1. \(A\)
  2. \(B\)
  3. \(C\)
  4. \(D\)
Show Answers Only

\(C\)

Show Worked Solution
  • As the proton has an equal but opposite charge to the electron it will experience a force in the opposite direction. Hence it will hit the screen to the right of \(P\).
  • Due to the proton having a greater mass, it will be deflected by a smaller amount and so will hit the screen at \(C\).

\(\Rightarrow C\)

♦♦♦ Mean mark 25%.

Filed Under: Electrostatics Tagged With: Band 6, smc-4283-30-Forces on charges

CHEMISTRY, M8 2023 HSC 36

An organic reaction pathway involving compounds \(\text{A, B,}\) and \(\text{C}\) is shown in the flow chart.
 

The molar mass of \(\text{A}\) is 84.156 g mol\(^{-1}\).

A chemist obtained some spectral data for the compounds as shown.
 

\( \text{Data from} \ ^{1} \text{H NMR spectrum of compound C} \)
 \( Chemical \ Shift \ \text{(ppm)} \) \( Relative \ peak \ area \) \( Splitting \ pattern \)
\(1.01\) \(3\) \(\text{Triplet}\)
\(1.05\) \(3\) \(\text{Triplet}\)
\(1.65\) \(2\) \(\text{Multiplet}\)
\(2.42\) \(2\) \(\text{Triplet}\)
\(2.46\) \(2\) \(\text{Quartet}\)
\( ^{1} \text{H NMR chemical shift data}\)
\( Type \ of \ proton \)  \(  \text{δ/ppm} \)
\( \ce{R - C\textbf{H}3,R - C\textbf{H}2 - R}\) \(0.7-1.7\)
\( \left.\begin{array}{l}\ce{\textbf{H}3C - CO - \\-C\textbf{H}2 - CO -}\end{array}\right\} \begin{aligned} & \text { (aldehydes, ketones,} \\ &\text{carboxylic acids or esters) }\end{aligned}\) \(2.0-2.6\) 
\( \ce{R - C\textbf{H}O} \) \(9.4-10.00\)
\( \ce{R - COO\textbf{H}} \) \(9.0-13.0\)
 

Identify the functional group present in each of compounds \(\text{A}\) to \(\text{C}\) and draw the structure of each compound. Justify your answer with reference to the information provided.  (9 marks) 

--- 28 WORK AREA LINES (style=lined) ---

Show Answers Only

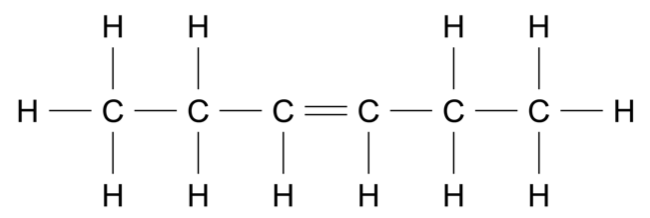
Compound \(\text{A}\): Alkene


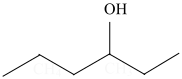
Compound \(\text{B}\): Secondary alcohol

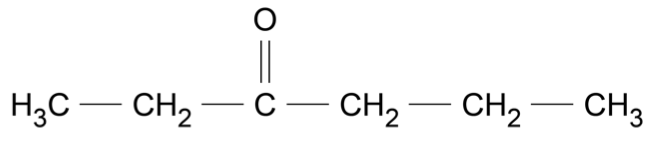
Compound \(\text{C}\): Ketone


Reasoning as follows:

  • Compound \(\text{A}\) is able to undergo an addition reaction to add water across a \(\ce{C=C}\) bond  \(\Rightarrow \)  Alkene
  • Compound \(\text{B}\) is the product of the above hydration reaction and is therefore an alcohol.
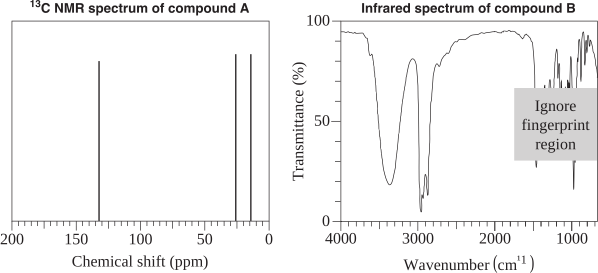
  • The \(\ce{^{13}C\ NMR}\) spectrum of Compound \(\text{A}\) confirms it is an alkene (132 ppm peak corresponding to the \(\ce{C=C}\) atoms). 3 spectrum peaks indicate 3 carbon environments. The molar mass of compound \(\text{A}\) is 84.156 g mol\(^{-1}\) which suggests symmetry within the molecule.
  • The Infrared Spectrum of Compound \(\text{B}\) has a broad peak at approximately 3400 cm\(^{-1}\). This indicates the presence of an hydroxyl group and confirms \(\text{B}\) is an alcohol.
  • Compound \(\text{C}\) is produced by the oxidation of Compound \(\text{B}\) with acidified potassium permanganate.
  • Compound \(\text{C}\) is a carboxylic acid if \(\text{B}\) is a primary alcohol or a ketone if \(\text{B}\) is a secondary alcohol.
  • Since the \(\ce{^{1}H NMR}\) spectrum of \(\text{C}\) does not show any peaks between 9.0 − 13.0 ppm, it cannot be a carboxylic acid. Compound \(\text{C}\) is therefore a ketone and Compound \(\text{B}\) is a secondary alcohol.
  • The \(\ce{^{1}H NMR}\) spectrum shows 5 peaks \(\Rightarrow \) 5 hydrogen environments.
  • Chemical shift and splitting patterns information indicate:
  • 1.01 ppm – 1.05 ppm: \(\ce{CH3}\) (next to a \(\ce{CH2}\))
  •   1.65 ppm: \(\ce{CH2}\) (with multiple neighbouring hydrogens)
  •   2.42 ppm: \(\ce{CH2}\) (next to the ketone \(\ce{C=O}\) and a \(\ce{CH2}\))
  •   2.46 ppm: \(\ce{CH2}\) (next to the ketone \(\ce{C=O}\) and a \(\ce{CH3}\))
Show Worked Solution

Compound \(\text{A}\): Alkene


Compound \(\text{B}\): Secondary alcohol

Compound \(\text{C}\): Ketone


Reasoning as follows:

  • Compound \(\text{A}\) is able to undergo an addition reaction to add water across a \(\ce{C=C}\) bond  \(\Rightarrow \)  Alkene
  • Compound \(\text{B}\) is the product of the above hydration reaction and is therefore an alcohol.
  • The \(\ce{^{13}C\ NMR}\) spectrum of Compound \(\text{A}\) confirms it is an alkene (132 ppm peak corresponding to the \(\ce{C=C}\) atoms). 3 spectrum peaks indicate 3 carbon environments. The molar mass of compound \(\text{A}\) is 84.156 g mol\(^{-1}\) which suggests symmetry within the molecule.
  • The Infrared Spectrum of Compound \(\text{B}\) has a broad peak at approximately 3400 cm\(^{-1}\). This indicates the presence of an hydroxyl group and confirms \(\text{B}\) is an alcohol.
  • Compound \(\text{C}\) is produced by the oxidation of Compound \(\text{B}\) with acidified potassium permanganate.
  • Compound \(\text{C}\) is a carboxylic acid if \(\text{B}\) is a primary alcohol or a ketone if \(\text{B}\) is a secondary alcohol.
  • Since the \(\ce{^{1}H NMR}\) spectrum of \(\text{C}\) does not show any peaks between 9.0 − 13.0 ppm, it cannot be a carboxylic acid. Compound \(\text{C}\) is therefore a ketone and Compound \(\text{B}\) is a secondary alcohol.
  • The \(\ce{^{1}H NMR}\) spectrum shows 5 peaks \(\Rightarrow \) 5 hydrogen environments.
  • Chemical shift and splitting patterns information indicate:
  • 1.01 ppm – 1.05 ppm: \(\ce{CH3}\) (next to a \(\ce{CH2}\))
  •   1.65 ppm: \(\ce{CH2}\) (with multiple neighbouring hydrogens)
  •   2.42 ppm: \(\ce{CH2}\) (next to the ketone \(\ce{C=O}\) and a \(\ce{CH2}\))
  •   2.46 ppm: \(\ce{CH2}\) (next to the ketone \(\ce{C=O}\) and a \(\ce{CH3}\))

Filed Under: Organic Substances Tagged With: Band 4, Band 5, Band 6, smc-3683-10-C NMR, smc-3683-20-H NMR, smc-3683-50-Combining Techniques, smc-3683-55-C=C Bonds, smc-3683-60-Hydroxyl Group, smc-3683-70-Carboxylic Acid Group

PHYSICS, M8 2023 HSC 20 MC

In 1995 , observational evidence showed that Hubble's description of the expansion of the universe was inaccurate.

It was discovered that the expansion of the universe was accelerating. This discovery was based on observations of light from galaxies whose distances from Earth could be accurately measured, and were significantly more distant than any observed by Hubble.

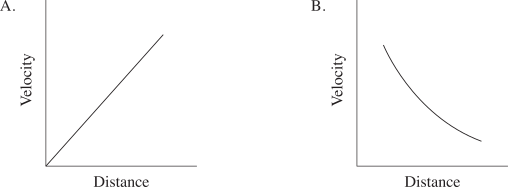
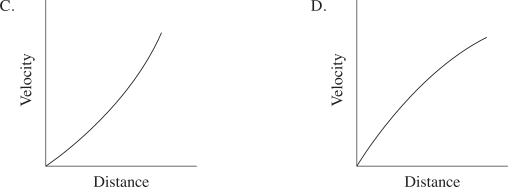
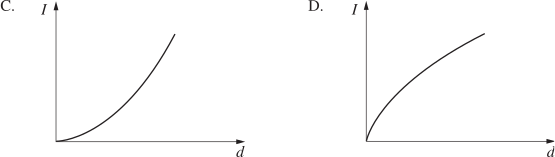
Which graph relating velocities of galaxies to their distances from Earth is consistent with an accelerating rate of expansion of the universe?


Show Answers Only

\(D\)

Show Worked Solution
  • Light from the most distant galaxies has taken the longest time to reach the Earth and so distance can also be regarded as a measure of time.
  • The light from these galaxies was around when the acceleration of the universe was smaller than it is today.
  • Hence, it is expected that the gradient of the graph at large distances from Earth will be flatter as the acceleration of the universe was smaller.
  • Light coming from galaxies closer to the Earth is younger and so the closer the distance a galaxy is from Earth, the steeper the curve. 
  • The difference in velocities between galaxies closer to the Earth is greater due to the accelerating rate of the universe.

\(\Rightarrow D\)

♦♦♦ Mean mark 11%.

Filed Under: Origins of Elements Tagged With: Band 6, smc-3700-30-Hubble

PHYSICS, M8 2023 HSC 33

Consider the following statement.

The interaction of subatomic particles with fields, as well as with other types of particles and matter, has increased our understanding of processes that occur in the physical world and of the properties of the subatomic particles themselves.

Justify this statement with reference to observations that have been made and experiments that scientists have carried out.   (9 marks)

--- 22 WORK AREA LINES (style=lined) ---

Show Answers Only

Thomson’s Experiment:

  • Thomson’s experiment tested the interaction of cathode rays (which he discovered were negatively charged subatomic particles and named them electrons) with electric and magnetic fields to determine the charge to mass ratio (\(\dfrac{q}{m}\)) of the electrons.
  • Using both the electric and magnetic fields, Thomson balanced the forces to ensure the cathode rays travelled through undeflected. Thus:
  •    \(F_E = F_B \ \ \Rightarrow \ \ qE=qvB \ \ \Rightarrow \ \ v=\dfrac{E}{B}\)
  • Using the magnetic field and known velocity, the cathode rays travelled in a circular path due to their negative charges interacting with the magnetic field. Thus:
  •    \(F_c=F_B\ \ \Rightarrow \ \ \dfrac{mv^2}{r}=qvB \ \ \Rightarrow \ \ \dfrac{q}{m}=\dfrac{v}{Br}\)
  • The charge to mass ratio was determined to be 0.77 \(\times\) 10\(^{11}\) Ckg\(^{-1}\) and was \(\dfrac{1}{1800}\) times smaller than the charge to mass ratio of the proton. The number was also the same regardless of the metal cathode used, thus Thomson determined this particle was a fundamental constitute of all matter. 
  • Therefore, the statement is true as the observations and experiment undertaken by Thomson using the interactions of particles and fields led to a greater understanding of the electrons. 

Chadwick’s Experiment:

  • In Chadwick’s experiment, he irradiated beryllium with alpha particles which emitted a deeply penetrating radiation with neutral charge. When this particle was directed into paraffin wax, protons were emitted and detected on a screen. 
  • Using the Laws of conservation of energy and momentum, Chadwick proposed the idea of a neutral particle and named it the neutron. He determined that the mass of this particle must be slightly greater than the mass of the proton.
  • Therefore, Chadwick’s observations of the neutrons led to a greater understanding of the properties of the particle, thus justifying the statement above.  

Observations using particle accelerators:

  • Particle accelerators have led to many new scientific discoveries as a result of the interaction of particles with fields and particle-particle interactions.
  • Scientists have come to a greater understanding of quarks and other subatomic particles within the standard model of matter and processes of the physical world including decay trails and momentum dilation.
  • The Large Hadron Collider (LHC) can accelerate particles close to the speed of light using electric and magnetic fields. When particles collide, the kinetic energy is converted into mass using Einstein’s equation  \(E=mc^2\).
  • The new particles formed as a result of these collisions led to the development of the standard model and increased scientific understanding of subatomic particles including up and down quarks, W/Z bosons and the Higgs Boson.
  • These subatomic particles have very short lifetimes before decaying into more stable particles. Our knowledge of them is primarily from studying their decay properties which has led to a greater understanding of particle decay trails.
  • Observations of interactions within particles accelerators has also increased the scientific understanding of momentum dilation. As particles reach relativistic speeds, a greater force is required to accelerate them than classical physics predicts which is due to mass and momentum dilation. 

Other Answers could include:

  • Millikan’s Oil drop experiment.
  • The photoelectric effect.
  • Geiger Marsden experiment.
  • Davisson Germer experiment.
  • Observations of Muons.
Show Worked Solution

One (of many) exemplar responses.

Thomson’s Experiment:

  • Thomson’s experiment tested the interaction of cathode rays (which he discovered were negatively charged subatomic particles and named them electrons) with electric and magnetic fields to determine the charge to mass ratio (\(\dfrac{q}{m}\)) of the electrons.
  • Using both the electric and magnetic fields, Thomson balanced the forces to ensure the cathode rays travelled through undeflected. Thus:
  •    \(F_E = F_B \ \ \Rightarrow \ \ qE=qvB \ \ \Rightarrow \ \ v=\dfrac{E}{B}\)
  • Using the magnetic field and known velocity, the cathode rays travelled in a circular path due to their negative charges interacting with the magnetic field. Thus:
  •    \(F_c=F_B\ \ \Rightarrow \ \ \dfrac{mv^2}{r}=qvB \ \ \Rightarrow \ \ \dfrac{q}{m}=\dfrac{v}{Br}\)
  • The charge to mass ratio was determined to be 0.77 \(\times\) 10\(^{11}\) Ckg\(^{-1}\) and was \(\dfrac{1}{1800}\) times smaller than the charge to mass ratio of the proton. The number was also the same regardless of the metal cathode used, thus Thomson determined this particle was a fundamental constitute of all matter. 
  • Therefore, the statement is true as the observations and experiment undertaken by Thomson using the interactions of particles and fields led to a greater understanding of the electrons.

Chadwick’s Experiment:

  • In Chadwick’s experiment, he irradiated beryllium with alpha particles which emitted a deeply penetrating radiation with neutral charge. When this particle was directed into paraffin wax, protons were emitted and detected on a screen. 
  • Using the Laws of conservation of energy and momentum, Chadwick proposed the idea of a neutral particle and named it the neutron. He determined that the mass of this particle must be slightly greater than the mass of the proton.
  • Therefore, Chadwick’s observations of the neutrons led to a greater understanding of the properties of the particle, thus justifying the statement above.  

Observations using particle accelerators:

  • Particle accelerators have led to many new scientific discoveries as a result of the interaction of particles with fields and particle-particle interactions.
  • Scientists have come to a greater understanding of quarks and other subatomic particles within the standard model of matter and processes of the physical world including decay trails and momentum dilation.
  • The Large Hadron Collider (LHC) can accelerate particles close to the speed of light using electric and magnetic fields. When particles collide, the kinetic energy is converted into mass using Einstein’s equation  \(E=mc^2\).
  • The new particles formed as a result of these collisions led to the development of the standard model and increased scientific understanding of subatomic particles including up and down quarks, W/Z bosons and the Higgs Boson.
  • These subatomic particles have very short lifetimes before decaying into more stable particles. Our knowledge of them is primarily from studying their decay properties which has led to a greater understanding of particle decay trails.
  • Observations of interactions within particles accelerators has also increased the scientific understanding of momentum dilation. As particles reach relativistic speeds, a greater force is required to accelerate them than classical physics predicts which is due to mass and momentum dilation. 

Other Answers could include:

  • Millikan’s Oil drop experiment.
  • The photoelectric effect.
  • Geiger Marsden experiment.
  • Davisson Germer experiment.
  • Observations of Muons.
♦♦ Mean mark 45%.

Filed Under: Deep Inside the Atom, Quantum Mechanical Nature of the Atom, Structure of the Atom Tagged With: Band 5, Band 6, smc-3701-10-Cathode Rays and Thomson, smc-3701-20-Millikan, smc-3701-60-Chadwick, smc-3702-40-De Broglie, smc-3704-10-Standard Model, smc-3704-25-Linear Accelerator

CHEMISTRY, M5 2023 HSC 37

When performing industrial reductions with \(\mathrm{CO}(\mathrm{g})\), the following equilibrium is of great importance.

\( \ce{2CO(g) \rightleftharpoons CO2(g) + C(s) \quad \quad $K$_{e q}  = 10.00  at 1095 K } \)

A 1.00 L sealed vessel at a temperature of 1095 K contains \( \ce{CO(g)} \) at a concentration of 1.10 × 10\(^{-2}\) mol L\(^{-1}\), \(\ce{CO2(g)} \) at a concentration of 1.21 × 10\(^{-3}\) mol L\(^{-1}\), and excess solid carbon.

  1. Is the system at equilibrium? Support your answer with calculations.   (2 marks)

--- 3 WORK AREA LINES (style=lined) ---

  1. Carbon dioxide gas is added to the system above and the mixture comes to equilibrium. The equilibrium concentrations of \( \ce{CO(g)}\) and \(\ce{CO2(g)} \) are equal. Excess solid carbon is present and the temperature remains at 1095 K.

    Calculate the amount (in mol) of carbon dioxide added to the system.   (3 marks)

--- 14 WORK AREA LINES (style=lined) ---

Show Answers Only

a.    \(Q=\dfrac{\ce{[CO2]}}{\ce{[CO]^2}}=\dfrac{1.21 \times 10^{-3}}{(1.10 \times 10^{-2})^2}=10.0\)

\(\text{Since}\ \ Q=K_{eq},\ \text{system is in equilibrium.}\)
 

b.    \(0.143\ \text{mol} \)

Show Worked Solution

a.    \(Q=\dfrac{\ce{[CO2]}}{\ce{[CO]^2}}=\dfrac{1.21 \times 10^{-3}}{(1.10 \times 10^{-2})^2}=10.0\)

\(\text{Since}\ \ Q=K_{eq},\ \text{system is in equilibrium.}\)
 

b.    \(\ce{\text{Given}\ \ [CO]=[CO2]}, \)

\(K_{eq} =\dfrac{\ce{[CO2]}}{\ce{[CO]^2}} =\dfrac{1}{\ce{[CO]}} = 10.00\)

\(\Rightarrow \ce{[CO] = \dfrac{1}{10.00} = 0.1000 \text{mol L}^{-1}} \)

\(\Rightarrow \ce{[CO2] = 0.1000 \text{mol L}^{-1}} \)

From this point, the change in \(\ce{CO}\) and \(\ce{CO2}\) concentrations can be calculated…

♦♦♦ Mean mark (b) 24%.

\begin{array} {|l|c|c|c|}
\hline  & \ce{2CO(g)} & \ce{CO2(g)} & \ce{C(s)} \\
\hline \text{Initial} & 1.10 \times 10^{-2} &  1.21 \times 10^{-3} &  \\
\hline \text{Change} & +0.0890 & +0.0988 &  \\
\hline \text{Equilibrium} & \ \ \ 0.1000 & \ \ \ 0.1000 &  \\
\hline \end{array}

However, the change in moles of \(\ce{CO2}\) in the system consists of:

  • Change in \(\ce{CO2}\) concentration
  • Change in \(\ce{CO}\) concentration (as some of the added \(\ce{CO2}\) was converted into \(\ce{CO}\))

\(\ce{n(CO2)\ \text{required to increase}\ [CO] by 0.0988\ \text{mol}\ \ \ \text{(1 litre vessel)}}\)

\(\ce{\text{Formula ratio shows}\ \ CO2:CO = 1\ \text{mol} : 2\ \text{mol}} \)

\(\ce{n(CO2)\ \text{to add to increase}\ [CO2] = 0.0988\ \text{mol}\ \ \ \text{(1 litre vessel)}}\)

\(\ce{n(CO2)_{\text{total to add}} = 0.0988\ \text{mol} + n(CO2\ \text{to make CO)}} \)

\(\ce{n(CO2)\ \text{to add to increase}\ [CO] = \dfrac{0.0890}{2} = 0.0445\ \text{mol}}\)

\(\ce{n(CO2)_{\text{total to add}} = 0.0988 + 0.0445 = 0.143\ \text{mol}} \)

Filed Under: Equilibrium Constant Tagged With: Band 4, Band 6, smc-3671-20-Calcs given K(eq), smc-3671-35-Chemical equation given

PHYSICS, M5 2023 HSC 32

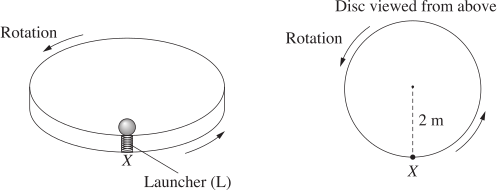
A horizontal disc rotates at 3 revolutions per second around its centre, with the top of the disc at ground level.

At 2 m from the centre of the disc, a ball is held in place at ground level on the top of the disc by a spring-loaded projectile launcher. At position \(X\), the launcher fires the ball vertically upward with a velocity of 5.72 m s\(^{-1}\).


Calculate the ball's position relative to the launcher's new position, at the instant the ball hits the ground.   (7 marks)

--- 14 WORK AREA LINES (style=lined) ---

Show Answers Only

The position of the ball relative to the launcher’s new position is 44.19 m, 5.2\(^{\circ}\) below the horizontal line of the launcher.

Show Worked Solution

Find horizontal velocity of the ball, \(v_{\text{x}}\):

\(T=\dfrac{1}{3} = 0.333\ \text{seconds} \)

\(v_{\text{x}}=\dfrac{2\pi r}{T}=\dfrac{2\pi \times 2}{0.333…}=37.699\ \text{ms}^{-1}\)

♦ Mean mark 53%.

Calculating the time of flight, \(t_1\):

Let  \(t_2\) = time to max height

\(v_{\text{y}}\) \(=u_{\text{y}} + at_2\)  
\(t_2\) \(=\dfrac{v_{\text{y}}-u_{\text{y}}}{a}=\dfrac{0-5.72}{-9.8}=0.58367\ \text{sec} \)  


Time of flight (\(t_1)= 2 \times t_2= 1.167\ \text{s}\)
 

Range of the ball from launch position:

\(s_{\text{x}}=v_{\text{x}} \times t_2=37.699 \times 1.167=44.0\ \text{m}\)
 

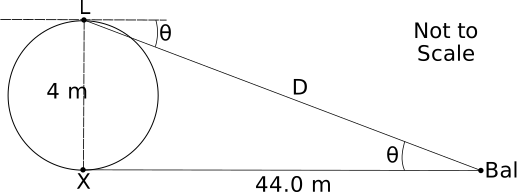
Position of the launcher (L) when the ball hits the ground:

  • Revolutions (before ball lands) = 3 × 1.167 = 3.5 revolutions
  • The Launcher (L) is \(\frac{1}{2}\) a revolution past its starting point.
  • Thus, the positions of both the ball and the launcher at the time when the ball hits the ground can be demonstrated in the diagram below.


\(D\) \(=\sqrt{44.0^2+4^2}=44.18\ \text{m}\)  
\(\theta\) \(=\tan ^{-1}\left(\dfrac{4}{44.0}\right)=5.2^{\circ}\)  


  • The final position of the ball relative to \(L\) is 44.18 m, 5.2\(^{\circ}\) below the horizontal line at \(L\).

Filed Under: Circular Motion, Projectile Motion Tagged With: Band 5, Band 6, smc-3690-25-Range, smc-3690-35-Initial Velocity, smc-3690-45-Time of Flight, smc-3691-20-Applications of Circular Motion

PHYSICS, M6 2023 HSC 31

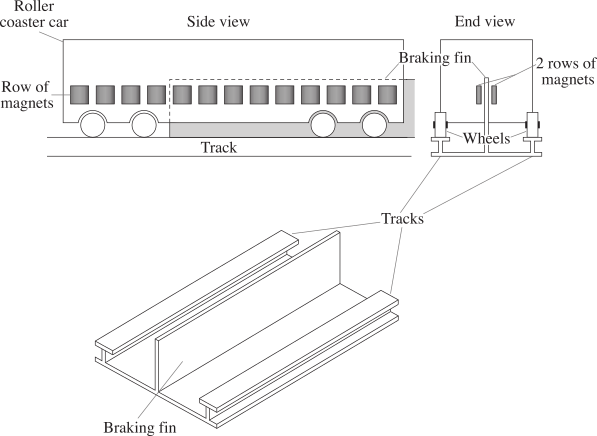
A roller coaster uses a braking system represented by the diagrams.
 

When the roller coaster car reaches the end of the ride, the two rows of permanent magnets on the car pass on either side of a thick aluminium conductor called a braking fin.

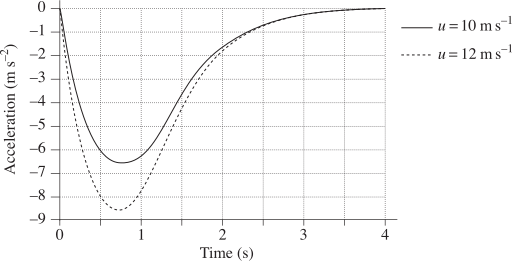
The graph shows the acceleration of the roller coaster reaching the braking fin at two different speeds.


Explain the similarities and differences between these two sets of data.   (5 marks)

--- 15 WORK AREA LINES (style=lined) ---

Show Answers Only

Similarities:

  • Both graphs show peak negative acceleration at 0.8 seconds.
  • Acceleration curves converge at 3-4 seconds as both cars stop simultaneously.
  • The braking fin passing through permanent magnets experiences flux change, inducing EMF (Faraday’s Law).
  • This EMF creates eddy currents that oppose motion (Lenz’s Law), causing negative acceleration
  • After peak deceleration, magnetic braking effects decrease as slower speeds reduce flux change and eddy current magnitude.
  • Kinetic energy continuously converts to electrical resistive heating through eddy currents.

Differences:

  • The cart with \(u = 12\ \text{ms}^{-1}\). experiences greater negative acceleration than the cart where \(u = 10\ \text{ms}^{-1}\).
  • Higher initial velocity causes greater flux change rate in the braking fin.
  • This produces stronger induced EMF and larger eddy currents.
  • Since repulsive force is proportional to eddy current strength, the faster cart experiences greater deceleration.

Show Worked Solution

Similarities:

  • Both graphs show peak negative acceleration at 0.8 seconds.
  • Acceleration curves converge at 3-4 seconds as both cars stop simultaneously.
  • The braking fin passing through permanent magnets experiences flux change, inducing EMF (Faraday’s Law).
  • This EMF creates eddy currents that oppose motion (Lenz’s Law), causing negative acceleration
  • After peak deceleration, magnetic braking effects decrease as slower speeds reduce flux change and eddy current magnitude.
  • Kinetic energy continuously converts to electrical resistive heating through eddy currents.

Differences:

  • The cart with \(u = 12\ \text{ms}^{-1}\). experiences greater negative acceleration than the cart where \(u = 10\ \text{ms}^{-1}\).
  • Higher initial velocity causes greater flux change rate in the braking fin.
  • This produces stronger induced EMF and larger eddy currents.
  • Since repulsive force is proportional to eddy current strength, the faster cart experiences greater deceleration.

Filed Under: Applications of the Motor Effect Tagged With: Band 5, Band 6, smc-3695-70-Magnetic Breaking

BIOLOGY, M7 2023 HSC 6 MC

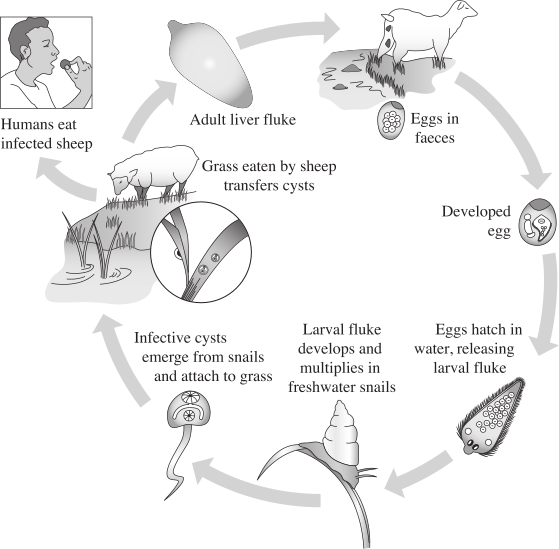
Liver fluke is a disease caused by parasites that infect grazing animals, including sheep. The life cycle of the liver fluke is shown.


How could the transmission of this disease to humans be prevented?

  1. Eradicating the snails
  2. Administering antibiotics to sheep
  3. Wearing gloves when handling sheep
  4. Regularly spraying fields with herbicides
Show Answers Only

\(A\)

Show Worked Solution
  • Option \(A\) will serve as an effective option which will interrupt the lifecycle of liver fluke and hence prevent it’s transmission to humans.

\(\Rightarrow A\)

♦♦♦ Mean mark 26%.

Filed Under: Prevention, Treatment and Control Tagged With: Band 6, smc-3658-30-Procedures to Prevent Spread

Vectors, EXT2 V1 2023 HSC 15c

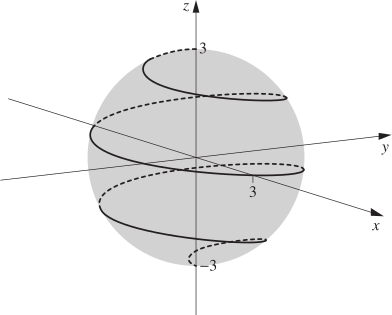
A curve \( \mathcal{C}\) spirals 3 times around the sphere centred at the origin and with radius 3, as shown.

A particle is initially at the point \((0,0,-3)\) and moves along the curve \(\mathcal{C}\) on the surface of the sphere, ending at the point \((0,0,3)\).
 

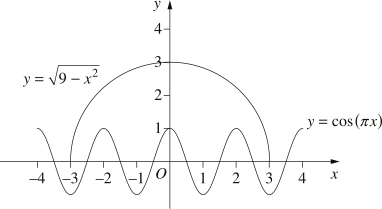
By using the diagram below, which shows the graphs of the functions  \(f(x)=\cos (\pi x)\)  and  \(g(x)=\sqrt{9-x^2}\), and considering the graph  \(y=f(x)g(x)\), give a possible set of parametric equations that describe the curve \( \mathcal{C}\).  (3 marks)
 

--- 6 WORK AREA LINES (style=lined) ---

Show Answers Only

\(x= \cos{(\pi t)}\sqrt{9-t^2} \)

\(y= -\sin{(\pi t)}\sqrt{9-t^2} \)

\( z=t \)

Show Worked Solution

\(\text{Since the curve lies on a sphere with radius 3:}\)

\(x^2+y^2+z^2=3^3 \)

\(\text{Considering the graph}\ \ y=\cos (\pi t)\sqrt{9-t^2}\ \ \text{(as per hint)} \)

\(\Big(\cos (\pi t)\sqrt{9-t^2}\Big)^2+\Big(\sin (\pi t)\sqrt{9-t^2}\Big)^2+t^2=3^2 \ \ …\ (1) \)

\(\text{Since}\ z\ \text{increases and}\ x\ \text{and}\ y\ \text{change signs} \)

\( \Rightarrow z=t \)
 

\(\text{In order to satisfy the equation in (1): } \)

\( x,y\ \text{must be one of }\ \ \pm \cos{(\pi t)}\sqrt{9-t^2}\ \ \text{or}\ \ \pm \sin{(\pi t)}\sqrt{9-t^2} \)
 

\(\text{At}\ \ z=0,\ t=0, \ x=3\ \ \text{(from graph):} \)

\( \Rightarrow x= \cos{(\pi t)}\sqrt{9-t^2} \)
 

\(\text{At}\ \ z=0+\epsilon,\ t=0+\epsilon, \ y \lt 0\ \ \text{(from graph):} \)

\( \Rightarrow y= -\sin{(\pi t)}\sqrt{9-t^2} \)

♦♦♦ Mean mark 22%.

Filed Under: Equations of Lines and Curves, Vectors and Geometry Tagged With: Band 6, smc-1210-50-Circle/Sphere, smc-1210-85-Parametric, smc-7426-50-Circle/Sphere

Measurement, STD1 M5 2023 HSC 31

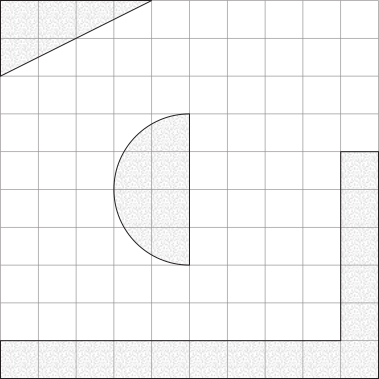
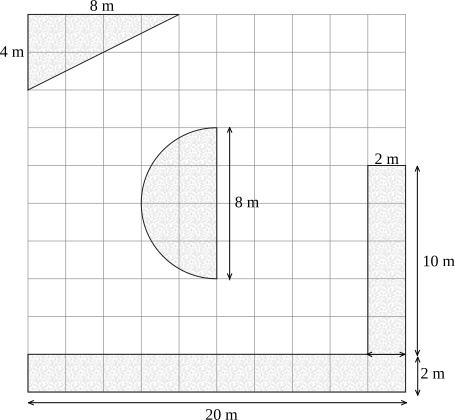
A scale drawing of a garden plan, where 1 cm represents 2 m, is shown.

The shaded areas in the diagram represent the garden beds.
 

Woodchips will be laid as a mulch on the garden beds to a depth of \(10 cm\).

What is the volume of woodchips required?   (5 marks)

Show Only

\(10.113\ \text{m}^3\)

Show Worked Solution

\(\text{Scale }\longrightarrow 1\ \text{cm}=2\ \text{m}\)
 

\(\text{Area of triangle}=\dfrac{1}{2}\times 8\times 4=16\ \text{m}^2\)

\(\text{Area of L-shape}=2\times 10+2\times 20=60\ \text{m}^2\)

\(\text{Area of semi-cirle}=\dfrac{1}{2}\times \pi\times 4^2=25.13\dots\ \text{m}^2\)

\(\text{Total Area}=16+60+25.13=101.13\ \text{m}^2\)

\(\text{Volume}=101.13\times 0.1=10.113\ \text{m}^3\)


♦♦♦♦ Mean mark 15%.

Filed Under: M5 Scale Drawings (Y12), Ratios Tagged With: Band 6, smc-1105-20-Maps and Scale Drawings, smc-6858-10-Maps and Scale Drawings

Measurement, STD1 M3 2023 HSC 29

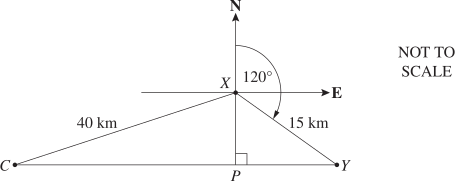
The diagram shows the location of three places \(X\), \(Y\) and \(C\).

\(Y\) is on a bearing of 120° and 15 km from \(X\).

\(C\) is 40 km from \(X\) and lies due west of \(Y\).

\(P\) lies on the line joining \(C\) and \(Y\) and is due south of \(X\).
  

  1. Find the distance from \(X\) to \(P\).   (2 marks)

    --- 4 WORK AREA LINES (style=lined) ---

  2. What is the bearing of \(C\) from \(X\), to the nearest degree?   (2 marks)

    --- 5 WORK AREA LINES (style=lined) ---

Show Answers Only

a.    \(7.5\ \text{km}\)

b.    \(259^{\circ}\)

Show Worked Solution

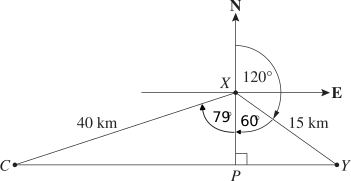
a.    \(\text{In}\ \Delta XPY:\)

\(\angle PXY=180-120=60^{\circ}\)

\(\cos 60^{\circ}\) \(=\dfrac{XP}{15}\)
\(XP\) \(=15\times \cos 60^{\circ}\)
  \(=7.5\ \text{km}\)

♦♦ Mean mark (a) 24%.

b.    \(\text{In}\ \Delta XPC:\)

\(\text{Let}\ \theta = \angle CXP\)

\(\cos \theta\) \(=\dfrac{7.5}{40}\)
\(\theta\) \(=\cos^{-1} \Big(\dfrac{7.5}{40}\Big)\)
  \(=79.193\ …\)
  \(=79^{\circ}\ \text{(nearest degree)}\)


\(\text{Bearing}\ \ C\ \text{from}\ X=180+79=259^{\circ}\)


♦♦♦♦ Mean mark (b) 9%.

Filed Under: M3 Right-Angled Triangles (Y12), Right-angled Triangles (Y12) Tagged With: Band 5, Band 6, smc-1103-20-Right-angled Trig, smc-1103-60-Bearings, smc-6834-20-Trigonometry, smc-6834-60-Bearings, std2-std1-common

Vectors, EXT1 V1 2023 HSC 14c

  1. Given a non-zero vector  \(\left(\begin{array}{l}p \\ q\end{array}\right)\),  it is known that the vector  \(\left(\begin{array}{c}q \\ -p\end{array}\right)\) is perpendicular to  \(\left(\begin{array}{l}p \\ q\end{array}\right)\)  and has the same magnitude. (Do NOT prove this.)
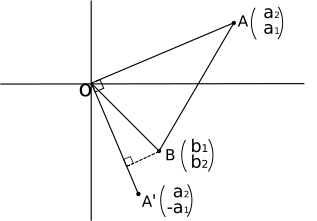
  2. Points \(A\) and \(B\) have position vectors  \(\overrightarrow{O A}=\left(\begin{array}{l}a_1 \\ a_2\end{array}\right)\)  and  \(\overrightarrow{O B}=\left(\begin{array}{l}b_1 \\ b_2\end{array}\right)\), respectively.
  3. Using the given information, or otherwise, show that the area of triangle  \(O A B\)  is  \(\dfrac{1}{2}\left|a_1 b_2-a_2 b_1\right|\).  (3 marks)

    --- 8 WORK AREA LINES (style=lined) ---

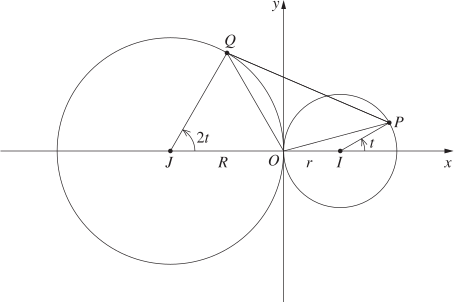
  4. The point \(P\) lies on the circle centred at  \(I(r, 0)\)  with radius  \(r>0\),  such that  \(\overrightarrow{I P}\)  makes an angle of \(t\) to the horizontal.

  5. The point \(Q\) lies on the circle centred at  \(J(-R, 0)\)  with radius  \(R>0\),  such that  \(\overrightarrow{J Q}\)  makes an angle of \(2 t\) to the horizontal.

  1. Note that  \(\overrightarrow{O P}=\overrightarrow{O I}+\overrightarrow{I P}\)  and  \(\overrightarrow{O Q}=\overrightarrow{O J}+\overrightarrow{J Q}\).
  2. Using part (i), or otherwise, find the values of \(t\), where  \(-\pi \leq t \leq \pi\), that maximise the area of triangle \(O P Q\).  (4 marks)

    --- 10 WORK AREA LINES (style=lined) ---

Show Answers Only

  1. \(\text{See Worked Solutions}\)
  2. \(t=\dfrac{\pi}{3}, \ – \dfrac{\pi}{3} \)

Show Worked Solution

i.   
     

♦♦♦ Mean mark (i) 18%.
\(\Big{|}\text{proj}_{\overrightarrow{OA^{′}}} \overrightarrow{OB} \Big{|}\) \(=\ \text{⊥ height of}\ \triangle OAB\ \text{from side}\ \overrightarrow{OA} \)  
  \(= \Bigg{|} \dfrac{\overrightarrow{OB} \cdot \overrightarrow{OA^{′}}}{|\overrightarrow{OA^{′}}|} \Bigg{|} \)  
  \(= \Bigg{|} \dfrac{b_1a_2-b_2a_1}{|\overrightarrow{OA^{′}}|} \Bigg{|} \)  


\(\text{Area}\ \triangle AOB\) \(=\dfrac{1}{2} \Bigg{|} \dfrac{b_1a_2-b_2a_1}{|\overrightarrow{OA^{′}}|} \Bigg{|} \cdot |\overrightarrow{OA} | \)  
  \(=\dfrac{1}{2}\left|a_1 b_2-a_2 b_1\right|\ \ \ (\text{noting}\ \ |\overrightarrow{OA} |=|\overrightarrow{OA^{′}} |) \)  


ii.    \(\overrightarrow{OP}\) \(=\overrightarrow{OI}+\overrightarrow{IP}\)
    \(= \left(\begin{array}{l}r \\ 0\end{array}\right) + \left(\begin{array}{c} r\ \cos \ t \\ r\ \sin \ t\end{array}\right) \)
    \(= \left(\begin{array}{c} r(1+ \cos \ t) \\ r\ \sin \ t\end{array}\right) \)
♦♦♦ Mean mark (ii) 8%.
\(\overrightarrow{OQ}\) \(=\overrightarrow{OJ}+\overrightarrow{JQ}\)
  \(= \left(\begin{array}{c} -R \\ 0 \end{array}\right) + \left(\begin{array}{l} R\ \cos\ 2t \\ R\ \sin\ 2t\end{array}\right) \)
  \(= \left(\begin{array}{c} R(\cos\ 2t-1) \\ R\ \sin\ 2t\end{array}\right) \)

 
\(\text{Using part (i):}\)

\(A_{\triangle OPQ}\)

\(=\dfrac{1}{2} \big{|} r(1+\cos\ t) \cdot R \sin\ 2t-r\ \sin\ t\ \cdot R(\cos\ 2t-1)\ \big{|} \)

 
  \(=\dfrac{rR}{2} \big{|} \sin\ 2t+\cos\ t\ \sin\ 2t-\sin\ t\ \cos\ 2t+\sin\ t\ \big{|} \)  
  \(=\dfrac{rR}{2} \big{|} \sin\ 2t+\sin\ t\ + \sin(2t-t) \big{|} \)  
  \(=\dfrac{rR}{2} \big{|} 2\sin\ t\ \cos\ t +2\sin\ t \big{|} \)  
  \(= rR \big{|} \sin\ t(\cos\ t+1) \big{|} \)  

 
\(\text{Let}\ \ f(t)=\sin\ t(\cos\ t+1) \)

\(f^{′}(t) \) \(=\cos\ t(\cos\ t+1)+\sin\ t(-\sin\ t) \)  
  \(=\cos^{2}t+\cos\ t-\sin^{2}t\)  
  \(=\cos^{2}t+\cos\ t-(1-\cos^{2}t) \)  
  \(=2\cos^{2}t+\cos\ t-1 \)  
  \(=(2\cos^{2}t-1)(\cos\ t+1) \)  

 
\(\text{SP’s when}\ \ f^{′}(t)=0:\)

\(\cos\ t\) \(=\dfrac{1}{2} \) \(\cos\ t\) \(=-1\)
\(t\) \(=\dfrac{\pi}{3}, \ – \dfrac{\pi}{3} \) \(t\) \(=\pi, \ -\pi \)

 
\(\text{Testing SP’s:}\)

\(f(\pi) = f(- \pi) = 0\)

\(\therefore A_{\triangle AOB}\ \text{is maximum when}\ \ t=\dfrac{\pi}{3}, \ – \dfrac{\pi}{3} \)

Filed Under: Vectors and Geometry Tagged With: Band 6, smc-1211-10-Triangle, smc-1211-70-Projections

Combinatorics, EXT1 A1 2023 HSC 10 MC

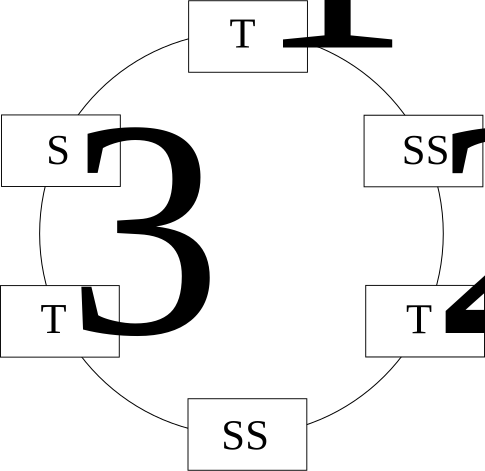
A group with 5 students and 3 teachers is to be arranged in a circle.

In how many ways can this be done if no more than 2 students can sit together?

  1. \(4 ! \times 3!\)
  2. \(5 ! \times 3!\)
  3. \(2 ! \times 5 ! \times 3!\)
  4. \(2 ! \times 2 ! \times 2 ! \times 3!\)
Show Answers Only

\(B\)

Show Worked Solution

\(\text{Fix 1st teacher in a seat}\)

\(\text{Split remaining 5 students into 3 groups (2 × 2 students and 1 × 1 student)}\)
 

\(\text{Combinations of other teachers = 2! }\)

\(\text{Combinations of students within groups = 5! }\)

\(\text{Combinations of student groups between teachers = 3 }\)

\(\therefore\ \text{Total combinations}\ = 2! \times 5! \times 3 = 3! \times 5! \)

\(\Rightarrow B\)

♦♦♦ Mean mark 13%.

Filed Under: Permutations and Combinations, Permutations and Combinations (Y11) Tagged With: Band 6, smc-1082-30-Combinations in a Circle, smc-6638-30-Combinations in a Circle

Functions, EXT1 F2 2023 HSC 14b

Consider the hyperbola  \(y=\dfrac{1}{x}\)  and the circle  \((x-c)^2+y^2=c^2\), where \(c\) is a constant.

  1. Show that the \(x\)-coordinates of any points of intersection of the hyperbola and circle are zeros of the polynomial  \(P(x)=x^4-2 c x^3+1\).   (1 mark)

    --- 4 WORK AREA LINES (style=lined) ---

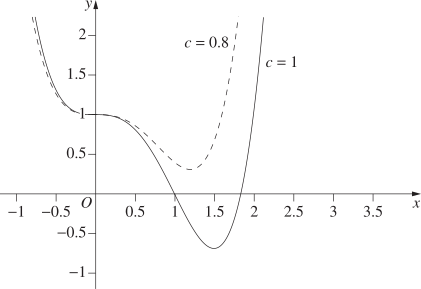
  2. The graphs of  \(y=x^4-2 c x^3+1\)  for  \(c=0.8\)  and  \(c=1\) are shown.
     

  1. By considering the given graphs, or otherwise, find the exact value of  \(c>0\)  such that the hyperbola  \(y=\dfrac{1}{x}\)  and the circle  \((x-c)^2+y^2=c^2\)  intersect at only one point.   (3 marks)

    --- 10 WORK AREA LINES (style=lined) ---

Show Answers Only

i.    \(\text{See Worked Solutions}\)

ii.   \(\sqrt[4]{\dfrac{16}{27}}\approx 0.877\)

Show Worked Solution

i.     \(y=\dfrac{1}{x}\ …\ (1) \)

\((x-c)^2+y^2=c^2\ …\ (2) \)

\(\text{Substitute (1) into (2):}\)

\((x-c)^2+\Big{(}\dfrac{1}{x}\Big{)}^2 \) \(=c^2\)  
\(x^2-2cx+c^2+\dfrac{1}{x^2}\) \(=c^2\)  
\(x^4-2cx^3+1\) \(=0\)  
Mean mark (i) 53%.

ii.    \(\text{Graphs show that for some value of}\ \ 0.8 \leq c \leq 1,\)

\(P(x)\ \text{has a minimum that touches the}\ x\text{-axis once.}\)

\(P(x)\) \(=x^4-2cx^3+1\)  
\(P^{′}(x)\) \(=4x^3-6cx^2\)  

 
\(\text{Find}\ x\ \text{when}\ P^{′}(x)=0: \)

\(4x^3-6cx^2\) \(=0\)  
\(2x^2(2x-3c)\) \(=0\)  
\(x\) \(=\dfrac{3c}{2}\ \ (x \neq 0)\)  

 
\(\text{Find}\ c\ \text{when}\ P(\frac{3c}{2})=0: \)

\(\Big{(} \dfrac{3c}{2} \Big{)}^4-2c\Big{(} \dfrac{3c}{2} \Big{)}^3+1 \) \(=0\)  
\(\dfrac{81c^4}{16}-\dfrac{54c^4}{8}+1\) \(=0\)  
\(\dfrac{(108-81)c^4}{16}\) \(=1\)  
\(\dfrac{27c^4}{16}\) \(=1\)  
\(c^4\) \(=\dfrac{16}{27}\)  
\(c\) \(=\sqrt[4]{\dfrac{16}{27}}\approx 0.877\)  
Mean mark (ii) 19%.

Filed Under: Multiplicity of Zeroes in Polynomials, Sum, Products and Multiplicity of Roots Tagged With: Band 4, Band 6, smc-1205-20-Multiplicity of Roots, smc-1205-30-Other, smc-7292-50-Other Problems

Calculus, EXT1 C3 2023 HSC 13a

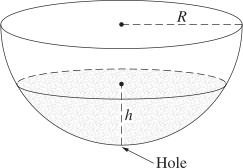
A hemispherical water tank has radius \(R\) cm. The tank has a hole at the bottom which allows water to drain out.

Initially the tank is empty. Water is poured into the tank at a constant rate of  \(2 k R\) cm³ s\(^{-1}\), where \(k\) is a positive constant.

After \(t\) seconds, the height of the water in the tank is \(h\) cm, as shown in the diagram, and the volume of water in the tank is \(V\) cm³.
  

It is known that  \(V= \pi \Big{(} R h^2-\dfrac{h^3}{3}\Big{)}. \)    (Do NOT prove this.)

While water flows into the tank and also drains out of the bottom, the rate of change of the volume of water in the tank is given by  \(\dfrac{d V}{d t}=k(2 R-h)\).

  1. Show that  \(\dfrac{d h}{d t}=\dfrac{k}{\pi h}\).  (2 marks)

    --- 5 WORK AREA LINES (style=lined) ---

  2. Show that the tank is full of water after  \(T=\dfrac{\pi R^2}{2 k}\) seconds.  (2 marks)

    --- 6 WORK AREA LINES (style=lined) ---

  3. The instant the tank is full, water stops flowing into the tank, but it continues to drain out of the hole at the bottom as before.
  4. Show that the tank takes 3 times as long to empty as it did to fill.  (3 marks)

    --- 9 WORK AREA LINES (style=lined) ---

Show Answers Only

i.    \(\text{See Worked Solutions}\)

ii.   \(\text{See Worked Solutions}\)

iii.  \(\text{See Worked Solutions}\)

Show Worked Solution

i.    \(V=\pi \Big{(}Rh^2-\dfrac{h^3}{3} \Big{)} \)

\(\dfrac{dV}{dh} = \pi(2Rh-h^2) \)

\(\dfrac{dV}{dt} = k(2R-h)\ \ \ \text{(given)} \)

\(\dfrac{dh}{dt}\) \(= \dfrac{dV}{dt} \cdot \dfrac{dh}{dV} \)  
  \(=k(2R-h) \cdot \dfrac{1}{\pi} \cdot \dfrac{1}{h(2R-h)} \)  
  \(= \dfrac{k}{\pi h} \)  

 
ii.
    \(\dfrac{dt}{dh} = \dfrac{\pi h}{k} \)

\(t\) \(= \displaystyle \int \dfrac{dt}{dh}\ dh \)  
  \(= \dfrac{\pi}{k} \displaystyle \int h\ dh \)  
  \(= \dfrac{\pi}{k} \Big{[} \dfrac{h^2}{2} \Big{]} +c \)  

 
\(\text{When}\ \ t=0, h=0 \)

\(\Rightarrow c=0 \)

\( t= \dfrac{\pi h^2}{2k} \)

 
\(\text{Tank is full at time}\ T\ \text{when}\ \ h=R: \)

\( T= \dfrac{\pi R^2}{2k}\ \text{seconds} \)

♦ Mean mark (ii) 41%.

iii.   \(\text{Net water flow}\ = k(2R-h)\ \ \text{(given)} \)

\(\text{Flow in}\ =2kR\ \ \text{(given)} \)

\(\text{Flow out}\ = k(2R-h)-2kR=-kh \)
 

\( \dfrac{dh}{dt}= \dfrac{-kh}{\pi h(2R-h)} = \dfrac{-k}{\pi (2R-h)} \)

♦♦♦ Mean mark (iii) 20%.
 

\(\dfrac{dt}{dh}\) \(=\dfrac{- \pi (2R-h)}{k} \)  
\( \displaystyle \int k\ dt\) \(=- \pi \displaystyle \int (2R-h)\ dh \)  
\(kt\) \(=- \pi \Big{(} 2Rh-\dfrac{h^2}{2} \Big{)}+c \)  

 
\(\text{When}\ \ t=0, \ h=R: \)

\(0\) \(=- \pi \Big{(}2R^2-\dfrac{R^2}{2} \Big{)} + c\)  
\(c\) \(= \pi \Big{(} \dfrac{3R^2}{2} \Big{)} \)  

 
\(\text{Find}\ t\ \text{when}\ h=0: \)

\(kt\) \(=- \pi(0) + \pi \dfrac{3R^2}{2} \)  
\(t\) \(= \dfrac{3 \pi R^2}{2k} \)  
  \(= 3 \times \dfrac{\pi R^2}{2k} \)  

 
\(\therefore\ \text{Tank takes 3 times longer to empty than fill.} \)

Filed Under: Applications of Differential Equations, Applications of Differential Equations, Related Rates of Change, Related Rates of Change Tagged With: Band 3, Band 5, Band 6, smc-1079-10-Volume, smc-1198-45-Flow in/out, smc-7297-45-Flow in/out, smc-7351-10-Volume

Statistics, STD1 S1 2023 HSC 20

Consider the following dataset.

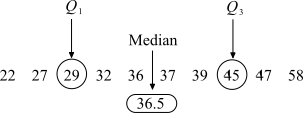
22, 27, 29, 32, 36, 37, 39, 45, 47, 58

Is 58 an outlier in this dataset? Justify your answer with working.  (3 marks)

--- 6 WORK AREA LINES (style=lined) ---

Show Answers Only

\(\text{Median}=\dfrac{36+37}{2}=36.5\)

\(Q_1=29\ \ \text{and}\ \ Q_3=45\)

\(IQR=Q_3-Q_1=45-29=16\)

\(Q_3+1.5\times IQR=45+1.5\times 16=69\)

\(\therefore\ \text{58 is not an outlier (58 < 69).}\)

Show Worked Solution

\(\text{Median}=\dfrac{36+37}{2}=36.5\)

\(Q_1=29\ \ \text{and}\ \ Q_3=45\)

\(IQR=Q_3-Q_1=45-29=16\)

\(Q_3+1.5\times IQR=45+1.5\times 16=69\)

\(\therefore\ \text{58 is not an outlier (58 < 69).}\)


♦♦♦ Mean mark 17%.

Filed Under: Measures of Centre and Spread, Summary Statistics Tagged With: Band 6, smc-1131-30-IQR and Outliers, smc-6532-30-IQR and Outliers

Networks, STD1 N1 2023 HSC 18

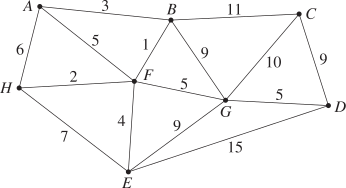
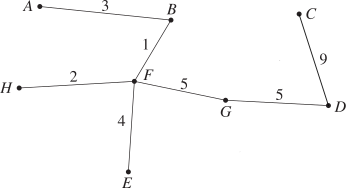
A network of running tracks connects the points \(A, B, C, D, E, F, G, H\), as shown. The number on each edge represents the time, in minutes, that a typical runner should take to run along each track.


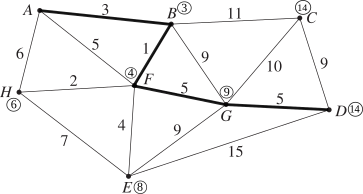
  1. Which path could a typical runner take to run from point \(A\) to point \(D\) in the shortest time?   (2 marks)

    --- 4 WORK AREA LINES (style=lined) ---

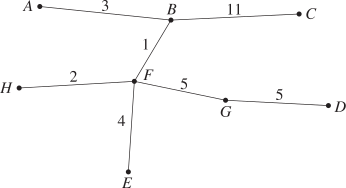
  2. A spanning tree of the network above is shown.
     

  1. Is it a minimum spanning tree? Give a reason for your answer.   (2 marks)

    --- 4 WORK AREA LINES (style=lined) ---

Show Answers Only

a.    \(ABFGD\)

b.    \(\text{See worked solutions}\)

Show Worked Solution

a.    \(\text{Using Djikstra’s Algorithm:}\)
 

\(\text{Shortest route}=ABFGD=3+1+5+5=14\)
 

 b.   \(\text{Total time of given spanning tree}\)

\(=3+11+1+2+4+5+5=31\)
 

\(\text{Consider the MST below:}\)
 

\(\text{Total time (MST)}= 3+1+2+4+5+5+9=29\)

\(\therefore \text{ Given tree is NOT a MST.}\)

♦♦ Mean mark (b) 21%.

Filed Under: Minimum Spanning Trees, Shortest Path, Shortest Paths, Spanning Trees Tagged With: Band 3, Band 6, smc-1137-10-Network Diagram, smc-1138-40-Draw Tree, smc-6527-10-Network Diagrams, smc-6528-40-Draw Tree, std2-std1-common

Statistics, STD1 S1 2023 HSC 13

The graph shows the frequency of scores out of 10 awarded to a museum by visitors.
 

  1. What is the mode of these data?   (1 mark)

    --- 2 WORK AREA LINES (style=lined) ---

  2. Describe TWO features of this graph.   (2 marks)

    --- 5 WORK AREA LINES (style=lined) ---

Show Answers Only

a.    \(\text{Mode = Score with the highest frequency}=9\)
 

b.    \(\text{Features could include any 2 of the following:}\)

    • \(\text{Data is negatively skewed as the mean and median are to the left of the mode}\)
    • \(\text{23 of the 24 scores, or 95.8%, are 5 or above.}\)
    • \(Q_2\text{(Median)}=8\)
    • \(Q_1=7\text{ and }Q_3=9\)
    • \(IQR=Q_3-Q_1=9-7=2\)
    • \(Q_1-1.5\times IQR=7-1.5\times 2=4\ \ \Rightarrow \ \ \text{1 is an outlier as }1<4\)
    • \(\text{Mean}=\dfrac{189}{24}=7.875\)
    • \(\text{If the outlier (1) was removed, Mean}=\dfrac{188}{23}=8.174\text{ (2 d.p.)}\)

Show Worked Solution

a.    \(\text{Mode = Score with the highest frequency}=9\)
 

b.    \(\text{Features could include any 2 of the following:}\)

    • \(\text{Data is negatively skewed as the mean and median are to the left of the mode}\)
    • \(\text{23 of the 24 scores, or 95.8%, are 5 or above.}\)
    • \(Q_2\text{(Median)}=8\)
    • \(Q_1=7\text{ and }Q_3=9\)
    • \(IQR=Q_3-Q_1=9-7=2\)
    • \(Q_1-1.5\times IQR=7-1.5\times 2=4\ \ \Rightarrow \ \ \text{1 is an outlier as }1<4\)
    • \(\text{Mean}=\dfrac{189}{24}=7.875\)
    • \(\text{If the outlier (1) was removed, Mean}=\dfrac{188}{23}=8.174\text{ (2 d.p.)}\)

♦ Mean mark (a) 47%.
♦♦♦ Mean mark (b) 18%.

Filed Under: Bar Charts, Histograms and Other Graphs, Displaying Data - Bar Charts and Histograms, Measures of Centre and Spread, Summary Statistics Tagged With: Band 5, Band 6, smc-1128-10-Bar Charts, smc-1128-15-Histograms, smc-1131-10-Mean, smc-1131-20-Median and Mode, smc-6530-10-Bar Charts, smc-6530-20-Histograms, smc-6532-10-Mean, smc-6532-20-Median and Mode

Statistics, STD1 S1 2023 HSC 11

A company employs 50 people.

The annual income of the employees is shown in the grouped frequency distribution table.

\begin{array} {|c|c|c|c|}
\hline
\textit{Annual income} & \textit{Class centre} & \textit{Number of} & fx \\ \text{(\$)} & (x) & \textit{employees}\ (f) &  \\
\hline
\rule{0pt}{2.5ex} \text{40 000 – 49 999} \rule[-1ex]{0pt}{0pt} & 45\ 000 & 12 & 540\ 000 \\
\hline
\rule{0pt}{2.5ex} \text{50 000 – 59 999} \rule[-1ex]{0pt}{0pt} & 55\ 000 & 13 & 715\ 000 \\
\hline\rule{0pt}{2.5ex} \text{60 000 – 69 999} \rule[-1ex]{0pt}{0pt} & 65\ 000 & 15 & A \\
\hline\rule{0pt}{2.5ex} \text{70 000 – 79 999} \rule[-1ex]{0pt}{0pt} & 75\ 000 & 7 & 525\ 000 \\
\hline\rule{0pt}{2.5ex} \text{80 000 – 89 999} \rule[-1ex]{0pt}{0pt} & 85\ 000 & 3 & 255\ 000 \\
\hline
\hline\rule{0pt}{2.5ex}  \rule[-1ex]{0pt}{0pt} &  & \textit{Total}\ = 50 & \textit{Total = B} \\
\hline
\end{array}  

  1. What are the values of \(A\) and \(B\)?   (2 marks)

    --- 4 WORK AREA LINES (style=lined) ---

  2. Find the mean for this distribution.   (1 mark)

    --- 2 WORK AREA LINES (style=lined) ---

Show Answers Only

a.    \(A=$975\ 000\), \(B=$3\ 010\ 000\)

b.    \($60\ 200\)

Show Worked Solution

a.    \(A=65\ 000\times 15 = $975\ 000\)

\(B=540\ 000+715\ 000+975\ 000+525\ 000+255\ 000=$3\ 010\ 000\)


b.    \(\text{Mean}=\dfrac{\text{Total }fx}{\text{Total }f}=\dfrac{3\ 010\ 000}{50}=$60\ 200\)

♦♦♦ Mean mark (b) 12%.

Filed Under: Measures of Centre and Spread, Summary Statistics Tagged With: Band 3, Band 6, smc-1131-10-Mean, smc-1131-40-Class Centres, smc-1131-60-Frequency Tables, smc-6532-10-Mean, smc-6532-60-Frequency Tables

Financial Maths, STD1 F1 2023 HSC 7 MC

An item was purchased for a price of $880, including 10% GST.

What is the amount of GST included in the price?

  1. $8.00
  2. $8.80
  3. $80.00
  4. $88.00
Show Answers Only

\(C\)

Show Worked Solution

\(\text{Let}\ C =\text{Original cost}\)

\(C+0.1 \times C\) \(=880\)  
\(1.1C\) \(=880\)  
\(C\) \(=\dfrac{880}{1.1}=$800\)  

 
\(\therefore \text{GST}=800\times 0.1=$80\)
  

\(\Rightarrow C\)

♦ Mean mark 15%.

Filed Under: Purchasing Goods, Tax and Percentage Increase/Decrease Tagged With: Band 6, smc-1125-20-GST, smc-6517-20-GST/VAT, std2-std1-common

Functions, 2ADV F1 2023 HSC 10 MC

The graph  \(y = x^2\)  meets the line  \(y = k\)  (where \(k>0\)) at points \(P\) and \(Q\) as shown in the diagram. The length of the interval \(PQ\) is \(L\).
 

Let \(a\) be a positive number. The graph  \(y=\dfrac{x^2}{a^2}\)  meets the line  \(y=k\)  at points \(S\) and \(T\).

What is the length of \(ST\)?

  1. \(\dfrac{L}{a}\)
  2. \(\dfrac{L}{a^2}\)
  3. \(aL\)
  4. \(a^2L\)
Show Answers Only

\(C\)

Show Worked Solution

\(\text{Intersection of}\ \ y=x^2\ \ \text{and}\ \ y=k:\)

\(x^2=k\ \ \Rightarrow\ \ x=\pm \sqrt k\)

\(\therefore L=2\sqrt k\)

\(\text{Intersection of}\ \ y=\dfrac{x^2}{a^2}\ \ \text{and}\ \ y=k:\)

\(\dfrac{x^2}{a^2} \) \(=k\)  
\(x^2\) \(=a^2k\)  
\(x\) \(=\pm a\sqrt k\)  

\(\therefore ST=a \times 2\sqrt k = aL \)

\(\Rightarrow C\)

♦♦♦ Mean mark 24%.

Filed Under: Quadratics and Cubic Functions, Quadratics and Cubic Functions Tagged With: Band 6, smc-6215-10-Quadratics, smc-6215-60-Intersections, smc-984-10-Quadratics

Calculus, 2ADV C4 2023 HSC 32

The curves  \(y=e^{-2 x}\)  and  \(y=e^{-x}-\dfrac{1}{4}\)  intersect at exactly one point as shown in the diagram. The point of intersection has coordinates \(\left(\ln 2, \dfrac{1}{4}\right)\). (Do NOT prove this.)
 

  1. Show that the area bounded by the two curves and the \(y\)-axis, as shaded in the diagram, is  \(\dfrac{1}{4} \ln 2-\dfrac{1}{8}\).   (3 marks)

    --- 7 WORK AREA LINES (style=lined) ---

  2. Find the values of \(k\) such that the curves  \(y=e^{-2 x}\)  and  \(y=e^{-x}+k\)  intersect at two points.   (3 marks)

    --- 8 WORK AREA LINES (style=lined) ---

Show Answers Only

a.    \(\text{See Worked Solutions}\)

b.    \(-\dfrac{1}{4} < k < 0 \)

Show Worked Solution

a.     \(A\) \(= \int_0^{\ln2} e^{-2x}-(e^{-x}-\dfrac{1}{4})\ dx\)
    \(=\Big{[}-\dfrac{1}{2} e^{-2x}+e^{-x}+\dfrac{1}{4}x \Big{]}_0^{\ln2} \)
    \(=\Big{[}(-\dfrac{1}{2} e^{-2\ln2}+e^{-\ln2}+\dfrac{1}{4}\ln2)-(-\dfrac{1}{2}e^0+e^0-0)\Big{]} \)
    \(=\Big{[}(-\dfrac{1}{2} e^{\ln{(2^{-2})}}+e^{\ln{(2^{-1})}}+\dfrac{1}{4}\ln2+\dfrac{1}{2}-1)\Big{]} \)
    \(=\Big{[}(-\dfrac{1}{2} e^{\ln \frac{1}{4}}+e^{\ln \frac{1}{2}}+\dfrac{1}{4}\ln2-\dfrac{1}{2}\Big{]} \)
    \(=-\dfrac{1}{2} \times \dfrac{1}{4} +\dfrac{1}{2}+\dfrac{1}{4}\ln2-\dfrac{1}{2} \)
    \(=\dfrac{1}{4}\ln2-\dfrac{1}{8} \)


b.    \(\text{Intersection occurs when}\)

\(e^{-2x}\) \(=e^{-x}+k\)
\(e^{-2x}-e^{-x}-k\) \(=0\)

 
\(\text{Let}\ X=e^{-x} \)

\(X^2-X-k=0 \)

\(X\) \(=\dfrac{1\pm \sqrt{1^2-4(1)(-k)}}{2} \)
  \(=\dfrac{1\pm \sqrt{1+4k}}{2} \)

  
\(\text{2 solutions}\ \Rightarrow\ \Delta >0 \)

\(1+4k>0\ \ \Rightarrow \ k>-\dfrac{1}{4} \)
 

\(\text{Since}\ X=e^{-x} >0:\)

\(\Rightarrow\ \text{Both real solutions to the quadratic MUST be positive.}\)

\(\sqrt{1+4k}\) \(<1\)
\(1+4k\) \(<1\)
\(k\) \(<0\)

 
\(\therefore\ -\dfrac{1}{4} < k < 0 \)

♦♦♦ Mean mark (b) 14%.

Filed Under: Area Under Curves, Areas Under Curves Tagged With: Band 4, Band 6, smc-7131-40-Exponential/Log, smc-975-40-Exponential

Probability, 2ADV S1 2023 HSC 31

Four Year 12 students want to organise a graduation party. All four students have the same probability, \(P(F)\), of being available next Friday. All four students have the same probability, \(P(S)\), of being available next Saturday.

It is given that  \(P(F)=\dfrac{3}{10}, P(S\mid F)=\dfrac{1}{3}\), and \(P(F\mid S)=\dfrac{1}{8}\).

Kim is one of the four students.

  1. Is Kim's availability next Friday independent from his availability next Saturday? Justify your answer.  (1 mark)

    --- 2 WORK AREA LINES (style=lined) ---

  2. Show that the probability that Kim is available next Saturday is \(\dfrac{4}{5}\).  (2 marks)

    --- 5 WORK AREA LINES (style=lined) ---

  3. What is the probability that at least one of the four students is NOT available next Saturday?  (2 marks)

    --- 3 WORK AREA LINES (style=lined) ---

Show Answers Only

a.    \(P(F) \neq P(F|S)\ \text{which is not the case}\ \ (\dfrac{3}{10} \neq \dfrac{1}{8}) \)

\(\therefore\ \text{Kim’s availability on Friday is not independent of Saturday}\)

b.    \(\text{See Worked Solutions} \)

c.    \(\dfrac{369}{625} \)

Show Worked Solution

a.    \(P(F) \neq P(F|S)\ \text{which is not the case}\ \ (\dfrac{3}{10} \neq \dfrac{1}{8}) \)

\(\therefore\ \text{Kim’s availability on Friday is not independent of Saturday}\)

♦♦♦ Mean mark (a) 18%.
b.     \(P(S|F) \) \(= \dfrac{P(S) \cap P(F)}{P(F)} \)
  \(\dfrac{1}{3}\) \(= \dfrac{P(S) \cap P(F)}{\frac{3}{10}} \)
  \(\dfrac{1}{10}\) \(=P(S) \cap P(F) \)
♦ Mean mark (b) 44%.
\(P(F|S)\)  \(= \dfrac{P(F) \cap P(S)}{P(S)} \)  
\(\dfrac{1}{8}\) \(=\dfrac{\frac{1}{10}}{P(S)} \)  
\(\dfrac{1}{8} \times P(S) \) \(=\dfrac{1}{10} \)  
\(P(S)\) \(=\dfrac{4}{5} \)  


c.     \(P\text{(at least 1 not available)}\) \(=1-P\text{(all are available)} \)
    \(=1-\left(\dfrac{4}{5}\right)^4 \)
    \(=\dfrac{369}{625} \)
♦♦ Mean mark (c) 34%.

Filed Under: Conditional Probability and Venn Diagrams, Conditional Probability and Venn Diagrams Tagged With: Band 5, Band 6, smc-6470-10-Conditional Prob Formula, smc-6470-30-Independent Events, smc-991-10-Conditional Prob Formula, smc-991-30-Independent Events

Statistics, 2ADV S3 2023 HSC 29

A continuous random variable \(X\) has probability density function \(f(x)\) given by
 

\(f(x)=\left\{\begin{array}{ll} 12 x^2(1-x) & \text { for } 0 \leq x \leq 1 \\ 0 & \text { for all other values of } x \end{array}\right.\)


  1. Find the mode of \(X\).   (2 marks)

    --- 6 WORK AREA LINES (style=lined) ---

  2. Find the cumulative distribution function for the given probability density function.   (2 marks)

    --- 6 WORK AREA LINES (style=lined) ---

  3. Without calculating the median, show that the mode is greater than the median.   (2 marks)

    --- 4 WORK AREA LINES (style=lined) ---

Show Answers Only

a.    \(x=\dfrac{2}{3} \)

b.    \(F(x)=\left\{\begin{array}{ll} 0 & \text { for } x \lt 0 & \\ 4x^3-3x^4 & \text { for } 0 \leq x \leq 1 \\ 1 & \text { for } x > 1 \end{array}\right.\)

c.    \(\text{See Worked Solutions}\)

Show Worked Solution

a.    \(\text{Mode}\ \rightarrow \ f(x)_\text{max} \)

\(f(x)=12 x^2(1-x)=12x^2-12x^3 \)

\(f^{\prime}(x)=24x-36x^2=12x(2-3x) \)

\(f^{\prime\prime}(x)=24-72x \)

♦ Mean mark (a) 45%.

\(\text{Max/min when}\ f^{\prime}(x)=0 \)

\(2-3x=0\ \ ⇒\ \ x=\dfrac{2}{3} \ \ (x \neq 0) \)

\(\text{At}\ x=\dfrac{2}{3}, \ f^{\prime\prime}(x)=24-72(\dfrac{2}{3})=-24<0 \)

\(\therefore \ \text{Mode (max) at}\ x=\dfrac{2}{3} \)
  

b.     \(F(x)\) \(= \int 12x^2-12x^3\ dx\)
    \(=4x^3-3x^4+c \)

 
\(\text{At}\ x=0, F(x)=0\ \ ⇒\ \ c=0 \)

\(F(x)=4x^3-3x^4 \)
 

\(F(x)=\left\{\begin{array}{ll} 0 & \text { for } x \lt 0 & \\ 4x^3-3x^4 & \text { for } 0 \leq x \leq 1 \\ 1 & \text { for } x > 1 \end{array}\right.\)

 
c.
    \(\text{Find}\ F\Big{(}\dfrac{2}{3}\Big{)}: \)

\(F\Big{(}\dfrac{2}{3}\Big{)} \) \(=4 \times \Big{(}\dfrac{2}{3}\Big{)}^3-3 \times \Big{(}\dfrac{2}{3}\Big{)}^4 \)
  \(=\dfrac{16}{27}>0.5 \)

 
\(\therefore\ \text{Mode > median}\)

♦♦♦ Mean mark (c) 17%.

Filed Under: Continuous Random Variables, Probability Density Functions Tagged With: Band 4, Band 5, Band 6, smc-7137-10-Median, smc-7137-20-Mode, smc-7137-40-CDF, smc-7137-60-Polynomial PDF, smc-994-10-Median, smc-994-20-Mode, smc-994-40-Cumulative Distribution Fn, smc-994-60-Polynomial PDF

Functions, 2ADV F2 2023 HSC 27

The graph of  \(y=f(x)\), where  \(f(x)=a|x-b|+c\), passes through the points \((3,-5), (6,7)\) and \((9,-5)\) as shown in the diagram.
 

  1. Find the values of  \(a, b\) and \(c\).  (3 marks)

    --- 6 WORK AREA LINES (style=lined) ---

  2. The line  \(y=m x\)  cuts the graph of  \(y=f(x)\)  in two distinct places.
  3. Find all possible values of \(m\).  (2 marks)

    --- 5 WORK AREA LINES (style=lined) ---

Show Answers Only

a.    \(\ a=-4\) , \(\ b=6\) , \(\ c=7\)

b.   \( \text{2 solutions when}\ \ -4<m<7/6 \)

Show Worked Solution

a.    \(\text{Consider the transformation of}\ \ y=-|x|\)

\(\text{Translate 6 units to the right}\)

\(y=-|x|\ \ \rightarrow\ \ y=-|x-6| \)

\(\therefore b=6\)
 

\(\text{Translate 7 units vertically up}\)

\(y=-|x-6|\ \ \rightarrow\ \ y=-|x-6|+7 \)

\(\therefore c=7\)
 

\(f(x)=a|x-6|+7\ \ \text{passes through}\ (3, -5):\)

\(-5\) \(=a|3-6|+7\)  
\(-5\) \(=3a+7\)  
\(3a\) \(=-12\)  
\(\therefore a\) \(=-4\)  

 
b.
    \(y=mx\ \ \text{passes through (0, 0)}\)

\( \text{One solution when}\ \ y=mx\ \ \text{passes through (0, 0) and (6, 7)}\)

\(m=\dfrac{7-0}{6-0}=\dfrac{7}{6}\)

\(\text{As graph gets flatter and turns negative ⇒ 2 solutions}\)
 

\(\text{2 solutions continue until}\ \ y=mx\ \ \text{is parallel to}\)

\(\text{the line joining (6, 7) to}\ (9,-5),\ \text{where}: \)

\(m=\dfrac{7-(-5)}{6-9}=-\dfrac{12}{3}=-4 \)
 

\(\therefore \ \text{2 solutions when}\ \ -4<m< \dfrac{7}{6} \)

♦♦♦ Mean mark (b) 23%.

Filed Under: Other Graph Transformations, Transformations Tagged With: Band 4, Band 6, smc-1008-20-Absolute Value, smc-1008-70-Combinations, smc-6408-15-Absolute Value, smc-6408-60-Combinations

Functions, 2ADV F1 2023 HSC 9 MC

Let \(f(x)\) be any function with domain all real numbers.

Which of the following is an even function, regardless of the choice of \(f(x)\)?

  1. \(2 f(x)\)
  2. \(f(f(x))\)
  3. \((f(-x))^2\)
  4. \(f(x) f(-x)\)
Show Answers Only

\(D\)

Show Worked Solution

\(\text{Even function}\ \rightarrow \ f(x)=f(-x)\)

\(\text{Consider the function}\ \ f(x) = x-2\)

\( 2f(1)=-2,\ \ 2f(-1)=-6\ \ \text{(not even)}\)

\( f(f(1))=f(-1)=-3,\ \ f(f(-1))=f(-3)=-5\ \ \text{(not even)}\)

\( (f(-1))^2=(-3)^2=9,\ \ (f(1))^2=(-1)^2=1\ \ \text{(not even)}\)

\( f(1)f(-1)=-1 \times -3=3,\ \ f(-1)f(1)=-3 \times -1=3 \ \text{(possibly even)}\)

\(=>D\)

♦♦♦ Mean mark 24%.

Filed Under: Further Functions and Relations, Quadratics and Cubic Functions Tagged With: Band 6, smc-6215-75-Odd/Even Functions, smc-987-70-Odd/even functions

Statistics, STD2 S4 2023 HSC 34

A university uses gas to heat its buildings. Over a period of 10 weekdays during winter, the gas used each day was measured in megawatts (MW) and the average outside temperature each day was recorded in degrees Celsius (°C).

Using `x` as the average daily outside temperature and `y` as the total daily gas usage, the equation of the least-squares regression line was found.

The equation of the regression line predicts that when the temperature is 0°C, the daily gas usage is 236 MW.

The ten temperatures measured were: 0°, 0°, 0°, 2°, 5°, 7°, 8°, 9°, 9°, 10°,

The total gas usage for the ten weekdays was 1840 MW.

In any bivariate dataset, the least-squares regression line passes through the point `(bar x,bar y)`, where `bar x` is the sample mean of the `x`-values and `bar y` is the sample mean of the `y`-values.

  1. Using the information provided, plot the point `(bar x,bar y)` and the `y`-intercept of the least-squares regression line on the grid.   (3 marks)

    --- 3 WORK AREA LINES (style=lined) ---


  1. What is the equation of the regression line?   (2 marks)

    --- 4 WORK AREA LINES (style=lined) ---

  2. In the context of the dataset, identify ONE problem with using the regression line to predict gas usage when the average outside temperature is 23°C.   (1 mark)

    --- 2 WORK AREA LINES (style=lined) ---

Show Answers Only

a.    
         

b.    `y=-10.4x+236`

c.    `text{Answers could include one of the following:}`

`text{→ 23°C is outside the range of the dataset and requires the trend}`

`text{to be extrapolated.}`

`text{→ At 23°C, the equation predicts negative daily gas usage.}`

Show Worked Solution

a.    `barx=(0+0+0+2+5+7+8+9+9+10)/10=5^@text{C}`

`bary=1840/10=184`

`text{Regression line passes through:}\ (0,236) and (5,184)`
 

♦ Mean mark (a) 44%.

b.    `m=(y_2-y_1)/(x_2-x_1)=(184-236)/(5-0)=-10.4`

`text{Equation of line}\ m=-10.4\ text{passing through}\ (0,236):`

`(y-y_1)` `=m(x-x_1)`
`y-236` `=-10.4(x-0)`
`y` `=-10.4x+236`
♦♦♦ Mean mark (b) 21%.

 c.    `text{Answers could include one of the following:}`

`text{→ 23°C is outside the range of the dataset and requires the trend}`

`text{to be extrapolated.}`

`text{→ At 23°C, the equation predicts negative daily gas usage.}`


♦♦ Mean mark (c) 23%.

Filed Under: Bivariate Data Analysis (Y12), S4 Bivariate Data Analysis (Y12) Tagged With: 2adv-std2-common, Band 5, Band 6, smc-6934-20-LSRL, smc-785-20-Least-Squares Regression Line

Financial Maths, STD2 F4 2023 HSC 29

The table shows monthly repayments for each $1000 borrowed.
 

  1. A couple borrows $520 000 to buy a house at 8% per annum over 25 years.
  2. How much does the couple repay in total for this loan?   (3 marks)

    --- 7 WORK AREA LINES (style=lined) ---

  3. Chris borrows some money at 7% per annum. Chris will repay the loan over 15 years, paying $3596 per month.
  4. How much money does Chris borrow?   (1 mark)

    --- 3 WORK AREA LINES (style=lined) ---

Show Answers Only

a.    `$1\ 204\ 320`

b.    `400\ 000`

Show Worked Solution

a.    `text{8.0% interest over a 25 year loan}`

`text{Monthly repayments to borrow $1000 = $7.72}`

`text{Total months}\ = 25 xx 12 = 300`

`text{Monthly repayments}=520 xx 7.72=$4014.40`
  

`:.\ text{Total repayments}= 4014.40 xx 300=$1\ 204\ 320`

♦ Mean mark (a) 50%.

 
b.
    `text{7.0% interest over a 15 year loan}`

`text{Monthly repayments to borrow $1000 = $8.99}`
  
`:.\ text{Amount borrowed}=3596/8.99 xx 1000=$400\ 000`

♦♦♦ Mean mark (b) 11%.

Filed Under: Loans, Loans and Credit Cards Tagged With: Band 5, Band 6, smc-6926-30-Other Loan Tables, smc-6926-40-Total Loan/Interest Payments, smc-814-30-Other Loan Tables

Measurement, STD2 M1 2023 HSC 9 MC

The length and width of a rectangle are measured to be 8 cm and 5 cm respectively, to the nearest centimetre.

What are the lower and upper bounds for the area of the rectangle?

  1. `text{28 cm}^2\ text{and 54 cm}^2`
  2. `text{36 cm}^2\ text{and 42 cm}^2`
  3. `text{38.25 cm}^2\ text{and 41.25 cm}^2`
  4. `text{33.75 cm}^2\ text{and 46.75 cm}^2`
Show Answers Only

`D`

Show Worked Solution

`text{Absolute error}\ = 1/2 xx text{precision}\ =0.5\ text{cm}`

`text{8 cm side: upper limit = 8.5 cm, lower limit = 7.5 cm}`

`text{5 cm side: upper limit = 5.5 cm, lower limit = 4.5 cm}`

`text{Rectangle upper limit}\ =8.5xx5.5=46.75\ text{cm}^2`

`text{Rectangle lower limit}\ =7.5xx4.5=33.75\ text{cm}^2`

`=>D`

♦♦♦ Mean mark 29%.

Filed Under: Units and Measurement Error Tagged With: Band 6, smc-797-10-Measurement Error

BIOLOGY, M1 2014 HSC 19 MC

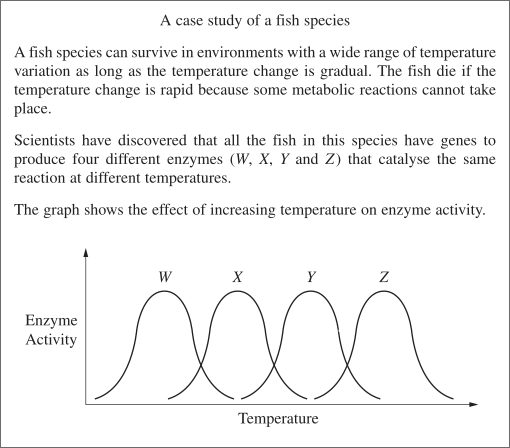
What is the best explanation for the fish surviving gradual temperature change but not a rapid temperature change?

  1. It takes time for each gene to be expressed.
  2. Enzyme activity is decreased at low temperatures.
  3. The fish produce different enzymes at different temperatures.
  4. Some enzymes will not denature if the temperature change is gradual.
Show Answers Only

\(A\)

Show Worked Solution
  • It takes time for each gene to be expressed, due to the time taken to both detect change and for the fish to create the optimal enzymes.
  • Rapid change would result in not enough time for the new enzyme to be utilised, and the fish may not survive due to denatured enzymes.

\(\Rightarrow A\)

♦♦♦ Mean mark 25%.

Filed Under: Cell Function Tagged With: Band 6, smc-4303-60-Enzymes

BIOLOGY, M2 2015 HSC 36e

'Science has been used to solve problems in the investigation of photosynthesis, and so has provided information of benefit to society.' 

Justify this statement with reference to the scientific knowledge behind radioactive tracers for the study of photosynthesis.   (7  marks)

--- 20 WORK AREA LINES (style=lined) ---

Show Answers Only
  • The intricate nature of photosynthesis has posed many barriers when scientists attempt to study it. To overcome this scientists have used radioactive tracers, synthetic chemicals which are taken up by the plant and act as normal organic chemicals except they contain a radioactive component.
  • Radioactive atoms release radiation that can be seen by technologies like X-ray film, geiger counters etc. The pathway of a radioactive substance through the living thing can be followed, as can the biochemical pathways that the molecule/atom is involved in.
  • \(\ce{C^{14}O2}\) and \(\ce{H2O^{18}}\) are both radioactive tracers that can be used to study photosynthesis.
  • If plants are surrounded by \(\ce{C^{14}O2 (g)}\) the radioactivity is soon seen in starch granules in the leaves of the plant. This shows that the starch is formed from the \(\ce{CO2}\) in the air, and is composed of carbon atoms from the air. None of the \(\ce{C^{14}}\) in the \(\ce{C^{14}O2 (g)}\) taken in by the plant is lost.
  • If plants are watered with \(\ce{H2O^{18} (l)}\) the radioactivity is seen in the \(\ce{O2}\) that the plant releases into the air around the plant and not in molecules constructed by photosynthesis contained within the leaf.
  • Therefore in photosynthesis the water is split and the oxygen released into the atmosphere, the \(\ce{H}\) incorporated into the plant within intermediate molecules in a biochemical pathway, and then finally into a starch molecule.
  • This knowledge is of benefit to society because we need to find ways of reducing the carbon in the atmosphere because of excess use of fossil fuel combustion and its resultant climate change. We can understand that land clearing with its removal of photosynthetic species will exacerbate the build up of carbon in the atmosphere because of the loss of photosynthesis it causes.
  • Society is also concerned about the need to generate oxygen such as in the context of massive amounts of fossil fuel combustion also removing oxygen from the atmosphere. Understanding that plants release oxygen in photosynthesis is part of the offsets for fossil fuel use in re-forestation projects as the carbon is locked up in the plant and oxygen is released into the atmosphere.
Show Worked Solution
  • The intricate nature of photosynthesis has posed many barriers when scientists attempt to study it. To overcome this scientists have used radioactive tracers, synthetic chemicals which are taken up by the plant and act as normal organic chemicals except they contain a radioactive component.
  • Radioactive atoms release radiation that can be seen by technologies like X-ray film, geiger counters etc. The pathway of a radioactive substance through the living thing can be followed, as can the biochemical pathways that the molecule/atom is involved in.
  • \(\ce{C^{14}O2}\) and \(\ce{H2O^{18}}\) are both radioactive tracers that can be used to study photosynthesis.
  • If plants are surrounded by \(\ce{C^{14}O2 (g)}\) the radioactivity is soon seen in starch granules in the leaves of the plant. This shows that the starch is formed from the \(\ce{CO2}\) in the air, and is composed of carbon atoms from the air. None of the \(\ce{C^{14}}\) in the \(\ce{C^{14}O2 (g)}\) taken in by the plant is lost.
  • If plants are watered with \(\ce{H2O^{18} (l)}\) the radioactivity is seen in the \(\ce{O2}\) that the plant releases into the air around the plant and not in molecules constructed by photosynthesis contained within the leaf.
  • Therefore in photosynthesis the water is split and the oxygen released into the atmosphere, the \(\ce{H}\) incorporated into the plant within intermediate molecules in a biochemical pathway, and then finally into a starch molecule.
  • This knowledge is of benefit to society because we need to find ways of reducing the carbon in the atmosphere because of excess use of fossil fuel combustion and its resultant climate change. We can understand that land clearing with its removal of photosynthetic species will exacerbate the build up of carbon in the atmosphere because of the loss of photosynthesis it causes.
  • Society is also concerned about the need to generate oxygen such as in the context of massive amounts of fossil fuel combustion also removing oxygen from the atmosphere. Understanding that plants release oxygen in photosynthesis is part of the offsets for fossil fuel use in re-forestation projects as the carbon is locked up in the plant and oxygen is released into the atmosphere.

Filed Under: Nutrient and Gas Requirements Tagged With: Band 4, Band 5, Band 6, smc-4305-75-Autoradiography

BIOLOGY, M2 2018 HSC 18 MC

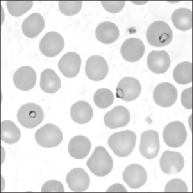
The micrograph shows normal-sized human red blood cells.

Within three of these red blood cells, an infection known as Plasmodium falciparum appears under the microscope view as a dark ring shape.
 

Which of the following is the best estimate of the diameter of the Plasmodium?

  1. \(0.002\ \text{mm}\)
  2. \(0.8\ \mu \text{m}\)
  3.  \(2\ \text{mm}\)
  4.  \(8\ \mu \text{m}\)
Show Answers Only

\(A\)

Show Worked Solution
  • The plasmodium are about 25% the size of the red blood cells.
  • As red blood cells are around 8µm, the plasmodium is approximately 2µm in diameter, or 0.002mm.

\(\Rightarrow A\)

♦♦♦ Mean mark 22%.

Filed Under: Transport Tagged With: Band 6, smc-4306-10-Blood

BIOLOGY, M1 2015 HSC 18 MC

Students conducted a large first-hand investigation into enzyme activity.

The aim in the report is shown.

Aim: To determine the optimum pH of four different enzymes.

How many independent variables were in this first-hand investigation?

  1. 1
  2. 2
  3. 4
  4. 5
Show Answers Only

\(B\)

Show Worked Solution
  • There are two independent variables, the pH and the selected enzyme. Both are changed in order to measure something, e.g. substrate concentration, in order to determine optimum pH for each of the enzymes individually.

\(\Rightarrow B\)

♦♦♦ Mean mark 22%.

Filed Under: Cell Function Tagged With: Band 6, smc-4303-60-Enzymes

BIOLOGY, M1 2017 HSC 36e

Analyse the impact of the development of the electron microscope on the understanding of chloroplast structure and function.  (7 marks)

--- 14 WORK AREA LINES (style=lined) ---

Show Answers Only
  • Using light microscopes, scientists were able to view and identify chloroplasts. However, it wasn’t until the development of the electron microscope with its greater magnification and resolution, that scientists were able to view a chloroplast’s internal structure.
  • Structures such as the grana, stroma and thylakoids could then be identified. The role of each in the process of photosynthesis could then be studied.
  • Thylakoids are flattened, hollow discs which are arranged in stacks called grana. The stacking of the layers into grana increases stability and surface area for the capture of light.
  • The membranes of these thylakoids contain chlorophyll and are the site for the light-dependent reactions of photosynthesis.
  • The space outside the thylakoid is called the stroma, which is an aqueous fluid present within the inner membrane of the chloroplast. It contains DNA, ribosomes, lipid droplets and starch granules. This is where the light independent reactions, the Calvin cycle, takes place.
  • The functions described would not have been linked to the internal structures of the chloroplast without the development of an electron microscope.
Show Worked Solution
  • Using light microscopes, scientists were able to view and identify chloroplasts. However, it wasn’t until the development of the electron microscope with its greater magnification and resolution, that scientists were able to view a chloroplast’s internal structure.
  • Structures such as the grana, stroma and thylakoids could then be identified. The role of each in the process of photosynthesis could then be studied.
  • Thylakoids are flattened, hollow discs which are arranged in stacks called grana. The stacking of the layers into grana increases stability and surface area for the capture of light.
  • The membranes of these thylakoids contain chlorophyll and are the site for the light-dependent reactions of photosynthesis.
  • The space outside the thylakoid is called the stroma, which is an aqueous fluid present within the inner membrane of the chloroplast. It contains DNA, ribosomes, lipid droplets and starch granules. This is where the light independent reactions, the Calvin cycle, takes place.
  • The functions described would not have been linked to the internal structures of the chloroplast without the development of an electron microscope.

Filed Under: Cell Function, Cell Structure Tagged With: Band 4, Band 5, Band 6, smc-4302-30-Technology, smc-4303-10-Photosynthesis

CHEMISTRY, M2 2011 HSC 18* MC

A household cleaning agent contains a weak base with the formula \( \ce{NaX}\). 1.00 g of this compound was dissolved in water to give 100.0 mL of solution. A 20.0 mL sample of the solution was mixed with 0.100 mol L\(^{-1}\) hydrochloric acid, and required 24.4 mL of the acid for neutralisation.

\(\ce{NaX + HCl -> NaCl + HX}\)

What is the molar mass of the weak base?

  1. 82.0 g mol\(^{-1}\)
  2. 84.0 g mol\(^{-1}\)
  3. 122 g mol\(^{-1}\)
  4. 410 g mol\(^{-1}\)
Show Answers Only

\(A\)

Show Worked Solution

\(\ce{n(HCl)} = 0.100 \times 24.4 \times 10^{-3} = 2.44 \times 10^{-3}\ \text{mol}\)

\(\ce{n(NaX)}=2.44 \times 10^{-3}\ \text{mol in 20 mL sample.}\)

\(\ce{c(NaX)}=\dfrac{2.44 \times 10^{-3}}{20 \times 10^{-3}} =0.122\ \text{mol L}^{-1}\)

\(\ce{n(NaX)}=0.122 \times 0.1=0.0122\ \text{mol (in 100 mL sample)}\)

\(\ce{MM(NaX)}=\dfrac{1}{0.0122}=82\ \text{g mol}^{-1}\)

\(\Rightarrow A\)

Filed Under: Concentration and Molarity Tagged With: Band 6, smc-4261-20-Concentration Calculations, smc-4261-60-Dilutions, smc-4261-70-Standard Solutions

CHEMISTRY, M2 2013 HSC 17* MC

A 25.0 mL sample of a 0.100 mol L\(^{-1}\) hydrochloric acid solution completely reacted with 23.4 mL of sodium hydroxide solution.

\(\ce{HCl + NaOH -> NaCl + H2O}\)

\(\ce{CH3COOH + NaOH -> CH3COONa + H2O}\)

Given the two equations above. What volume of the same sodium hydroxide solution would be required to completely react with 25.0 mL of a 0.100 mol L\(^{-1}\) acetic acid solution \(\ce{(CH3COOH)}\)?

  1. Less than  23.4 mL
  2. 23.4 mL
  3. More than  23.4 mL
  4. Unable to calculate unless the concentration of the sodium hydroxide solution is also known
Show Answers Only

\(B\)

Show Worked Solution
  • The strength of the acid does not affect the volume of \(\ce{NaOH}\) required for nuetralisation.
  • It is dependent on stoichiometric ratios and both \(\ce{HCl}\) and \(\ce{CH3COOH}\) are monoprotic and so react in 1:1 ratio with sodium hydroxide.

\(\Rightarrow B\)

Filed Under: Concentration and Molarity Tagged With: Band 6, smc-4261-30-Volume Calculations

CHEMISTRY, M2 2013 HSC 22b

A solution contains three cations, \( \ce{Ba}^{2+}, \ce{Cu}^{2+}\) and \(\ce{Pb}^{2+}\). The flow chart indicates the plan used to confirm the identity of these cations.


Write a balanced net ionic equation for the formation of Precipitate 1.  (2 marks)

--- 4 WORK AREA LINES (style=lined) ---

Show Answers Only

\(\ce{Pb^{2+}(aq) + 2Cl-(aq) \rightarrow PbCl2(s)}\)

Show Worked Solution

\(\ce{Pb^{2+}(aq) + 2Cl-(aq) \rightarrow PbCl2(s)}\)

  • In the above flow chart, the addition of excess HCl causes one of the cations to precipitate out of the solution.
  • The remaining two are then distinguished through precipitation with excess sulfuric acid \(\ce{(H2SO4)}\).
  • Of the possible salts, only \(\ce{PbCl2(s)}\) is insoluble. Therefore Precipitate 1 is Lead \(\text{(II)}\) Chloride.
  • Balanced net ionic equation:  \(\ce{Pb^{2+}(aq) + 2Cl-(aq) \rightarrow PbCl2(s)}\)
♦♦♦ Mean mark 27%.

Filed Under: Chemical Reactions and Stoichiometry Tagged With: Band 6, smc-4259-50-Balancing Chemical Equations

CHEMISTRY, M1 2011 HSC 36bii

Explain the fact that Group I and Group II metal ions have one oxidation state while the transition metals often have multiple oxidation states.  (3 marks)

Show Answers Only


Show Worked Solution
  • Group I and II metals lose one or two ‘s’ valence shell electrons easily to acquire a noble gas electron configuration.
  • Removal of further electrons is difficult.
  • Thus Group I metals lose one electron and Group II metals lose two electrons to form +1 and +2 cations respectively.
  • Transitions elements lose ‘d’ shell electrons, to obtain a variety of oxidation states.

Filed Under: Atomic Structure and Atomic Mass Tagged With: Band 6, smc-4256-30-Electronic Configuration

BIOLOGY, M2 2016 HSC 31

As altitude increases, the partial pressure of oxygen \( \text{(p} \ce{O_2)}\) in air decreases. 

Species A and B are closely related endotherms that live in different habitats in Asia. The minimum \( \text{p} \ce{O_2}\) required for 100% blood oxygen saturation differs in these species because of differences in their haemoglobin structure. Data related to these two species are shown below.

\begin{equation}
\begin{array}{|c|c|c|}
\hline \text { Endotherm species } & \text { Habitat altitude } & \text { Minimum } \mathrm{pO}_2 \text { for } 100 \%\ \mathrm{Hb} \text { saturation } \\
\hline \mathrm{A} & \mathrm{High} & 54 \\
\mathrm{~B} & \text { Low } & 80 \\
\hline
\end{array}
\end{equation}

Explain how the differences in these species could have arisen, using the Darwin/Wallace theory of evolution and your understanding of the adaptive advantage of haemoglobin.  (8 marks)

--- 18 WORK AREA LINES (style=lined) ---

Show Answers Only
  • Haemoglobin is a protein that provides a mechanism for transport of oxygen around the body. As it is a protein, it’s structure is dependant on the individual’s genotype.
  • Species A and Species B are able to reach 100% saturation at differing partial pressures of oxygen, meaning they have different DNA which codes for different haemoglobin structures.
  • Species A and B are likely to have diverged from a common ancestor because of differing environmental pressures resulting in two different species. Within the ancestral population there was variation which resulted from random mutations. One mutation would have resulted in haemoglobin that is able to reach 100% saturation at a lower partial pressure of oxygen.
  • When members of the ancestral species moved to a higher altitude the ability of their haemoglobin to reach saturation at a lower \( \text{p} \ce{O_2}\) gave them a survival advantage. These individuals were then more likely to reproduce and pass on their favourable genes.
  • For individuals living at lower altitudes, there is no survival advantage to being able to reach 100% saturation at lower \( \text{p} \ce{O_2}\) which means this trait was not selected for.
  • Over time, due to the isolation at a higher altitude a new species evolved.
Show Worked Solution
  • Haemoglobin is a protein that provides a mechanism for transport of oxygen around the body. As it is a protein, it’s structure is dependant on the individual’s genotype.
  • Species A and Species B are able to reach 100% saturation at differing partial pressures of oxygen, meaning they have different DNA which codes for different haemoglobin structures.
  • Species A and B are likely to have diverged from a common ancestor because of differing environmental pressures resulting in two different species. Within the ancestral population there was variation which resulted from random mutations. One mutation would have resulted in haemoglobin that is able to reach 100% saturation at a lower partial pressure of oxygen.
  • When members of the ancestral species moved to a higher altitude the ability of their haemoglobin to reach saturation at a lower \( \text{p} \ce{O_2}\) gave them a survival advantage. These individuals were then more likely to reproduce and pass on their favourable genes.
  • For individuals living at lower altitudes, there is no survival advantage to being able to reach 100% saturation at lower \( \text{p} \ce{O_2}\) which means this trait was not selected for.
  • Over time, due to the isolation at a higher altitude a new species evolved.
♦♦ Mean mark 41%.

Filed Under: Natural Selection Tagged With: Band 4, Band 5, Band 6, smc-4309-10-Biological diversity

BIOLOGY, M1 2014 HSC 28

Rennin is an enzyme found in the stomach of young mammals. Rennin curdles the milk drunk by the mammal and allows the milk solids to stay longer in the stomach to be further digested.

Students conducted an investigation into rennin activity. They bubbled different volumes of carbon dioxide gas into milk samples. Each sample was 50mL and was kept at a constant temperature. The students then added rennin to each milk sample and recorded the time taken for the milk to curdle.
 

  1. Account for the students' calculated average time for 300 bubbles of \( \ce{CO_2} \).  (2 marks)

    --- 4 WORK AREA LINES (style=lined) ---

  2. Explain the results of this experiment.  (4 marks)

    --- 8 WORK AREA LINES (style=lined) ---

Show Answers Only

a.    Calculating the average:

  • The outlier (311 seconds) was removed from the data set, then the remaining data points at 300 bubbles of \(\ce{CO_2}\) were averaged.
  • This was necessary as it is significantly different to other values for time taken to curdle at that \(\ce{CO_2}\) volume and allowed the calculated average to fall within the predetermined trend. 

b.    As bubbles of \(\ce{CO_2}\) increase, time to curdle decreases.

  • This scenario is explicitly seen between 100-200 bubbles, where the curdling time reduces by 20 seconds at each interval.
  • This means increased concentration of \(\ce{CO_2}\) also increases activity of the enzyme.
  • As \(\ce{CO_2}\) increases acidity of a solution, these results show us that rennin activity increases at reduced pH levels.
  • The slower increase of enzyme activity after 250 bubbles of \(\ce{CO_2}\) is due to the enzyme being close to its optimum pH where the enzyme activity graph flattens off at the peak of the curve.

Show Worked Solution

a.    Calculating the average:

  • The outlier (311 seconds) was removed from the data set, then the remaining data points at 300 bubbles of \(\ce{CO_2}\) were averaged.
  • This was necessary as it is significantly different to other values for time taken to curdle at that \(\ce{CO_2}\) volume and allowed the calculated average to fall within the predetermined trend. 
♦ Mean mark (a) 46%.

b.    As bubbles of \(\ce{CO_2}\) increase, time to curdle decreases.

  • This scenario is explicitly seen between 100-200 bubbles, where the curdling time reduces by 20 seconds at each interval.
  • This means increased concentration of \(\ce{CO_2}\) also increases activity of the enzyme.
  • As \(\ce{CO_2}\) increases acidity of a solution, these results show us that rennin activity increases at reduced pH levels.
  • The slower increase of enzyme activity after 250 bubbles of \(\ce{CO_2}\) is due to the enzyme being close to its optimum pH where the enzyme activity graph flattens off at the peak of the curve.
♦♦♦ Mean mark (b) 35%.

Filed Under: Cell Function Tagged With: Band 5, Band 6, smc-4303-60-Enzymes

CHEMISTRY, M8 EQ-Bank 28

Limestone \(\ce{(CaCO_3)}\) contributes to the hardness of water by releasing \(\ce{Ca^2^+}\) ions. The following chemical equation represents this reaction.

\(\ce{CaCO3($s$) + H_2O($l$) + CO_2($g$) \rightleftharpoons Ca^2^+($aq$) + 2HCO3^-($aq$)}\)      \((\Delta H<0)\)

It has been suggested that heating water reduces its hardness.

Explain how this suggestion can be tested accurately, validly and reliably.   (9 marks)

--- 30 WORK AREA LINES (style=lined) ---

Show Answers Only
  • Atomic absorption spectroscopy (AAS) can be used to test if heating reduces water hardness.
  • It does this by calculating the concentrations of metal ions in solutions. AAS can calculate the concentration of \(\ce{Ca^{2+}}\) in heated and non-heated samples of water and any difference in the relative concentrations of \(\ce{Ca^{2+}}\) can be used to verify the suggestion.
  • It should be noted that a reduced concentration of \(\ce{Ca^{2+}}\) indicates that the water hardness is reduced.

Methodology of testing

  • Prepare standard solutions with known concentrations of \(\ce{Ca^{2+}}\) and measure their absorbance. Plot the concentrations against the absorbance of the standard solutions and draw a calibration curve (i.e. a line of best fit).
  • Measure the absorbance of a water sample before heating and another after heating. Using the absorbance and the calibration curve, calculate the concentration of \(\ce{Ca^{2+}}\) in each sample and compare the concentrations between the heated and unheated samples.
  • The AAS should be calibrated, at which point the concentration of calcium ions can be calculated to an accuracy in the parts per million (ppm). To ensure accurate calibration of the AAS, the standard solutions need to be prepared precisely which will involve the accurate weighing of solids and the use of a pipette or a similar instrument to measure solution volumes.
  • Water used in the experiment should be de-ionised (normal drinking water has an abundance of \(\ce{Na+}\) and \(\ce{Ca^{2+}}\)).
  • The margin of experimental error decreases when sufficient calibration samples are used and the measurement of absorbance of these samples is repeated and averaged. 
  • The reliability of results increases when many samples of heated and non-heated water are used to confirm that the concentrations of \(\ce{Ca^{2+}}\) in the heated water samples are consistently lower than the concentrations of \(\ce{Ca^{2+}}\) in the unheated water samples.
  • AAS can also be used to test the validity of the results. A hollow cathode lamp for calcium can direct light through the solution. This light has a specific wavelength that will only be absorbed by calcium ions. In this way, accurate measurements are made which can then be compared against the results and provide evidence of the validity of the original suggestion.
Show Worked Solution
  • Atomic absorption spectroscopy (AAS) can be used to test if heating reduces water hardness.
  • It does this by calculating the concentrations of metal ions in solutions. AAS can calculate the concentration of \(\ce{Ca^{2+}}\) in heated and non-heated samples of water and any difference in the relative concentrations of \(\ce{Ca^{2+}}\) can be used to verify the suggestion.
  • It should be noted that a reduced concentration of \(\ce{Ca^{2+}}\) indicates that the water hardness is reduced.

Methodology of testing

  • Prepare standard solutions with known concentrations of \(\ce{Ca^{2+}}\) and measure their absorbance. Plot the concentrations against the absorbance of the standard solutions and draw a calibration curve (i.e. a line of best fit).
  • Measure the absorbance of a water sample before heating and another after heating. Using the absorbance and the calibration curve, calculate the concentration of \(\ce{Ca^{2+}}\) in each sample and compare the concentrations between the heated and unheated samples.
  • The AAS should be calibrated, at which point the concentration of calcium ions can be calculated to an accuracy in the parts per million (ppm). To ensure accurate calibration of the AAS, the standard solutions need to be prepared precisely which will involve the accurate weighing of solids and the use of a pipette or a similar instrument to measure solution volumes.
  • Water used in the experiment should be de-ionised (normal drinking water has an abundance of \(\ce{Na+}\) and \(\ce{Ca^{2+}}\)).
  • The margin of experimental error decreases when sufficient calibration samples are used and the measurement of absorbance of these samples is repeated and averaged. 
  • The reliability of results increases when many samples of heated and non-heated water are used to confirm that the concentrations of \(\ce{Ca^{2+}}\) in the heated water samples are consistently lower than the concentrations of \(\ce{Ca^{2+}}\) in the unheated water samples.
  • AAS can also be used to test the validity of the results. A hollow cathode lamp for calcium can direct light through the solution. This light has a specific wavelength that will only be absorbed by calcium ions. In this way, accurate measurements are made which can then be compared against the results and provide evidence of the validity of the original suggestion.

Filed Under: Inorganic Substances Tagged With: Band 4, Band 5, Band 6, smc-3682-60-Colourimetry UV-Vis and AAS

PHYSICS, M7 EQ-Bank 28

In an experiment to investigate the photoelectric effect, a group of students used a piece of equipment containing a metal cathode inside a glass tube. The students were able to accurately measure both the current produced and the maximum energy of electrons in response to light hitting the cathode.

Explain how the choice of independent variable would give rise to different results. Sketch graphs to illustrate your answer.  (7 marks)

--- 18 WORK AREA LINES (style=lined) ---

Show Answers Only

Variables: the frequency of incident light (independent), and the maximum kinetic energy of ejected electrons (dependent).

  • Students would observe that below a certain frequency, no photoelectrons would be ejected. Photons with frequency less than the threshold frequency do not have enough energy to eject an electron.
  • Above this frequency, the students would observe that as the frequency increases, the kinetic energy of ejected electrons would increase linearly. This is because a specific amount of the photon’s energy is required to eject an electron, and any photon energy remaining is transferred to the electrons as kinetic energy, consistent with  `K_(max)=hf-Phi`.


Variables: intensity of incident light (independent) and the resultant photocurrent (dependent).

  • The frequency of light would be controlled and would be above the threshold frequency.
  • They would observe as the intensity of light increases the current produced would increase linearly.
  • This is because an increasing intensity of light increases the number of photons. This increases the rate at which photons strike the metal surface which increases the rate of photoelectron emission which in turn increases the photocurrent.
     

Show Worked Solution

Variables: the frequency of incident light (independent), and the maximum kinetic energy of ejected electrons (dependent).

  • Students would observe that below a certain frequency, no photoelectrons would be ejected. Photons with frequency less than the threshold frequency do not have enough energy to eject an electron.
  • Above this frequency, the students would observe that as the frequency increases, the kinetic energy of ejected electrons would increase linearly. This is because a specific amount of the photon’s energy is required to eject an electron, and any photon energy remaining is transferred to the electrons as kinetic energy, consistent with  `K_(max)=hf-Phi`.


Variables: intensity of incident light (independent) and the resultant photocurrent (dependent).

  • The frequency of light would be controlled and would be above the threshold frequency.
  • They would observe as the intensity of light increases the current produced would increase linearly.
  • This is because an increasing intensity of light increases the number of photons. This increases the rate at which photons strike the metal surface which increases the rate of photoelectron emission which in turn increases the photocurrent.
     

Filed Under: Light: Quantum Model Tagged With: Band 4, Band 5, Band 6, smc-3698-10-Photoelectric Effect

PHYSICS, M8 EQ-Bank 28

Our understanding of matter is still incomplete and the Standard Model of matter is still being validated and tested. Technology plays a substantial role in this.

Explain the role of technology in developing both the Standard Model of matter and our understanding in ONE other area of physics.  (9 marks)

--- 18 WORK AREA LINES (style=lined) ---

Show Answers Only

Technology and the development of the Standard Model

  • Technology has played a significant role in developing the standard model of matter.
  • Scientists have used the technology of linear accelerators to accelerate a beam of electrons at stationary protons. Technology was then used to analyse the scattering patterns of the electrons which was inconsistent with protons being fundamental particles.
  • It was determined that protons were comprised of both positive and negative internal charges. This led to the discovery of quarks.
  • Further, the Large Hadron Collider (LHC) is technology which accelerates protons to speeds extremely close to the speed of light, and collides them with each other.
  • When these protons collide, their dilated kinetic energy is converted to mass in the form of new particles such as the Higgs Boson. This significantly develops our understanding of the standard model of matter. 

Technology and Special Relativity

  • Another area of physics in which technology has played a vital role is special relativity.
  • Einstein’s prediction of time dilation has been validated by the Hafele-Keating experiment. Technology such as atomic clocks and high speed aeroplanes were used to demonstrate time differences recorded when atomic clocks were flown around the world.
  • In this instance, technology made it possible to validate Einstein’s predictions, improving our understanding of special relativity.
Show Worked Solution

Technology and the development of the Standard Model

  • Technology has played a significant role in developing the standard model of matter.
  • Scientists have used the technology of linear accelerators to accelerate a beam of electrons at stationary protons. Technology was then used to analyse the scattering patterns of the electrons which was inconsistent with protons being fundamental particles.
  • It was determined that protons were comprised of both positive and negative internal charges. This led to the discovery of quarks.
  • Further, the Large Hadron Collider (LHC) is technology which accelerates protons to speeds extremely close to the speed of light, and collides them with each other.
  • When these protons collide, their dilated kinetic energy is converted to mass in the form of new particles such as the Higgs Boson. This significantly develops our understanding of the standard model of matter. 

Technology and Special Relativity

  • Another area of physics in which technology has played a vital role is special relativity.
  • Einstein’s prediction of time dilation has been validated by the Hafele-Keating experiment. Technology such as atomic clocks and high speed aeroplanes were used to demonstrate time differences recorded when atomic clocks were flown around the world.
  • In this instance, technology made it possible to validate Einstein’s predictions, improving our understanding of special relativity.

Filed Under: Deep Inside the Atom Tagged With: Band 4, Band 5, Band 6, smc-3704-10-Standard Model, smc-3704-25-Linear Accelerator

PHYSICS, M6 EQ-Bank 9 MC

Two parallel conducting rods are connected by a wire as shown and carry current `I`. They are separated by distance `d` and repel each other with a force `F`.
 

Which graph best shows how the current `I` would need to be varied with distance `d` to keep the force `F` constant?
  

Show Answers Only

`D`

Show Worked Solution
  • Using `(F)/(l)=(mu_(0))/(2pi)(I_(1)I_(2))/(r)`  where  `I_(1)=I_(2)` and `r=d`
  •    `(F)/(l)=(mu_(0))/(2pi)(I^2)/(d)\ \ =>\ \ (I^2)/(d)=(2piF)/(mu_(0)l)`
  •  In this experiment, `I` and `d` are varied while `F` is kept constant. `2pi`, `mu_(0)` and `l` are constants.
  •    `(I^2)/(d)=k\ \ =>\ \ I=sqrt(kd)`
  • Hence, the graph will be a square root function.

`=>D`

Filed Under: The Motor Effect Tagged With: Band 6, smc-3694-30-Force Between Current-Carrying Conductors

BIOLOGY, M8 EQ-Bank 15

The diagram shows a rural coastal area and the towns, rivers and associated industry for each of the townships.
 

An epidemic of a disease has broken out in Nanavale. The symptoms are stomach ache, vomiting and tiredness. Many families in Nanavale have only one member with the disease, therefore it appears to be non-infectious. The symptoms are worse in infants than in adults.

Isolated cases of this disease have occurred in the nearby towns of Dairyville and Beefville. No cases have been reported on Gull Island.

Design an epidemiological study to investigate the origin of the disease. Refer to features of validity and reliability in your answer.   (7 marks)

--- 16 WORK AREA LINES (style=lined) ---

Show Answers Only
  • When planning an epidemiological study it is important to first analyse all the initial evidence to better construct an effective study.
  • The disease is most likely infectious as an outbreak that affects many people is very unlikely to be due to a previously masked non-infectious disease.
  • The fact that the disease is not present on gull island also supports this and may indicate that the disease is not waterborne and may spread through physical touch, close proximity, food or radioactive toxic elements.
  • The disease also affects children more severely. This fact must be addressed in the study and measures taken to protect and monitor this vulnerable group.
  • The study should survey affected families to try to pinpoint the transmission of the disease.
  • Appropriate fact finding questions should include
    • Where have you travelled to?
    • What have you eaten/drunk and where did you get it from?
    • Who else have you been in contact with and where are they from?
  • These results should be analysed for common factors and then compared to results from the same set of questions asked of unaffected families, thus increasing the study’s validity.
  • The more people that can be reached and questioned, the more accurate the findings of the study will be.
  • Geiger readings, screening and soil extraction may pinpoint whether the disease is caused by a carcinogen on the coastal area.
  • Common factors found in the study may also reveal an antidote or treatment for affected individuals.
Show Worked Solution
  • When planning an epidemiological study it is important to first analyse all the initial evidence to better construct an effective study.
  • The disease is most likely infectious as an outbreak that affects many people is very unlikely to be due to a previously masked non-infectious disease.
  • The fact that the disease is not present on gull island also supports this and may indicate that the disease is not waterborne and may spread through physical touch, close proximity, food or radioactive toxic elements.
  • The disease also affects children more severely. This fact must be addressed in the study and measures taken to protect and monitor this vulnerable group.
  • The study should survey affected families to try to pinpoint the transmission of the disease.
  • Appropriate fact finding questions should include
    • Where have you travelled to?
    • What have you eaten/drunk and where did you get it from?
    • Who else have you been in contact with and where are they from?
  • These results should be analysed for common factors and then compared to results from the same set of questions asked of unaffected families, thus increasing the study’s validity.
  • The more people that can be reached and questioned, the more accurate the findings of the study will be.
  • Geiger readings, screening and soil extraction may pinpoint whether the disease is caused by a carcinogen on the coastal area.
  • Common factors found in the study may also reveal an antidote or treatment for affected individuals.

Filed Under: Epidemiology Tagged With: Band 4, Band 5, Band 6, smc-3661-20-Evaluating the Method, smc-3661-30-Benefits

BIOLOGY, M8 EQ-Bank 16

How effective is renal dialysis in compensating for the loss of kidney function?   (7 marks)

--- 20 WORK AREA LINES (style=lined) ---

Show Answers Only

Normal kidney function

  • The kidneys are the main components of the mammalian urinary system. They are organs which filter blood and maintain water, pH, ion and salt concentration in the body through varying concentrations of each in excreted urine dependent on the body’s needs.
  • Each kidney contains 1 million nephrons, the main unit responsible for filtration.
  • Each one also contains a Bowman’s capsule, proximal and distal tubules as well as the Loop of Henle which acts as a site for selective re-absorption of certain components of the blood. This is controlled by both passive diffusion of unwanted substances through a concentration gradient (e.g. urea) or by hormonal control.
  • Aldosterone and ADH are hormones secreted by the hypothalamus which increase the permeability of the distal convoluted tubule to salt and water respectively.

Kidney disfunction and dialysis

  • Kidney function can however be impaired by diseases or disorders (such as polycystic kidney disease), many of which can kill affected individuals in a number of months if left untreated.
  • When kidney function drops below 80%, haemodialysis is an effective treatment to replace kidney function.
  • Haemodialysis involves the removal of blood from the body into the dialysis machine, which will clean the blood before returning it to the body. This is achieved by running a fluid known as dialysate, countercurrent to the blood.
  • The dialysate contains a similar composition to the blood with low urea and toxins to allow the passive diffusion of the substances via the concentration gradient into the dialysate. This is then removed and constantly replenished during a session. The countercurrent direction also improves effectiveness of this process. The dialysate can also be altered to have varying amounts of salt and ions depending on the concentration in the patients body.
  • Haemodialysis can provide an effective treatment for individuals until death or an effective transplant can be found, however the process often requires 3-4 sessions per week each of which is 4 hours long.
  • Without haemodialysis loss of kidney function is often fatal, but this life-saving technology is extremely effective in preventing many deaths despite its inconvenience.
Show Worked Solution

Normal kidney function

  • The kidneys are the main components of the mammalian urinary system. They are organs which filter blood and maintain water, pH, ion and salt concentration in the body through varying concentrations of each in excreted urine dependent on the body’s needs.
  • Each kidney contains 1 million nephrons, the main unit responsible for filtration.
  • Each one also contains a Bowman’s capsule, proximal and distal tubules as well as the Loop of Henle which acts as a site for selective re-absorption of certain components of the blood. This is controlled by both passive diffusion of unwanted substances through a concentration gradient (e.g. urea) or by hormonal control.
  • Aldosterone and ADH are hormones secreted by the hypothalamus which increase the permeability of the distal convoluted tubule to salt and water respectively.

Kidney disfunction and dialysis

  • Kidney function can however be impaired by diseases or disorders (such as polycystic kidney disease), many of which can kill affected individuals in a number of months if left untreated.
  • When kidney function drops below 80%, haemodialysis is an effective treatment to replace kidney function.
  • Haemodialysis involves the removal of blood from the body into the dialysis machine, which will clean the blood before returning it to the body. This is achieved by running a fluid known as dialysate, countercurrent to the blood.
  • The dialysate contains a similar composition to the blood with low urea and toxins to allow the passive diffusion of the substances via the concentration gradient into the dialysate. This is then removed and constantly replenished during a session. The countercurrent direction also improves effectiveness of this process. The dialysate can also be altered to have varying amounts of salt and ions depending on the concentration in the patients body.
  • Haemodialysis can provide an effective treatment for individuals until death or an effective transplant can be found, however the process often requires 3-4 sessions per week each of which is 4 hours long.
  • Without haemodialysis loss of kidney function is often fatal, but this life-saving technology is extremely effective in preventing many deaths despite its inconvenience.

Filed Under: Technologies and Disorders Tagged With: Band 4, Band 5, Band 6, smc-3663-10-Kidneys

BIOLOGY, M5 EQ-Bank 28

  1. Complete the following diagram to show the process by which gametes are formed.   (3 marks)


  2. How does the segregation of chromosomes during meiosis lead to a wide variety of gametes being produced?   (2 marks)

    --- 5 WORK AREA LINES (style=lined) ---

Show Answers Only

a.   


b.    Process creating wide variety of gametes

  • Independent assortment is the process by which homologous pairs are separated during meiosis into daughter cells.
  • During this process, daughter cell orientation and the cell they are separated into is random and not dependent on any factors.
  • This leads to a great variety in gametes due to the numerous combinations of chromosomes.
Show Worked Solution

a.   


b.    Process creating wide variety of gametes

  • Independent assortment is the process by which homologous pairs are separated during meiosis into daughter cells.
  • During this process, daughter cell orientation and the cell they are separated into is random and not dependent on any factors.
  • This leads to a great variety in gametes due to the numerous combinations of chromosomes.

Filed Under: Cell Replication Tagged With: Band 5, Band 6, smc-3649-20-Meiosis

PHYSICS, M8 EQ-Bank 27

Explain how the analysis of quantitative observations contributed to the development of the concept that certain matter and energy are quantised.   (9 marks)

--- 18 WORK AREA LINES (style=lined) ---

Show Answers Only

Experiments such as Millikan’s oil drop experiment and others testing the photoelectric effect have demonstrated that certain quantities of matter and energy are quantised which means they are multiples of some fundamental value.
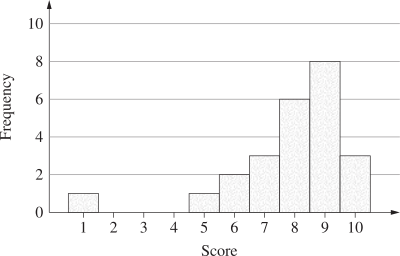
Millikan’s Oil Drop Experiment

  • Millikan’s oil drop experiment was able to show that charge is quantised. 
  • Millikan levitated oil drops in an electric field by balancing the electric and gravitational forces on them. This allowed him to find the electric force acting on each oil drop, and using the mass of the oil drop he found its charge.
  • Analysing his results, he found that the charge on every oil drop was an integer multiple of `1.602 xx10^(-19) C`. This was determined to be the fundamental charge on an electron.
  • Further, with Thompson’s later discovery of the charge to mass ratio of an electron, its mass could be determined. 

Photoelectric Effect

  • Photoelectric effect experiments showed the quantum properties of light which seemingly contradicted the view of light as a wave.
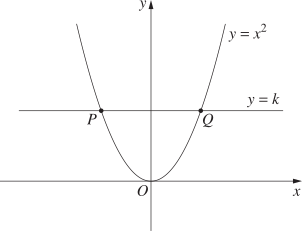
  • It was found that there was a minimum frequency (energy) of light that would cause photoemission when it was incident upon a metal plate, and no photoemission occurred with light lower than this frequency, regardless of intensity.
  • As one photon would strike one electron on the metal surface, the electron would receive a discrete amount of energy from that photon determined by its frequency `E=hf`. If a photon didn’t have enough energy, an electron couldn’t be removed.
  • This experimental evidence changed the conceptual understanding of energy within physics and provided a basis for the quantisation of the energy of light. 

Other quantitative experiments that could be explored include:

  • Bohr’s analysis of emission spectra to demonstrate the existence of quantised energy levels in atoms.
  • Cathode ray experiments showing the particle nature of electrons.
  • Blackbody radiation experiments. 
Show Worked Solution

Experiments such as Millikan’s oil drop experiment and others testing the photoelectric effect have demonstrated that certain quantities of matter and energy are quantised which means they are multiples of some fundamental value.
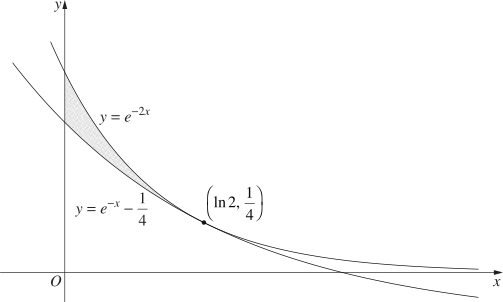
Millikan’s Oil Drop Experiment

  • Millikan’s oil drop experiment was able to show that charge is quantised. 
  • Millikan levitated oil drops in an electric field by balancing the electric and gravitational forces on them. This allowed him to find the electric force acting on each oil drop, and using the mass of the oil drop he found its charge.
  • Analysing his results, he found that the charge on every oil drop was an integer multiple of `1.602 xx10^(-19) C`. This was determined to be the fundamental charge on an electron.
  • Further, with Thompson’s later discovery of the charge to mass ratio of an electron, its mass could be determined. 

Photoelectric Effect
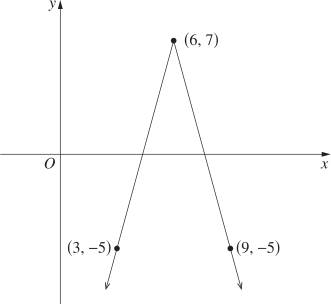
  • Photoelectric effect experiments showed the quantum properties of light which seemingly contradicted the view of light as a wave.
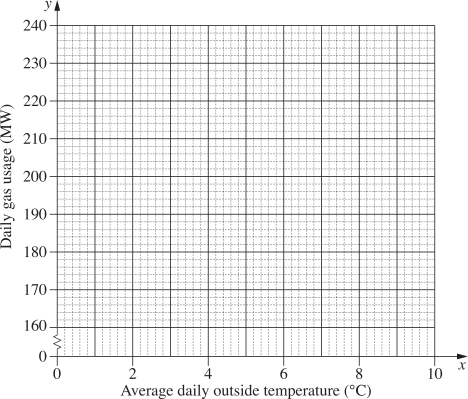
  • It was found that there was a minimum frequency (energy) of light that would cause photoemission when it was incident upon a metal plate, and no photoemission occurred with light lower than this frequency, regardless of intensity.
  • As one photon would strike one electron on the metal surface, the electron would receive a discrete amount of energy from that photon determined by its frequency `E=hf`. If a photon didn’t have enough energy, an electron couldn’t be removed.
  • This experimental evidence changed the conceptual understanding of energy within physics and provided a basis for the quantisation of the energy of light. 

Other quantitative experiments that could be explored include:

  • Bohr’s analysis of emission spectra to demonstrate the existence of quantised energy levels in atoms.
  • Cathode ray experiments showing the particle nature of electrons.
  • Blackbody radiation experiments. 

Filed Under: Light: Quantum Model, Structure of the Atom Tagged With: Band 4, Band 5, Band 6, smc-3698-10-Photoelectric Effect, smc-3698-80-Wave/Particle models, smc-3701-20-Millikan

Number, NAP-D4-NC05v2

Leo took $72 to the 2nd hand book shop and bought a number of books.

All the books cost the same amount.

Leo paid for all the books and had no money left.

Which of these could be the amount that one book cost?

`$11` `$9` `$7` `$5`


Show Answers Only

`$9`

Show Worked Solution

`$72 ÷ 8 = $9`

`text($9 is the only amount that can be evenly)`

`text(divided into $72 with no remainder.)`

Filed Under: Financial Maths Tagged With: Band 6

BIOLOGY, M6 2014 HSC 33e

The text below summarises some recent scientific experiments.

\begin{array} {|l|}
\hline
\ \ \rule{0pt}{4ex}  \text{Scientists, studying the development of human female embryos, recently }\\
\ \ \text{discovered a gene called XIST. This gene silences one of the two }\\
\ \ \text{X chromosomes so that they do not over-function in normal human females. }\\
\ \ \text{ }\\
\ \ \text{The scientists were then able to insert the XIST gene into human cells }\\
\ \ \text{grown in tissue culture to successfully silence other chromosomes. }\\
\ \ \text{ }\\
\ \ \text{Scientists are now attempting to insert the XIST gene into the extra }\\
\ \ \text{chromosome of mice that have trisomy. }\rule[-3ex]{0pt}{0pt}\\
\hline
\end{array}

With reference to genetics and gene technologies, explain these experiments and their implications.   (7 marks)

--- 15 WORK AREA LINES (style=lined) ---

Show Answers Only
  • The XIST gene is a gene which can ‘switch off’ whole chromosomes. This occurs naturally in females, where one X chromosome is shut off to prevent over-function.
  • With modern genetic technologies, this chromosome is able to be cut out of female embryos using restriction enzymes, then multiplied to produce adequate copies by PCR or recombinant DNA gene cloning in bacteria.
  • It is then able to silence any chromosome it is then inserted into.
  • This has potential to be a new form of gene therapy for people with conditions involving trisomy, where an individual is born with an extra chromosome.
  • This includes diseases such as Down syndrome (trisomy 21) and Klinefelter syndrome (XXY), which result in decreased quality of life, as well as shorter life span.
  • If successful, the XSIT gene will provide sufferers of these diseases with a normal phenotype by silencing one of their extra chromosomes.
  • This will facilitate a longer lifespan and a normal quality of life as if no abnormal gene was present for people with trisomy conditions, as well as being an effective gene therapy method in reducing international incidence of trisomies.
Show Worked Solution
  • The XIST gene is a gene which can ‘switch off’ whole chromosomes. This occurs naturally in females, where one X chromosome is shut off to prevent over-function.
  • With modern genetic technologies, this chromosome is able to be cut out of female embryos using restriction enzymes, then multiplied to produce adequate copies by PCR or recombinant DNA gene cloning in bacteria.
  • It is then able to silence any chromosome it is then inserted into.
  • This has potential to be a new form of gene therapy for people with conditions involving trisomy, where an individual is born with an extra chromosome.
  • This includes diseases such as Down syndrome (trisomy 21) and Klinefelter syndrome (XXY), which result in decreased quality of life, as well as shorter life span.
  • If successful, the XSIT gene will provide sufferers of these diseases with a normal phenotype by silencing one of their extra chromosomes.
  • This will facilitate a longer lifespan and a normal quality of life as if no abnormal gene was present for people with trisomy conditions, as well as being an effective gene therapy method in reducing international incidence of trisomies.

♦♦♦ Mean mark 29%.

Filed Under: Genetic Technologies Tagged With: Band 6, smc-3654-30-Benefits, smc-3654-80-Gene Cloning

BIOLOGY, M6 2014 HSC 32b

Construct a flow chart to summarise the process of the polymerase chain reaction to amplify DNA.   (4 marks)
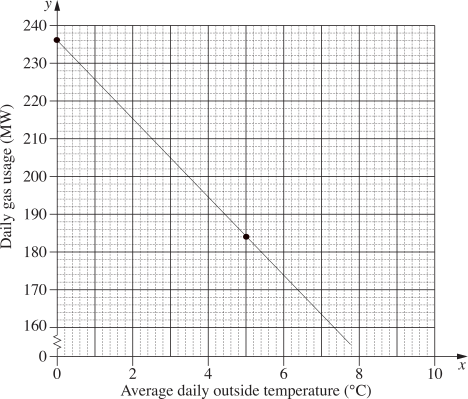
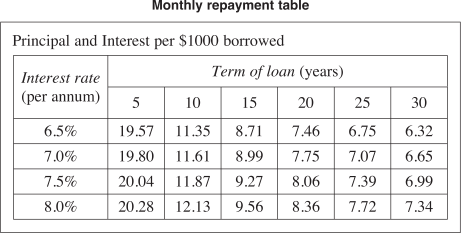
Show Answers Only

Show Worked Solution


♦♦ Mean mark 31%.

Filed Under: Genetic Technologies Tagged With: Band 6, smc-3654-80-Gene Cloning, smc-3654-95-Draw flow chart

BIOLOGY, M5 2014 HSC 32a

  1. Name the process for the synthesis of a polypeptide chain from a messenger-RNA base sequence.   (1 mark)

    --- 2 WORK AREA LINES (style=lined) ---

  2. Outline the steps in the formation of a functional enzyme from polypeptide chains.   (3 marks)

    --- 6 WORK AREA LINES (style=lined) ---

Show Answers Only

i.    Translation

ii.   Formation of a functional enzyme from polypeptide chains

  • A polypeptide will fold in a certain three-dimensional shape dependent on the amino acids, such as a sheet or a coil.
  • Multiple polypeptide chains will then link together to form a more specific shape. This shape will then go on to do a specific task as a protein.

Note: The following point is old syllabus knowledge.

  • One type of protein is an enzyme, which acts as a biological catalyst on certain substrates, primarily in metabolic reactions. The certain shape an enzyme makes due to the polypeptide chains within it is what dictates which substrate it will act on. 
Show Worked Solution

i.    Translation

ii.   Formation of a functional enzyme from polypeptide chains

  • A polypeptide will fold in a certain three-dimensional shape dependent on the amino acids, such as a sheet or a coil.
  • Multiple polypeptide chains will then link together to form a more specific shape. This shape will then go on to do a specific task as a protein.

Note: The following point is old syllabus knowledge.

  • One type of protein is an enzyme, which acts as a biological catalyst on certain substrates, primarily in metabolic reactions. The certain shape an enzyme makes due to the polypeptide chains within it is what dictates which substrate it will act on. 

♦♦ Mean mark (ii) 31%.

Filed Under: DNA and Polypeptide Synthesis Tagged With: Band 5, Band 6, smc-3650-11-RNA, smc-3650-60-Proteins

ENGINEERING, PPT 2017 HSC 5 MC

The image shows the microstructure of brass.

What type of grain structure does this image represent?

  1. Deformed
  2. Dendritic
  3. Equiaxed
  4. Stressed
Show Answers Only

`C`

Show Worked Solution
  • All grains are relatively equiaxed, without any major deformities or stresses.

`=>C`


♦♦♦ Mean mark 23%.

Filed Under: Materials Tagged With: Band 6, smc-3719-20-Annealing, smc-3719-40-Macro/microstructure

ENGINEERING, PPT 2017 HSC 20 MC

A compound lever system is shown.
 

What is the velocity ratio of this lever system?

  1. 1:1
  2. 2:1
  3. 4:1
  4. 6:1
Show Answers Only

`D`

Show Worked Solution
  • This question is solved by splitting the compound lever system into 2 parts, ‘cutting’ it through the vertical beam, and finding the VR of both sections.
  • VR is equal to the distance of the effort over the distance of the load.
  • For the right hand side, VR=200/100=2, and for the left hand side, VR=300/100=3.
  • The total VR is equal to these multiplied together, therefore the VR is 6:1.

`=>D`


♦♦♦ Mean mark 25%.

Filed Under: Mechanics Tagged With: Band 6, smc-3718-20-Velocity ratio

ENGINEERING, CS 2017 HSC 18 MC

The following graph shows the results of a tensile test on a metal sample.
 

What is the approximate 0.2% proof stress for this metal sample?

  1. 70 MPa
  2. 80 MPa
  3. 140 MPa
  4. 260 MPa
Show Answers Only

`C`

Show Worked Solution
  • To determine proof stress, draw a line parallel to the straight section of the curve, starting at 0.2% strain (on the x-axis).
  • The point where this line intersects the graph is the value for 0.2% proof stress and in this case is approximately 140 MPa.

`=>C`


♦♦♦ Mean mark 17%.

Filed Under: Engineering Mechanics Tagged With: Band 6

  • « Previous Page
  • 1
  • …
  • 7
  • 8
  • 9
  • 10
  • 11
  • …
  • 29
  • Next Page »

Copyright © 2014–2026 SmarterEd.com.au · Log in