The molar heat of combustion of pentan-1-ol is 2800 kJ mol−1. A quantity of pentan-1-ol was combusted, generating 108 kJ of heat. \(MM=88.146\ \text{gmol}^{-1}\)
What mass of pentan-1-ol was combusted? (2 marks)
Aussie Maths & Science Teachers: Save your time with SmarterEd
The molar heat of combustion of pentan-1-ol is 2800 kJ mol−1. A quantity of pentan-1-ol was combusted, generating 108 kJ of heat. \(MM=88.146\ \text{gmol}^{-1}\)
What mass of pentan-1-ol was combusted? (2 marks)
The table shows the heat of combustion for four compounds.
| \(\textit{Compound}\) | \(\textit{Heat of combustion}\) \( (\text{kJ mol}^{-1} )\) |
| \(\ce{CO}\) | \(233\) |
| \(\ce{CH4}\) | \(890\) |
| \(\ce{C2H2}\) | \(1300\) |
| \(\ce{C2H6}\) | \(1560\) |
Which of these compounds would produce the greatest amount of energy if 1.00 g of each is burnt?
The heat of combustion of propan-1-ol is 2021 kJ mol−1. Combustion takes place according to the equation:
\(\ce{2C3H7OH(l) + 9O2(g) \rightarrow 6CO2(g) + 8H2O(l)}\)
What mass of water is formed when 1530 kJ of energy is released? (2 marks)
--- 5 WORK AREA LINES (style=lined) ---
Hydrogen peroxide, \(\ce{H2O2}\), in aqueous solution at room temperature decomposes slowly and irreversibly to form water, \(\ce{H2O}\), and oxygen, \(\ce{O2}\), according to the following equation. \(\ce{2H2O2(aq)\rightarrow 2H2O(l) + O2(g)}\) \(\Delta H < 0\) --- 6 WORK AREA LINES (style=lined) --- --- 1 WORK AREA LINES (style=lined) ---
A coal-fired power station is used to generate electricity. Carbon dioxide, \(\ce{CO2}\), gas is produced as part of the process.
Carbon capture and storage is one option being considered to reduce the amount of \(\ce{CO2}\) released into the atmosphere. 5.17 × 10\(^4\) mol of \(\ce{CO2}\) is captured, cooled to 28 °C and stored in a sealed 20 000.0 L tank prior to transportation.
Calculate the pressure, in kilopascals, in the tank when it contains 5.17 × 10\(^4\) mol of \(\ce{CO2}\). (2 marks)
Butane, \(\ce{C4H10}\), undergoes complete combustion according to the following equation.
\(\ce{2C4H10(g) + 13O2(g)\rightarrow 8CO2(g) + 10H2O(g)}\)
67.0 g of \(\ce{C4H10}\) released 3330 kJ of energy during complete combustion at standard laboratory conditions (SLC).
Calculate the mass of carbon dioxide, \(\ce{CO2}\), produced in this reaction. (2 marks)
If 20.0 g of methane gas, \(\ce{CH4}\), is kept in a 5.0 L sealed container at 25 °C, what would be the pressure in the container? (2 marks)
Standard solutions of sodium hydroxide, \(\ce{NaOH}\), must be kept in airtight containers. This is because \(\ce{NaOH}\) is a strong base and absorbs acidic oxides, such as carbon dioxide, \(\ce{CO2}\), from the air and reacts with them. As a result, the concentration of \(\ce{NaOH}\) is changed to an unknown extent.
\(\ce{CO2}\) in the air reacts with water to form carbonic acid, \(\ce{H2CO3}\). This can react with \(\ce{NaOH}\) to form sodium carbonate, \(\ce{Na2CO3}\).
--- 1 WORK AREA LINES (style=lined) ---
--- 1 WORK AREA LINES (style=lined) ---
A condensation reaction involving 200 glucose molecules, \(\ce{C6H12O6}\), results in a polysaccharide. The molar mass, in g mol\(^{-1}\), of the polysaccharide is
This set of data was obtained from a motion investigation to determine the acceleration due to gravity on a planet other than Earth. --- 5 WORK AREA LINES (style=lined) ---
Time (s)
Vertical velocity (m s\(^{-1}\))
0.60
0.02
1.00
0.09
1.20
0.12
1.40
0.17
1.80
0.23
Plot the data from the table, and then calculate the acceleration. (3 marks)
 Show Worked Solution

\(\text{Acceleration}\)
\(=\dfrac{0.2-0.04}{1.6-0.72}\)
\(=\dfrac{0.16}{0.88}\)
\(=0.182\ \text{ms}^{-2}\)
Industrially, ethanol, \(\ce{C2H5OH} \), is made by either of two methods.
One method uses ethene, \(\ce{C2H4} \), which is derived from crude oil.
The other method uses a sugar, such as sucrose, \(\ce{C12H22O11}\), and yeast, in aqueous solution.
The production of \(\ce{C2H5OH}\) from \(\ce{C12H22O11}\) and yeast proceeds according to the equation
\( \ce{C12H22O11(aq) + H2O(l) \rightarrow 4C2H5OH(aq) + 4CO2(g)} \)
\(\ce{MM(C12H22O11) = 342\ \text{g mol}^{-1} }\) (2 marks)
--- 4 WORK AREA LINES (style=lined) ---
\(\ce{C2H4(g) + \text{insert box} ->[\text{catalyst}] C2H5OH(g) }\) (1 mark)
--- 5 WORK AREA LINES (style=lined) ---
--- 5 WORK AREA LINES (style=lined) ---
Outline a first-hand investigation to demonstrate the transfer of light by optical fibres (2 marks) --- 6 WORK AREA LINES (style=lined) --- → Using a laser beam or other light source, shine the light into a glass rod at an angle at an angle greater than the critical angle. → The light beam can then be seen to reflect off either side of the glass rod as it travels down the line of the rod. → This is called total internal reflection (TIR) and demonstrates effectively how light travels through a optical fibre, As seen in the diagram below. → Using a laser beam or other light source, shine the light into a glass rod at an angle at an angle greater than the critical angle. → The light beam can then be seen to reflect off either side of the glass rod as it travels down the line of the rod. → This is called total internal reflection (TIR) and demonstrates effectively how light travels through a optical fibre, As seen in the diagram below.
Show Answers Only
 Show Worked Solution
An electric field is produced between two charged parallel plates, \(M\) and \(N\).
![]()
The plates, \(M\) and \(N\), are 1.0 cm apart and have an electric field of 15 V m\(^{-1}\).
Calculate the potential difference between the plates. (2 marks)
--- 4 WORK AREA LINES (style=lined) ---
The table gives the heat of combustion of three different alcohols at 25°C.
| \( Alcohol \) | \( Heat \ of \ combustion \) \( \text{(Kj g} ^{-1}) \) |
| \( \text{Methanol} \) | \(22.68\) |
| \( \text{Ethanol} \) | \(29.67\) |
| \( \text{Butan-1-ol} \) | \(36.11\) |
The table shows four separate tests used to identify a dilute, aqueous sample of a compound.
\begin{array} {|c|l|l|}
\hline
\rule{0pt}{2.5ex} \textbf{Test Number} \rule[-1ex]{0pt}{0pt} & \quad \quad \quad \quad \quad \textbf{Test} & \quad \quad \quad \textbf{Observation}\\
\hline
\rule{0pt}{2.5ex} 1\rule[-1ex]{0pt}{0pt} & \text{Test with Red litmus} & \text{Stays red}\\
\hline
\rule{0pt}{2.5ex} 2 \rule[-1ex]{0pt}{0pt} & \text{Add \( \ce{Ba}^{2+} \) ions to a sample} & \text{White precipitate formed}\\
\hline
\rule{0pt}{2.5ex} 3 \rule[-1ex]{0pt}{0pt} & \text{Add \( \ce{OH}^{-} \) ions to a sample}& \text{Brown precipitate formed} \\
\hline
\rule{0pt}{2.5ex} 4 \rule[-1ex]{0pt}{0pt} & \text{Add \( \ce{Cl}^{-}\) ions to a sample}& \text{White precipitate formed}\\
\hline
\end{array}
Which compound would produce the observations shown?
An indicator solution was obtained by boiling a flower in water.
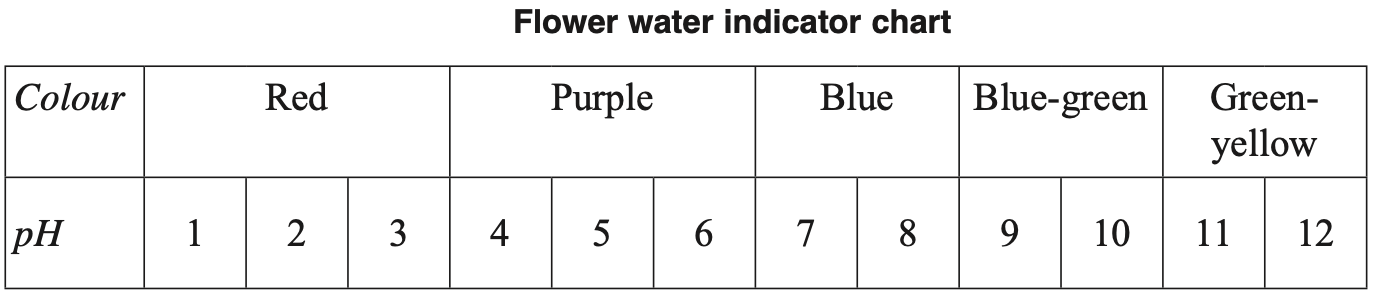
Two solutions were tested with this indicator.
Which row of the table correctly identifies the colour of each solution?
| \( \ce{H2SO4} \ (1 \ × \ 10^{-5} \ \text{mol L}^{-1}) \) | \( \ce{NaOH} \ (5 \ × \ 10^{-5} \ \text{mol L}^{-1}) \) | |
| \(\text{A.}\) | \( \text{Red} \) | \( \text{Green-yellow} \) |
| \(\text{B.}\) | \( \text{Red} \) | \( \text{Blue-green} \) |
| \(\text{C.}\) | \( \text{Purple} \) | \( \text{Blue-green} \) |
| \(\text{D.}\) | \( \text{Purple} \) | \( \text{Green-yellow} \) |
Which of the following correctly lists the compounds in order of increasing boiling point?
A titration was performed using two solutions of equal concentration, producing the following titration curve.

Which combination of solutions does the titration curve represent?
A mixture of 0.8 mol of \( \ce{CO} \text{(g)} \) and 0.8 mol of \( \ce{H2} \text{(g)} \) was placed in a sealed 1.0 L container. The following reaction occurred.
\( \ce{CO} \text{(g)} + 2 \ce{H2} \text{(g)} \rightleftharpoons \ce{CH3} \ce{OH}\text{(g)} \)
When equilibrium was established, the mixture contained 0.5 mol of \( \ce{CO} \text{(g)} \).
What amount of \( \ce{H2} \text{(g)} \) was present at equilibrium?
Which diagram represents the most concentrated weak acid?


Two charged plates are initially separated by a distance as shown in the diagram.

The potential difference between the plates remains constant.
Which of the graphs best represents the change in electric field strength as the distance between the two plates is increased?


The diagram shows a saucepan of water on an induction cooktop.

Which row of the table correctly identifies a property of the material used to make the saucepan and the frequency of the changing magnetic field produced by the coil?
| Property of saucepan | Frequency | |
| A. | Insulator | High (50 kHz) |
| B. | Conductor | High (50 kHz) |
| C. | Insulator | Low (50 Hz) |
| D. | Conductor | Low (50 Hz) |
An organic reaction pathway involving compounds \(\text{A, B,}\) and \(\text{C}\) is shown in the flow chart.
![]()
The molar mass of \(\text{A}\) is 84.156 g mol\(^{-1}\).
A chemist obtained some spectral data for the compounds as shown.

| \( \text{Data from} \ ^{1} \text{H NMR spectrum of compound C} \) | ||
| \( Chemical \ Shift \ \text{(ppm)} \) | \( Relative \ peak \ area \) | \( Splitting \ pattern \) |
| \(1.01\) | \(3\) | \(\text{Triplet}\) |
| \(1.05\) | \(3\) | \(\text{Triplet}\) |
| \(1.65\) | \(2\) | \(\text{Multiplet}\) |
| \(2.42\) | \(2\) | \(\text{Triplet}\) |
| \(2.46\) | \(2\) | \(\text{Quartet}\) |
| \( ^{1} \text{H NMR chemical shift data}\) | |
| \( Type \ of \ proton \) | \( \text{δ/ppm} \) |
| \( \ce{R - C\textbf{H}3,R - C\textbf{H}2 - R}\) | \(0.7-1.7\) |
| \( \left.\begin{array}{l}\ce{\textbf{H}3C - CO - \\-C\textbf{H}2 - CO -}\end{array}\right\} \begin{aligned} & \text { (aldehydes, ketones,} \\ &\text{carboxylic acids or esters) }\end{aligned}\) | \(2.0-2.6\) |
| \( \ce{R - C\textbf{H}O} \) | \(9.4-10.00\) |
| \( \ce{R - COO\textbf{H}} \) | \(9.0-13.0\) |
Identify the functional group present in each of compounds \(\text{A}\) to \(\text{C}\) and draw the structure of each compound. Justify your answer with reference to the information provided. (9 marks)
--- 28 WORK AREA LINES (style=lined) ---
Compound \(\text{A}\): Alkene

Compound \(\text{B}\): Secondary alcohol

Compound \(\text{C}\): Ketone

Reasoning as follows:
→ Compound \(\text{A}\) is able to undergo an addition reaction to add water across a \(\ce{C=C}\) bond \(\Rightarrow \) Alkene
→ Compound \(\text{B}\) is the product of the above hydration reaction and is therefore an alcohol.
→ The \(\ce{^{13}C\ NMR}\) spectrum of Compound \(\text{A}\) confirms it is an alkene (132 ppm peak corresponding to the \(\ce{C=C}\) atoms). 3 spectrum peaks indicate 3 carbon environments. The molar mass of compound \(\text{A}\) is 84.156 g mol\(^{-1}\) which suggests symmetry within the molecule.
→ The Infrared Spectrum of Compound \(\text{B}\) has a broad peak at approximately 3400 cm\(^{-1}\). This indicates the presence of an hydroxyl group and confirms \(\text{B}\) is an alcohol.
→ Compound \(\text{C}\) is produced by the oxidation of Compound \(\text{B}\) with acidified potassium permanganate.
→ Compound \(\text{C}\) is a carboxylic acid if \(\text{B}\) is a primary alcohol or a ketone if \(\text{B}\) is a secondary alcohol.
→ Since the \(\ce{^{1}H NMR}\) spectrum of \(\text{C}\) does not show any peaks between 9.0 − 13.0 ppm, it cannot be a carboxylic acid. Compound \(\text{C}\) is therefore a ketone and Compound \(\text{B}\) is a secondary alcohol.
→ The \(\ce{^{1}H NMR}\) spectrum shows 5 peaks \(\Rightarrow \) 5 hydrogen environments.
→ Chemical shift and splitting patterns information indicate:
1.01 ppm – 1.05 ppm: \(\ce{CH3}\) (next to a \(\ce{CH2}\))
1.65 ppm: \(\ce{CH2}\) (with multiple neighbouring hydrogens)
2.42 ppm: \(\ce{CH2}\) (next to the ketone \(\ce{C=O}\) and a \(\ce{CH2}\))
2.46 ppm: \(\ce{CH2}\) (next to the ketone \(\ce{C=O}\) and a \(\ce{CH3}\))
Compound \(\text{A}\): Alkene
Compound \(\text{B}\): Secondary alcohol
Compound \(\text{C}\): Ketone
Reasoning as follows:
→ Compound \(\text{A}\) is able to undergo an addition reaction to add water across a \(\ce{C=C}\) bond \(\Rightarrow \) Alkene
→ Compound \(\text{B}\) is the product of the above hydration reaction and is therefore an alcohol.
→ The \(\ce{^{13}C\ NMR}\) spectrum of Compound \(\text{A}\) confirms it is an alkene (132 ppm peak corresponding to the \(\ce{C=C}\) atoms). 3 spectrum peaks indicate 3 carbon environments. The molar mass of compound \(\text{A}\) is 84.156 g mol\(^{-1}\) which suggests symmetry within the molecule.
→ The Infrared Spectrum of Compound \(\text{B}\) has a broad peak at approximately 3400 cm\(^{-1}\). This indicates the presence of an hydroxyl group and confirms \(\text{B}\) is an alcohol.
→ Compound \(\text{C}\) is produced by the oxidation of Compound \(\text{B}\) with acidified potassium permanganate.
→ Compound \(\text{C}\) is a carboxylic acid if \(\text{B}\) is a primary alcohol or a ketone if \(\text{B}\) is a secondary alcohol.
→ Since the \(\ce{^{1}H NMR}\) spectrum of \(\text{C}\) does not show any peaks between 9.0 − 13.0 ppm, it cannot be a carboxylic acid. Compound \(\text{C}\) is therefore a ketone and Compound \(\text{B}\) is a secondary alcohol.
→ The \(\ce{^{1}H NMR}\) spectrum shows 5 peaks \(\Rightarrow \) 5 hydrogen environments.
→ Chemical shift and splitting patterns information indicate:
1.01 ppm – 1.05 ppm: \(\ce{CH3}\) (next to a \(\ce{CH2}\))
1.65 ppm: \(\ce{CH2}\) (with multiple neighbouring hydrogens)
2.42 ppm: \(\ce{CH2}\) (next to the ketone \(\ce{C=O}\) and a \(\ce{CH2}\))
2.46 ppm: \(\ce{CH2}\) (next to the ketone \(\ce{C=O}\) and a \(\ce{CH3}\))
The technique illustrated is used to analyse chemical substances in a sample.

What is the technique shown?
When performing industrial reductions with \(\mathrm{CO}(\mathrm{g})\), the following equilibrium is of great importance.
\( \ce{2CO(g) \rightleftharpoons CO2(g) + C(s) \quad \quad $K$_{e q} = 10.00 at 1095 K } \)
A 1.00 L sealed vessel at a temperature of 1095 K contains \( \ce{CO(g)} \) at a concentration of 1.10 × 10\(^{-2}\) mol L\(^{-1}\), \(\ce{CO2(g)} \) at a concentration of 1.21 × 10\(^{-3}\) mol L\(^{-1}\), and excess solid carbon.
--- 3 WORK AREA LINES (style=lined) ---
Carbon dioxide gas is added to the system above and the mixture comes to equilibrium. The equilibrium concentrations of \( \ce{CO(g)}\) and \(\ce{CO2(g)} \) are equal. Excess solid carbon is present and the temperature remains at 1095 K.
Calculate the amount (in mol) of carbon dioxide added to the system. (3 marks)
--- 10 WORK AREA LINES (style=lined) ---
Gases \( \ce{A_2} \) and \( \ce{B_2} \) are placed in a closed container of variable volume, as shown.

The reaction between these substances is as follows.
\( \ce{A2(g) + 2B_2(g) \rightleftharpoons 2AB_2(g) \quad \Delta \textit{H} = -10 \text{kJ mol}^{-1}} \)
The following graph shows changes in the amounts (in mol) of these three substances over time in this container.

--- 4 WORK AREA LINES (style=lined) ---
--- 8 WORK AREA LINES (style=lined) ---
Copper(\(\text{II}\)) ions \( \ce{(Cu^{2+})} \) form a complex with lactic acid \( \ce{(C3H6O3)} \), as shown in the equation.
\( \ce{Cu^{2+}(aq)} + \ce{2C3H6O3(aq)} \rightleftharpoons \Bigl[\ce{Cu(C3H6O3)2\Bigr]^{2+}(aq)} \)
This complex can be detected by measuring its absorbance at 730 nm. A series of solutions containing known concentrations of \( \Bigl[\ce{Cu(C3H6O3)_2\Big]^{2+}} \) were prepared, and their absorbances measured.
| \( Concentration \ of \Bigl[\ce{Cu(C3H6O3)_2\Bigr]^{2+}} \) \( \text{(mol L}^{-1}) \) | \( Absorbance \) |
| 0.000 | 0.00 |
| 0.010 | 0.13 |
| 0.020 | 0.28 |
| 0.030 | 0.43 |
| 0.040 | 0.57 |
| 0.050 | 0.72 |
| \( Species \) | \( Initial \ Concentration\) \( (\text{mol L}^{-1}) \) |
| \( \ce{Cu^{2+}} \) | 0.056 |
| \( \ce{C3H6O3} \) | 0.111 |
When the solution reached equilibrium, its absorbance at 730 nm was 0.66.
You may assume that under the conditions of this experiment, the only species present in the solution are those present in the equation above, and that \( \Bigl[ \ce{Cu(C3H6O3)_2\Bigr]^{2+}} \) is the only species that absorbs at 730 nm.
With the support of a line graph, calculate the equilibrium constant for the reaction. (7 marks)

--- 11 WORK AREA LINES (style=lined) ---

\(K_{eq}=1.3 \times 10^4\)
\(\text{From graph:}\)
\(\text{0.66 absorbance}\ \Rightarrow\ \ \Big[\bigl[\ce{Cu(C3H6O3)2\bigr]^{2+}\Big]} = 0.046\ \text{mol L}^{-1} \)
\begin{array} {|l|c|c|c|}
\hline & \ce{Cu^{2+}} & \ce{2C3H6O3(aq)} & \ce{\big[Cu(C3H6O3)2\big]^{2+}(aq)} \\
\hline \text{Initial} & \ \ \ \ 0.056 & \ \ \ \ 0.111 & 0 \\
\hline \text{Change} & -0.046 & -0.092 & \ \ \ +0.046 \\
\hline \text{Equilibrium} & \ \ \ \ 0.010 & \ \ \ \ 0.019 & \ \ \ \ \ \ 0.046 \\
\hline \end{array}
| \(K_{eq}\) | \(=\dfrac{\ce{\Big[\big[Cu(C3H6O3)2\big]^{2+}\Big]}}{\ce{\big[Cu^{2+}\big]\big[C3H6O3\big]^2}}\) | |
| \(=\dfrac{0.046}{0.010 \times 0.019^2}\) | ||
| \(=1.3 \times 10^4\) |
The following graph shows the solubility of some alkan-1-ols in water at 20°C.

Explain the relationship between the trend shown in the graph and the relevant intermolecular forces. (3 marks)
--- 8 WORK AREA LINES (style=lined) ---
Alkene \(\ce{Q}\) undergoes an addition reaction with chlorine gas to form compound \(\ce{R}\).
--- 4 WORK AREA LINES (style=lined) ---

--- 8 WORK AREA LINES (style=lined) ---
a. Chemical test for an alkene
→ Prepare a sample of alkene \(\ce{Q}\) in a clean test tube.
→ Add a few drops of bromine water to the sample.
→ The bromine water will be decolourised if \(\ce{Q}\) is an alkene.
Other correct answers could include:
→ The addition of potassium permanganate will also be decolourised by \(\ce{Q}\) if it is an alkene.
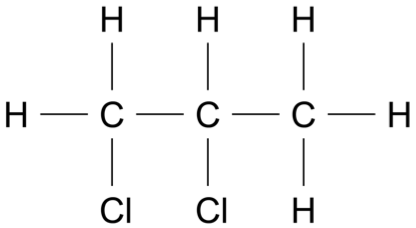
b. Molecular ion is present at m/z = 114
Atomic mass of \(\text{C}\) (in compound \(\ce{R}\)) = 32% × 114 = 36
\(\text{C}\) atoms in 1 molecule of R = 36 ÷ 12 = 3
Mass (non-\(\text{C}\)) = 114 – 36 = 78
\(\Rightarrow\) Two atoms of \(\ce{Cl}\) are in compound \(\ce{R}\)
\(\therefore\) \(\ce{R}\) has the formula \(\ce{C3H6Cl2}\), and structure:
a. Chemical test for an alkene
→ Prepare a sample of alkene \(\ce{Q}\) in a clean test tube.
→ Add a few drops of bromine water to the sample.
→ The bromine water will be decolourised if \(\ce{Q}\) is an alkene.
Other correct answers could include:
→ The addition of potassium permanganate will also be decolourised by \(\ce{Q}\) if it is an alkene.
b. Molecular ion is present at m/z = 114
Atomic mass of \(\text{C}\) (in compound \(\ce{R}\)) = 32% × 114 = 36
\(\text{C}\) atoms in 1 molecule of R = 36 ÷ 12 = 3
Mass (non-\(\text{C}\)) = 114 – 36 = 78
\(\Rightarrow\) Two atoms of \(\ce{Cl}\) are in compound \(\ce{R}\)
\(\therefore\) \(\ce{R}\) has the formula \(\ce{C3H6Cl2}\), and structure:
A student has been asked to produce 185 mL of ethanol (MM = 46.068 g mol\(^{-1} \)) by fermenting glucose using yeast, as shown in the equation.
\( \ce{C6H12O6(aq)} \rightarrow \ce{2C2H5OH(aq)} + \ce{2CO2(g)} \)
Given that the density of ethanol is 0.789 g mL\(^{-1} \), calculate the volume of carbon dioxide gas produced at 310 K and 100 kPa. (4 marks)
--- 7 WORK AREA LINES (style=lined) ---
A student used the apparatus shown to investigate the combustion of octan-1-ol.

The following results were obtained by the student.
| Mass of water heated | = 205 g |
| Initial temperature of water | = 23.7°C |
| Final temperature of water | = 60.4°C |
The following data are given.
| Molar enthalpy of combustion of octan-1-ol | = – 5294 kJ mol\(^{-1} \) |
| Molar mass of octan-1-ol | = 130.23 g kJ mol\(^{-1}\) |
--- 8 WORK AREA LINES (style=lined) ---
--- 4 WORK AREA LINES (style=lined) ---
The hydrogen oxalate ion \( \ce{(HC2O4^{-})} \) is classified as amphiprotic.
Describe, using chemical equations, how this ion is amphiprotic. (2 marks)
--- 4 WORK AREA LINES (style=lined) ---
The pH of two solutions, \(\text{X}\) and \(\text{Y}\), were measured before and after 10 drops of concentrated \( \ce{NaOH} \) was added to each.

Explain the pH changes that occurred in solutions \(\text{X}\) and \(\text{Y}\). (3 marks)
--- 8 WORK AREA LINES (style=lined) ---
Explain how the following substances would be classified under the Arrhenius and Brønsted-Lowry definitions of acids. Support your answer with relevant equations. (4 marks)
--- 12 WORK AREA LINES (style=lined) ---
The pH of a solution changes from 8 to 5.
What happens to the concentration of hydrogen ions during this change of pH?
The diagram shows apparatus that is used to investigate the interaction between the magnetic field produced by a coil and two copper rings \(X\) and \(Y\), when each is placed at position \(P\), as shown. Ring \(X\) is a complete circular ring, and a small gap has been cut in ring \(Y\). Each of the rings has a cross-sectional area of 4 × 10\(^{-4}\) m². The power supply connected to the coil produces an increasing current through the coil in the direction shown, when the switch is turned on. This produces a magnetic field at \(P\) that varies as shown in the graph. --- 7 WORK AREA LINES (style=lined) --- --- 4 WORK AREA LINES (style=lined) --- --- 4 WORK AREA LINES (style=lined) ---


The graph shows the increase in the global yield of wheat from 1800-2020. Genetically modified organisms (GMOs) are not currently used to grow wheat commercially.

What row in the table correctly identifies biotechnologies that have contributed to the increase in wheat yields and could be adapted to enhance commercial production in the future?
| Past (until 1960) | Present (1960-2023) | Future (2023 onward) | |
| A. | Selective breeding Embryo transfer |
GMO production Gene sequencing |
CRISPR Recombinant DNA technologies |
| B. | Selective breeding Embryo transfer |
Selective breeding Gene sequencing |
CRISPR Stem cell engineering |
| C. | Selective breeding Hybridisation | Artificial insemination Recombinant DNA technologies | CRISPR Stem cell engineering |
| D. | Selective breeding Hybridisation | Selective breeding Gene sequencing |
CRISPR Recombinant DNA technologies |
Cattle have been domesticated by humans for approximately 10 000 years. Many biotechnologies have been employed in the farming of cattle. The table shows examples of the application of these biotechnologies.
Biotechnology
Example
Selective breeding
The offspring of highest milk producing female cows were retained and over time cows that produced more milk were bred, leading to dairy breeds.
Artificial insemination
An American bull holds the current record for artificial insemination. He produced 2.4 million units of semen and has sired cattle in 50 countries.
Whole organism cloning
The success rate of cloning cattle is low. There are currently 30-40 cloned cattle in Australia. They are not used commercially.
Hybridisation
There are two species of domestic cattle, Bos taurus and Bos indicus. They can be hybridised to breed cattle with characteristics of both species.
Transgenic organisms
The first transgenic cow produced human serum albumin in its milk. The use of transgenic cattle is not widespread.
With reference to the table, evaluate the effect of biotechnologies on the biodiversity of cattle. (5 marks)
The mountain pygmy possum (Burramys parvus) is restricted to four regions in Australia's alpine zone. The species is listed as critically endangered with less than 2000 adults remaining. The range of the mountain pygmy possum has contracted due to a gradually warming climate. Loss and degradation of these habitats have affected local populations. The graph shows changes in the Mt Buller population following recent bushfires and the introduction of male pygmy possums from Mt Bogong. Evaluate how bushfires and the introduction of males from other locations have affected the population size and gene pool of the Mt Buller pygmy possum population. (7 marks) --- 18 WORK AREA LINES (style=lined) ---


Describe a named genetic technology and its use in a medical application. (4 marks)
Tetanus vaccines were introduced in 1953 resulting in reduced case numbers. The majority of recorded cases occurred in people aged 65 and over. The graph shows the vaccination schedule for tetanus. Assess the use of vaccinations and the vaccination schedule. Use the data provided to support your answer. (5 marks)

Organisms use various mechanisms to maintain their internal environment within tolerance limits. Explain TWO adaptations in plants that help to maintain water balance. (4 marks) --- 8 WORK AREA LINES (style=lined) ---
Organisms use various mechanisms to maintain their internal environment within tolerance limits. Outline a physiological adaptation in endotherms which assists in maintaining their internal environment. (2 marks)
--- 5 WORK AREA LINES (style=lined) --- --- 5 WORK AREA LINES (style=lined) ---
Air pollution has been linked to a variety of non-infectious neurological (brain) disorders. Some of the symptoms include memory loss, cognitive decline and impaired movement and coordination. 500 people from each of three major cities were surveyed and were monitored and tested for a period of 12 months. Each group included males and females aged between 20 and 50 years of age. The results after 12 months were as follows: Evaluate the method used in this epidemiological study in determining a link between air pollution and the symptoms. (7 marks) --- 16 WORK AREA LINES (style=lined) ---

Malaria is a potentially fatal infectious disease that is spread to humans by infected mosquitoes. Scientists investigated the behaviour of 20 mosquitoes for an hour in each of the four containers shown. Aim: To determine if wearing clean clothing reduces the transmission of malaria. Assume infected mosquitoes that land on clothing transmit malaria. --- 3 WORK AREA LINES (style=lined) --- --- 6 WORK AREA LINES (style=lined) ---

Experiment
Container A
Container B
Container C
Container D
1
15
7
12
5
2
19
5
9
3
3
12
4
14
6
4
18
6
13
4
5
19
6
10
3
Justify a suitable conclusion for this investigation. (3 marks)
The normal Huntingtin protein has 10−26 repeats of CAG. In Huntington’s 2 disease there are 37−80 repeats.
Diagram 1 shows a pedigree of a family known to be affected by Huntington's disease. Diagram 2 shows the results of gel electrophoresis on fragments of DNA from chromosome four, known to be altered in Huntington's disease.
Diagram 1

Diagram 2

Predict whether individuals \(S\) and \(U\) will be affected by Huntington's disease, and if so, at what age. Use data from the diagrams to justify your answer. (3 marks)
--- 6 WORK AREA LINES (style=lined) ---
The normal Huntingtin protein has 10–26 repeats of CAG. In Huntington's disease there are 37–80 repeats. This leads to an alteration in the structure of the protein. The graph shows the relationship between the age of onset of Huntington's disease and the number of CAG repeats. Explain the relationship between the number of CAG repeats and the age of onset of Huntington's disease. (2 marks) --- 5 WORK AREA LINES (style=lined) ---

Huntington's disease is an autosomal dominant genetic disease. Using the pedigree, justify the genotype of individual \(H\). In your answer, refer to the letters on the pedigree to identify individuals. (3 marks) --- 6 WORK AREA LINES (style=lined) ---

--- 6 WORK AREA LINES (style=lined) --- --- 6 WORK AREA LINES (style=lined) ---
Consider the following nuclear reaction \({ }_{\ \ 6}^{12} \text{C} +{ }_1^1 \text{H} \rightarrow{ }_5^9 \text{B} +{ }_2^4 \text{He}\) The masses of the isotopes in this process are shown in the table. --- 6 WORK AREA LINES (style=lined) ---
Isotope
Mass (\(u\))
\({ }_{\ \ 6}^{12} \text{C}\)
12.064
\({ }_5^9 \text{B}\)
9.013
\({ }_2^4 \text{He}\)
4.003
\({ }_1^1 \text{H}\)
1.008
Calculate the energy released in this reaction. (3 marks)
The diagram represents one type of electric motor. Describe the function of part \( X \). (2 marks) --- 5 WORK AREA LINES (style=lined) ---

An electron is travelling at 3.0 \(\times\) 10\(^{6}\) m s\(^{-1}\) in the path shown.

Calculate the magnetic field required to keep the electron in the path. (3 marks)
--- 6 WORK AREA LINES (style=lined) ---
The James Webb Space Telescope (JWST) is sensitive to wavelengths from 6.0 \(\times\) 10\(^{-7}\) m to 2.8 \(\times\) 10\(^{-5}\) m. What is the minimum photon energy that it can detect? (3 marks) --- 6 WORK AREA LINES (style=lined) ---
A spacecraft passes Earth at a speed of 0.9\(c\). The spacecraft emits a light pulse every 3.1 \(\times\) 10\(^{-9}\) s, as measured by the crew on the spacecraft. What is the time between the pulses, as measured by an observer on Earth? (3 marks) --- 6 WORK AREA LINES (style=lined) ---
A Hertzsprung–Russell diagram is shown. --- 4 WORK AREA LINES (style=lined) --- --- 6 WORK AREA LINES (style=lined) ---

The chart shows part of a nuclear decay series beginning with uranium.

Which option correctly identifies \(X\) and \(Y\) and the process by which each was produced?
| \(X\) | \(Y\) | |
| A. |
\({ }_{\ \ 90}^{234}\text{Th}\) alpha decay |
\({ }_{\ \ 91}^{234}\text{Pa}\) beta decay |
| B. |
\({ }_{\ \ 90}^{234}\text{Th}\) alpha decay |
\({ }_{\ \ 91}^{234}\text{Pa}\) alpha decay |
| C. |
\({ }_{\ \ 91}^{234}\text{Pa}\) beta decay |
\({ }_{\ \ 90}^{234}\text{Th}\) beta decay |
| D. |
\({ }_{\ \ 91}^{234}\text{Pa}\) beta decay |
\({ }_{\ \ 90}^{234}\text{Th}\) alpha decay |
The graph shows the relationship between radiation intensity and wavelength for a black body at 4500 K.

Which statement describes the expected difference in the graph for a black body at 4000 K?
A proton and a neutron travel at the same speed.
Which statement correctly explains the difference between their de Broglie wavelengths?
An electron would produce an electromagnetic wave when it is