Maya uses a buy now, pay later payment option to make a purchase of $120. Her repayments are split across 4 equal payments over 6 weeks. No interest is charged.
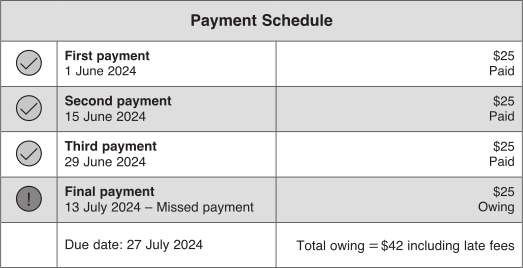
Maya misses her final payment on 16 March 2026 and is charged a late fee of $19. Maya's payment schedule is shown, with her balance totalling $49.
\begin{array}{|l|c|c|c|} \hline \textbf{Payment} & \textbf{Due Date} & \textbf{Amount} & \textbf{Status} \\ \hline \text{1st} & \text{2 February 2026} & \$30 & \text{Paid} \\ \hline \text{2nd} & \text{16 February 2026} & \$30 & \text{Paid} \\ \hline \text{3rd} & \text{2 March 2026} & \$30 & \text{Paid} \\ \hline \text{4th} & \text{16 March 2026} & \$30 & \text{Not Paid} \\ \hline \text{Outstanding Due} & \text{30 March 2026} & \$49 \text{ including late fee} & \\ \hline \end{array}
- Find the total amount Maya pays for her purchase if repaying in full on 30 March 2026. (1 mark)
--- 2 WORK AREA LINES (style=lined) ---
- Maya's bank offers short-term loans where simple interest is charged at 16% per annum.
Suppose Maya had borrowed $120 from the bank to make this purchase on 2 February 2026 and repaid it in full 8 weeks later.
How much would Maya have saved using this approach instead of the buy now, pay later option? (2 marks)--- 4 WORK AREA LINES (style=lined) ---