Construct a flow chart to summarise the main steps and products of the light-independent reactions of photosynthesis. (5 marks)
Show Answers Only

Show Worked Solution
Aussie Maths & Science Teachers: Save your time with SmarterEd
Construct a flow chart to summarise the main steps and products of the light-independent reactions of photosynthesis. (5 marks)
With the breakdown of proteins, animals produce ammonia, a nitrogenous waste product that must be removed. Direct removal of ammonia requires the excretion of large amounts of water.
Explain how both terrestrial mammals and insects conserve water while excreting nitrogenous wastes. (4 marks)
--- 6 WORK AREA LINES (style=lined) ---
\begin{array} {|l|l|} --- 4 WORK AREA LINES (style=lined) ---
\hline
\rule{0pt}{2.5ex}\textit{Dependent variable}\rule[-1ex]{0pt}{0pt} & \text{•} \ \ \ \ \ \ \ \ \ \ \ \ \ \ \ \ \ \ \ \ \ \ \ \ \ \ \ \ \ \ \ \ \ \ \ \ \ \ \ \ \ \ \ \ \ \ \ \ \ \ \ \ \ \ \ \ \ \ \ \ \ \ \ \ \ \ \ \ \ \ \ \ \ \ \ \ \\
\hline
\rule{0pt}{2.5ex}\textit{Control}\rule[-1ex]{0pt}{0pt} & \text{•} \\
\hline
\rule{0pt}{2.5ex}\textit{Variables to be kept constant}\rule[-1ex]{0pt}{0pt} & \text{•} \\ & \text{•} \\
\hline
\end{array}
Use the information provided to answer Questions 13 and 14.
\begin{array} {|l|}
\hline \text{This equation represents a common redox reaction.} \\ \ \ \ \ce{Cr2O7^{2-}(aq) + 14H+(aq) + 6Fe^{2+}(aq) \rightarrow 2Cr^{3+}(aq) + 6Fe^{3+}(aq) + 7H2O(l)} \\
\hline \end{array}
Question 13
What is the oxidising agent in the reaction?
Question 14
What is the value of \(\ce{E}_{\text {cell }}^{\ominus}\) for the reaction?
An electrochemical cell has the following structure.

This particular cell can be represented as:
\( \ce{Q} | \ce{Q^2+} || \ce{R^2+} | \ce{R} \)
Which of the following cells would produce the highest cell potential at standard conditions?
Consider the following redox reaction.
\( \ce{2K2Cr2O7}(aq) + \ce{2H2O}(l) + \ce{3S}(s) \rightarrow \ce{2Cr2O3}(aq) + \ce{4KOH}(aq) + \ce{3SO2}(g) \)
Which species is being oxidised?
Complete the table for THREE current leading causes of mortality for males and females in Australia. (4 marks)
--- 0 WORK AREA LINES (style=blank) ---
\begin{array}{|c|c|c|}
\hline
\rule{0pt}{2.5ex}\textit{Current leading} & \textit{Trend in mortality rate for} & \textit{Trend in mortality rate for}\\
\rule[-1ex]{0pt}{0pt}\quad \textit{cause of mortality} \quad & \textit{males over the last 10 years} & \textit{females over the last 10 years}\\
\hline
\quad & \quad &\quad\\
\quad & \quad &\quad\\
\quad & \quad &\quad\\
\quad & \quad &\quad\\
\hline
\quad & \quad &\quad\\
\quad & \quad &\quad\\
\quad & \quad &\quad\\
\quad & \quad &\quad\\
\hline
\quad & \quad &\quad\\
\quad & \quad &\quad\\
\quad & \quad &\quad\\
\quad & \quad &\quad\\
\hline
\end{array}
Phosphorus pentoxide reacts with water to form phosphoric acid according to the following equation.
\(\ce{P2O5}(s) + \ce{3H2O}(l) \rightarrow \ce{2H3PO4}(aq)\)
Phosphoric acid reacts with sodium hydroxide according to the following equation.
\(\ce{H3PO4}(aq) + \ce{3NaOH}(aq) \rightarrow \ce{Na3PO4}(aq) + \ce{3H2O}(l)\)
A student reacted 1.42 g of phosphorus pentoxide with excess water.
What volume of 0.30 mol L\(^{-1}\) sodium hydroxide would be required to neutralise all the phosphoric acid produced?
A chemist analysed aspirin tablets for quality control. The initial step of the analysis was the standardisation of a \(\ce{NaOH}\) solution. Three 25.00 mL samples of a 0.1034 mol L\(^{-1}\) solution of standardised \(\ce{HCl}\) were titrated with the \( \ce{NaOH} \) solution. The average volume required for neutralisation was 25.75 mL.
Three flasks were prepared each containing a mixture of 25 mL of water and 10 mL of ethanol. An aspirin tablet was dissolved in each flask. The aspirin in each solution was titrated with the standardised \(\ce{NaOH}\) solution according to the following equation:
\(\ce{C9H8O4(aq) + NaOH(aq) \rightarrow C9H7O4Na(aq) + H2O(l)}\)
The following titration results were obtained.
\begin{array} {|c|c|}
\hline
\rule{0pt}{2.5ex}\textit{Tablet}\rule[-1ex]{0pt}{0pt} & \textit{Volume}\ \text{(mL)}\\
\hline
\rule{0pt}{2.5ex}\text{1}\rule[-1ex]{0pt}{0pt} & 16.60\\
\hline
\rule{0pt}{2.5ex}\text{2}\rule[-1ex]{0pt}{0pt} & 16.50\\
\hline
\rule{0pt}{2.5ex}\text{3}\rule[-1ex]{0pt}{0pt} & 16.55\\
\hline
\end{array}
A student attempted to determine the concentration of a hydrochloric acid solution. The following steps were performed.
Step 1. A conical flask was rinsed with water.
Step 2. A 25.0 mL pipette was rinsed with water.
Step 3. The student filled the pipette with a standard sodium carbonate solution to the level shown in the diagram.
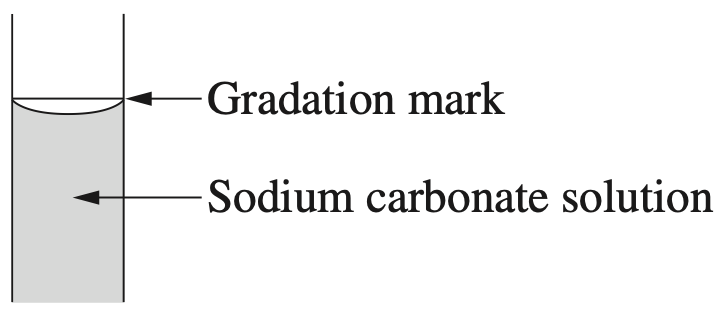
Step 4. The standard sodium carbonate solution in the pipette was transferred to the conical flask. The student ensured that all of the sodium carbonate solution was transferred to the conical flask by blowing through the pipette. Three drops of an appropriate indicator were added to the conical flask.
Step 5. A burette was rinsed with the hydrochloric acid solution and then filled with the acid. The student then carried out a titration to determine the concentration of the hydrochloric acid solution.
In steps 2,3 and 4 above the student did not follow acceptable procedures.
The graph shows the maximum dissolved oxygen concentration in water as a function of temperature at normal atmospheric pressure.

What is the volume of \(\ce{O2}\) that can dissolve in 10.0 L of water at 25°C and normal atmospheric pressure?
The nitrogen content of bread was determined using the following procedure:
--- 4 WORK AREA LINES (style=lined) ---
--- 2 WORK AREA LINES (style=lined) ---
--- 4 WORK AREA LINES (style=lined) ---
--- 4 WORK AREA LINES (style=lined) ---
Sodium azide is used in automobile airbags to provide a source of nitrogen gas for rapid inflation in an accident.The equation shows the production of nitrogen gas from sodium azide.
\( \ce{2NaN3}(s) \rightarrow \ce{2Na}(s) + \ce{3N2}(g)\)
What mass of sodium azide will produce 40L of \(\ce{N2}\) at 100 kPa and 0°C?
All of the carbon dioxide in a soft drink with an initial mass of 381.04 g was carefully extracted and collected as a gas. The final mass of the drink was 380.41 g.
What volume would the carbon dioxide occupy at 100 kPa and 25°C?
When charcoal reacts in the presence of oxygen, carbon monoxide and carbon dioxide are produced according to the following chemical reactions.
\( \ce{C}(s) +\frac{1}{2} \ce{O}_2(g) \rightarrow \mathrm{CO}(g)\)
\(\ce{C}(s) +\ce{O2}(g) \rightarrow \ce{CO2}(g)\)
What would be the total mass of gas produced when 400 g of charcoal is reacted, assuming equal amounts are consumed in each reaction?
A batch of dry ice (solid \(\ce{CO_2}\)) was contaminated during manufacture. To determine its purity, the following steps were carried out.

A solution of hydrochloric acid was standardised by titration against a sodium carbonate solution using the following procedure.
The titration was performed and the hydrochloric acid was found to be 0.200 mol L\(^{-1} \).
--- 4 WORK AREA LINES (style=lined) ---
--- 14 WORK AREA LINES (style=lined) ---
The graph shows the first ionisation energy of some elements.

Account for the trends in the graph in terms of the electron configuration of the elements. (3 marks)
Experimental evidence from emission line spectra of gaseous atoms has highlighted both the merits and the limitations of Bohr's atomic model.
Discuss Bohr's atomic model with reference to this evidence. (5 marks)
Which of the following lists contains ONLY unstable isotopes?
Evaluate the contribution of the Bohr model to the development of our understanding of the structure of the atom. (7 marks)
'Science has been used to solve problems in the investigation of evolutionary
relationships between humans and other primates, and so has provided information of interest to society.'
Justify this statement in terms of the scientific knowledge behind DNA-DNA hybridisation AND karyotype analysis. (7 marks)
--- 20 WORK AREA LINES (style=lined) ---
--- 4 WORK AREA LINES (style=lined) ---


The students concluded that their data were conflicting and they could not determine the relative ages of the fossils.
Evaluate the students' conclusion with reference to the data presented. (4 marks)
--- 8 WORK AREA LINES (style=lined) ---
A new fossil form was recently found in South Africa. This fossil shares characteristics with both the genus Australopithecus and the genus Homo. There has been debate as to whether this new fossil form should be classified in the genus Australopithecus or in the genus Homo. --- 3 WORK AREA LINES (style=lined) --- --- 8 WORK AREA LINES (style=lined) ---
The table compares some of the amino acids present in a particular protein in different primates.

Using these data and your knowledge of the characteristics of primate groups, explain why using different types of data improves the reliability of estimated evolutionary relationships. (5 marks)
→ The amino acid data set shows that chimpanzees and humans have identical amino acids in this protein.
→ Gorillas show one amino acid difference, new world monkeys show three amino acid differences and prosimians show four amino acid differences.
→ On the basis of this data, it can be assessed that chimpanzees and humans are identical, followed by gorillas then new world monkeys and then prosimians.
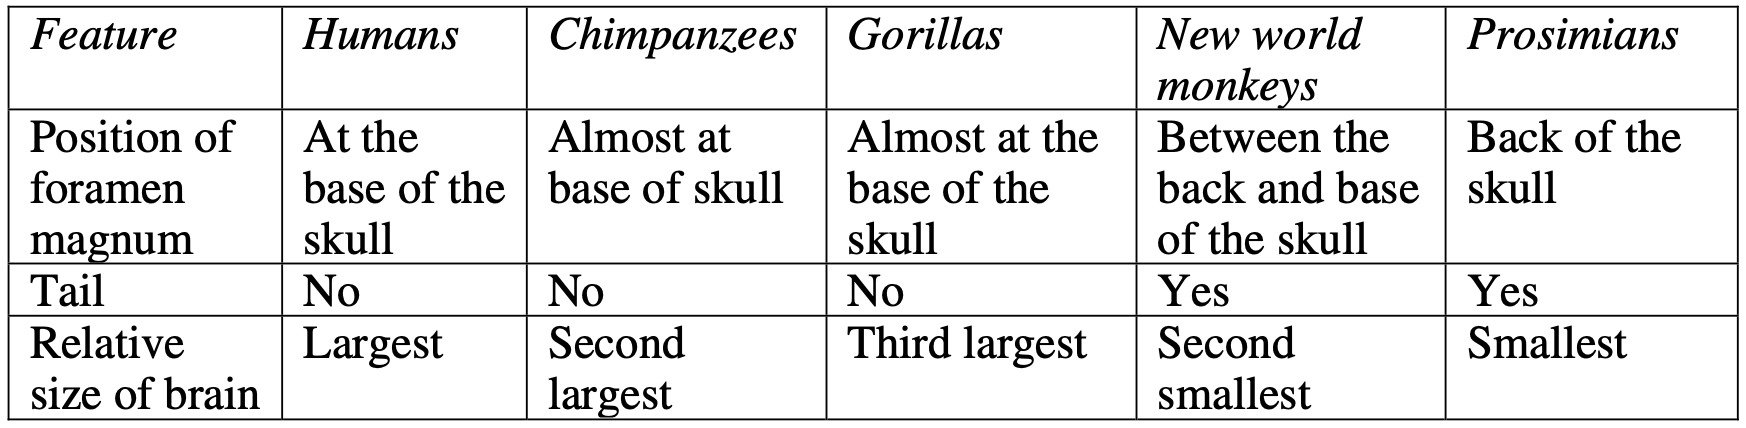
→ The morphological characteristics outlined in the table would rank the organisms in evolutionary proximity as chimpanzees most closely related to humans but different species, followed by gorillas then new world monkeys and then prosimians.
→ Both data sets correlate and therefore the estimates of evolutionary proximity to humans can be considered to be more reliable.
--- 2 WORK AREA LINES (style=lined) ---
--- 7 WORK AREA LINES (style=lined) ---
Most offspring resemble their parents in a number of characteristics, but there are often some characteristics in the offspring that are unexpected.
Explain, using examples, how genetics and the environment can affect the phenotype of individuals. (8 marks)
--- 16 WORK AREA LINES (style=lined) ---
Geological and biological history of New Zealand

Use this information and other relevant knowledge to demonstrate how the practice of biology has led to the validation of current theories of evolution. (7 marks)
--- 18 WORK AREA LINES (style=lined) ---
Explain how Darwin/Wallace's theory of evolution by natural selection and isolation accounts for convergent evolution. Use an example to support your answer. (5 marks)
--- 8 WORK AREA LINES (style=blank) ---
--- 5 WORK AREA LINES (style=lined) ---
a.
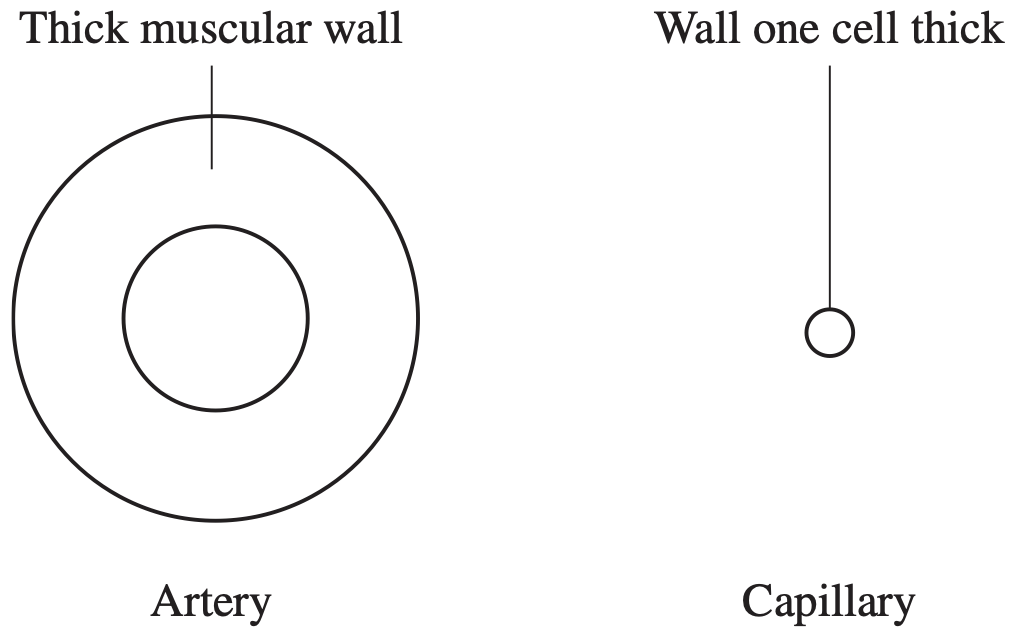
b. Structure: One cell thick wall.
Related function: Allows diffusion of small molecules through the capillary wall to allow substances in and out of the bloodstream.
a.
b. Structure: One cell thick wall.
Related function: Allows diffusion of small molecules through the capillary wall to allow substances in and out of the bloodstream.
--- 3 WORK AREA LINES (style=lined) ---
The steps below show the preparation and use of blood products in the treatment of Ebola Virus Disease. This disease is characterised by significant blood loss.

--- 8 WORK AREA LINES (style=lined) ---
As altitude increases, the partial pressure of oxygen \( \text{(p} \ce{O_2)}\) in air decreases.
Species A and B are closely related endotherms that live in different habitats in Asia. The minimum \( \text{p} \ce{O_2}\) required for 100% blood oxygen saturation differs in these species because of differences in their haemoglobin structure. Data related to these two species are shown below.
\begin{equation}
\begin{array}{|c|c|c|}
\hline \text { Endotherm species } & \text { Habitat altitude } & \text { Minimum } \mathrm{pO}_2 \text { for } 100 \%\ \mathrm{Hb} \text { saturation } \\
\hline \mathrm{A} & \mathrm{High} & 54 \\
\mathrm{~B} & \text { Low } & 80 \\
\hline
\end{array}
\end{equation}
Explain how the differences in these species could have arisen, using the Darwin/Wallace theory of evolution and your understanding of the adaptive advantage of haemoglobin. (8 marks)
--- 18 WORK AREA LINES (style=lined) ---
--- 6 WORK AREA LINES (style=blank) ---
--- 6 WORK AREA LINES (style=lined) ---
a.

b. Sugar transportation:
b. Sugar transportation:
Rennin is an enzyme found in the stomach of young mammals. Rennin curdles the milk drunk by the mammal and allows the milk solids to stay longer in the stomach to be further digested. Students conducted an investigation into rennin activity. They bubbled different volumes of carbon dioxide gas into milk samples. Each sample was 50mL and was kept at a constant temperature. The students then added rennin to each milk sample and recorded the time taken for the milk to curdle. --- 4 WORK AREA LINES (style=lined) --- --- 8 WORK AREA LINES (style=lined) ---

The graph below shows the results obtained from testing the activity of a bacterial enzyme.

--- 2 WORK AREA LINES (style=lined) ---
--- 1 WORK AREA LINES (style=lined) ---
--- 8 WORK AREA LINES (style=lined) ---
--- 1 WORK AREA LINES (style=lined) ---
Explain why insects excrete uric acid as their principal nitrogenous waste. (2 marks)
--- 5 WORK AREA LINES (style=lined) --- --- 0 WORK AREA LINES (style=lined) ---

Influenza is an infectious respiratory disease. In humans, it can be caused by the influenza A or influenza B viruses. Antigenic drift can result in small changes to the structure of the antigens on the surface of the influenza virus, as shown in the diagram below. --- 1 WORK AREA LINES (style=lined) --- --- 5 WORK AREA LINES (style=lined) ---

Over time, the South African cheetah population has suffered drastic reduction due to periodic droughts, disease and hunting. Currently, only small, isolated populations of cheetahs exist in the wild.
Explain, in terms of genetic diversity, why cheetah populations are now on the verge of extinction. (3 marks)
--- 6 WORK AREA LINES (style=lined) ---
The information in the table shows how the solubility of lead chloride is affected by temperature.

Using a graph, calculate the solubility product \((K_{sp})\) of the dissolution of lead chloride at 50°C. Include a fully labelled graph and a relevant chemical equation in your answer (6 marks)

--- 12 WORK AREA LINES (style=lined) ---

\(\ce{PbCl2(s) \rightleftharpoons Pb^2+(aq) + 2Cl^-(aq)}\)
\(\ce{Using the graph:}\)
\(\ce{Solubility (50°) = 0.7 g/100 g water = 7 g/L}\)
\(\ce{Converting to mol L^{-1}:}\)
\[\ce{MM(PbCl2) = 207.2 + 2 \times 35.45 = 278.1}\]
\[\ce{n = \frac{m}{MM} = \frac{7}{278.1} = 0.0252 mol L^{-1}}\]
\(\ce{[Pb^2+(aq)] = 0.0252 mol L^{-1}}\)
\(\ce{Mole ratio \ Pb^2+ : Cl^- = 1:2}\)
\(\Rightarrow \ce{[Cl^-] = 2 \times 0.0252 = 0.0504 mol L^{-1}}\)
\begin{aligned}
\ce{$K_{sp}$} & \ce{= [Pb^2+][Cl^-]^{2}} \\
& \ce{=0.0252 \times (0.0504)^{2}} \\
& \ce{= 6.4 \times 10^{-5}} \\
\end{aligned}
A 100 mL saturated solution of calcium hydroxide at 25°C contains 0.173 g of calcium hydroxide.
--- 7 WORK AREA LINES (style=lined) ---
--- 2 WORK AREA LINES (style=lined) ---
Equal volumes of four different acids are titrated with the same base at 25°.
Information about these acids is given in the table.

Which acid requires the greatest volume of base for complete reaction?
The flowchart shown outlines the sequence of steps used to determine the concentration of an unknown hydrochloric acid solution.

Describe steps A, B and C including correct techniques, equipment and appropriate calculations. Determine the concentration of the hydrochloric acid. (8 marks)
--- 16 WORK AREA LINES (style=lined) ---
Explain why a mixture of acetic acid (1 M) and sodium acetate (1 M) can act as a buffer while a mixture of hydrochloric acid (1 M) and sodium chloride (1 M) cannot. (3 marks)
--- 8 WORK AREA LINES (style=lined) ---
The pH of a 0.30 M aqueous propanoic acid solution was measured to be 2.7. The dissociation of propanoic acid is represented below.
\(\ce{CH3CH2COOH($aq$) + H2O($l$) \rightleftharpoons CH3CH2COO^-($aq$) + H3O^{+}($aq$)}\)
Calculate the `K_a` of the solution. (3 marks)
Contrast ONE addition polymer and ONE condensation polymer in terms of their structures, properties and uses. Include structural formulae in your answers. (7 marks)
--- 20 WORK AREA LINES (style=lined) ---
Addition polymer – polyethylene. Condensation polymer – nylon.
Structures


Properties
Applications
Addition polymer – polyethylene. Condensation polymer – nylon.
Structures
Properties
Applications
The graph shows changes in pH for the titrations of equal volumes of solutions of two monoprotic acids, Acid 1 and Acid 2.

Explain the differences between Acid 1 and Acid 2 in terms of their relative strengths and concentrations. (3 marks)
--- 6 WORK AREA LINES (style=lined) ---
What will happen when sulfuric acid is added to a saturated solution of sparingly soluble calcium sulfate?
0.20 moles of phosphorus pentachloride were heated to 200°C in a 2 L container in the presence of a vanadium catalyst according to the following reaction.
\( \ce{PCl5(g) \rightleftharpoons PCl3(g) + Cl2(g)}\)
At equilibrium, the mixture was found to contain 0.16 moles of chlorine.
Which of the following is the equilibrium constant for this reaction at this temperature?
The container shown is initially full of water.

Water leaks out of the bottom of the container at a constant rate.
Which graph best shows the depth of water in the container as time varies?
| A. |  |
B. |  |
| C. |  |
D. |  |
Blake opens a new credit card account on 1 May. He uses it, for the first time, on 4 May to buy concert tickets for $850.
He makes no further purchases or repayments during the month of May.
A statement for the credit card is issued on the last day of each month.
The statement for May shows that interest is charged at 19.75% per annum, compounding daily, from 20 May (included) until 31 May (included).
--- 6 WORK AREA LINES (style=lined) ---
--- 1 WORK AREA LINES (style=lined) ---
Three gases \(\ce{X, Y}\) and \(\ce{Z}\) were mixed in a closed container and allowed to reach equilibrium. A change was imposed at time \(\ce{$T$}\) and the equilibrium was re-established. The concentration of each gas is plotted against time.

--- 2 WORK AREA LINES (style=lined) ---
--- 4 WORK AREA LINES (style=lined) ---
Nitrogen dioxide (a brown gas) and dinitrogen tetroxide (a colourless gas) are both forms of oxides of nitrogen. They are in equilibrium according to the equation
\( \ce{2NO2(g) \rightleftharpoons N2O4(g)}\).
An equilibrium mixture of the two gases at room temperature is light brown but at higher temperatures the colour becomes a much deeper brown.
What conclusion can be drawn from this observation?
This flow chart shows reactions involving six different organic compounds (A to F).

Draw the structures of compounds A to F, justifying your diagrams with reference to the information provided. (7 marks)
--- 16 WORK AREA LINES (style=lined) ---
A:

B:

C:

D:

E:

F:

C:
B:
D:
A:
E:
F:
\(\ce{Fe^2^+}\) and \(\ce{X} \) react to form an ionic compound according to the general equation
\(\ce{aFe^2^+ + $b$(X)\rightleftharpoons [Fe_a(X)_b]^2^a^+}\)
where \(\ce{$a$}\) and \(\ce{$b$}\) are numbers representing the ratio in which \(\ce{Fe^2^+}\) and \(\ce{X} \) combine.
Spectrophotometry was used to determine the stoichiometric ratio between \(\ce{Fe^2^+}\) and \(\ce{X} \). To do this, eight 10 mL samples were prepared by reacting solutions of \(\ce{Fe^2^+}\) with solutions of \(\ce{X} \) in varying ratios. All \(\ce{Fe^2^+}\) and \(\ce{X} \) solutions had the same concentration. The absorbance of the samples is tabulated below.


--- 8 WORK AREA LINES (style=lined) ---
a.

b. Find values of \(\ce{$a$}\) and \(\ce{$b$}\):
a.
b. Find values of \(\ce{$a$}\) and \(\ce{$b$}\):
Limestone \(\ce{(CaCO_3)}\) contributes to the hardness of water by releasing \(\ce{Ca^2^+}\) ions. The following chemical equation represents this reaction.
\(\ce{CaCO3($s$) + H_2O($l$) + CO_2($g$) \rightleftharpoons Ca^2^+($aq$) + 2HCO3^-($aq$)}\) \((\Delta H<0)\)
It has been suggested that heating water reduces its hardness.
Explain how this suggestion can be tested accurately, validly and reliably. (9 marks)
--- 30 WORK AREA LINES (style=lined) ---
An industrial plant makes ammonia from nitrogen gas and hydrogen gas. The reaction is exothermic.
The graph shows the adjustments made to increase the yield of ammonia.

Account for the changes in conditions that have shaped the graph during the time the system was observed. Include a relevant chemical equation in your answer. (5 marks)
A student used the following scale diagram to investigate orbital properties. The diagram shows a planet and two of its moons, \(V\) and \(W\). The distances between each of the moons and the planet are to scale while the sizes of the objects are not.

Complete the table to compare the orbital properties of Moon \(V\) and Moon \(W\). Show relevant calculations in the space below the table. (4 marks)
--- 0 WORK AREA LINES (style=lined) ---
\begin{array}{|l|c|c|c|}
\hline
\rule{0pt}{2.5ex} & \textit{Orbital radius} & \textit{Orbital period} & \textit{Orbital velocity}\\
& \text{(\(W\) relative to \(V\))} \rule[-1ex]{0pt}{0pt}& \text{(\(W\) relative to \(V\))} & \text{(\(W\) relative to \(V\))} \\
\hline
\rule{0pt}{3.5ex}\text{Quantitative}&\text{}&\text{}&\text{}\\
\text{comparison}\rule[-2ex]{0pt}{0pt}&\text{}&\text{}&\text{}\\
\hline
\rule{0pt}{3.5ex}\text{Qualitative}&\text{}&\text{}&\text{}\\
\text{comparison}\rule[-2ex]{0pt}{0pt}&\text{}&\text{}&\text{}\\
\hline
\end{array}
A bullet is fired vertically from the surface of Mars, at the escape velocity of Mars. Another bullet is fired vertically from the surface of Earth, at the escape velocity of Earth.
Neglecting air resistance, compare the energy transformations of the two bullets. (5 marks)
In the 1840s, French physicist, Hippolyte Fizeau performed an experiment to measure the speed of light. He shone an intense light source at a mirror 8 km away and broke up the light beam with a rotating cogwheel. He adjusted the speed of rotation of the wheel until the reflected light beam could no longer be seen returning through the gaps in the cogwheel.
The diagram shows a similar experiment. The cogwheel has 50 teeth and 50 gaps of the same width.

Explain why specific speeds of rotation of the cogwheel will completely block the returning light. Support your answer with calculations. (5 marks)
--- 13 WORK AREA LINES (style=lined) ---