Mark buys one raffle ticket in a raffle with 1000 tickets.
Which of the following best describes the probability that Mark wins?
- Certain
- Even chance
- Unlikely
- Impossible
Aussie Maths & Science Teachers: Save your time with SmarterEd
Mark buys one raffle ticket in a raffle with 1000 tickets.
Which of the following best describes the probability that Mark wins?
A monic polynomial, \(f(x)\), of degree 3 with real coefficients has \(3\) and \(2+i\) as two of its roots.
Which of the following could be \(f(x)\) ?
Which of the following vectors is perpendicular to \(3 \underset{\sim}{i}+2 \underset{\sim}{j}-5 \underset{\sim}{k}\) ?
A network of towns and the distances between them in kilometres is shown. --- 2 WORK AREA LINES (style=lined) --- --- 4 WORK AREA LINES (style=lined) ---

Sarah, a 60 kg female, consumes 3 glasses of wine at a family dinner over 2.5 hours. Note: there are 1.2 standard drinks in one glass of wine. The blood alcohol content \((BAC)\) for females can be estimated by \(B A C_{\text {female}}=\dfrac{10 N-7.5 H}{5.5 M},\) --- 4 WORK AREA LINES (style=lined) --- The time it takes a person's BAC to reach zero is given by \(\text {Time}=\dfrac{B A C}{0.015}.\) Calculate the time it takes for Sarah's BAC to return to zero, assuming she stopped drinking after 2.5 hours. Give your answer to the nearest minute. (2 marks) --- 4 WORK AREA LINES (style=lined) ---
where \(N\)
= number of standard drinks
\(H\)
= number of hours drinking
\(M\)
= mass in kilograms
Zazu works a 38-hour week and is paid at an hourly rate of $45. Any overtime hours worked are paid at time-and-a-half. In a particular week, Zazu worked the regular 38 hours and some overtime hours. In that week Zazu earned $2790. How many hours of overtime did Zazu work in that week? (3 marks) --- 6 WORK AREA LINES (style=lined) ---
A network of towns and the distances between them in kilometres is shown. --- 2 WORK AREA LINES (style=lined) --- --- 4 WORK AREA LINES (style=lined) ---
A researcher is studying anacondas (a type of snake).
A dataset recording the age (in years) and length (in cm) of female and male anacondas is displayed on the graph.
Anacondas reach maturity at about 4 years of age.

Write THREE observations about anacondas that may be made from the scatterplot. (Note: No calculations are required.) (3 marks)
--- 6 WORK AREA LINES (style=lined) ---
In a particular electrical circuit, the voltage \(V\) (volts) across a capacitor is given by \(V(t)=6.5\left(1-e^{-k t}\right)\), where \(k\) is a positive constant and \(t\) is the number of seconds after the circuit is switched on. --- 0 WORK AREA LINES (style=blank) --- --- 6 WORK AREA LINES (style=lined) --- --- 4 WORK AREA LINES (style=lined) --- a. b. \(k=0.511\) c. \(1.195\ \text{V/s}\) b. \(V=6.5(1-e^{-kt})\) \(\text{When}\ \ t=1, V=2.6:\) \(\dfrac{dV}{dt}=6.5ke^{-kt}\) \(\text{Find}\ \dfrac{dV}{dt}\ \text{when}\ \ t=2:\)
![]()
Show Answers Only
 Show Worked Solution
a.
Show Worked Solution
a.
♦ Mean mark (a) 49%.
\(2.6\)
\(=6.5(1-e^{-k})\)
\(1-e^{-k}\)
\(=0.4\)
\(e^{-k}\)
\(=0.6\)
\(-k\)
\(=\ln(0.6)\)
\(k\)
\(=0.5108…\)
\(=0.511\ \text{(3 d.p.)}\)
c. \(V=6.5-6.5e^{-kt}\)
\(\dfrac{dV}{dt}\)
\(=6.5 \times 0.511 \times e^{-2 \times 0.511}\)
\(=1.1953…\)
\(=1.195\ \text{V/s (3 d.p.)}\)
represents which gas law?
According to Gay-Lussac's Law, the pressure of a gas is directly proportional to which quantity, assuming the volume and the number of moles are constant?
--- 4 WORK AREA LINES (style=lined) ---
--- 8 WORK AREA LINES (style=lined) ---
The graph of the function \(g(x)\) is shown.

Using the graph, complete the table with the words positive, zero or negative as appropriate. (3 marks)
--- 0 WORK AREA LINES (style=lined) ---
\begin{array} {|l|c|}
\hline
\rule{0pt}{2.5ex} \textit{\(x\)-value} \rule[-1ex]{0pt}{0pt} & \textit{First derivative of \(g(x)\) at \(x\)} \rule[-1ex]{0pt}{0pt} & \textit{Second derivative of \(g(x)\) at \(x\)} \\
\hline
\rule{0pt}{2.5ex} \text{\(x=-3\)} \rule[-1ex]{0pt}{0pt} & \text{ } \rule[-1ex]{0pt}{0pt} & \text{ } \\
\hline
\rule{0pt}{2.5ex} \text{\(x=1\)} \rule[-1ex]{0pt}{0pt} & \text{ } \rule[-1ex]{0pt}{0pt} & \text{ } \\
\hline
\rule{0pt}{2.5ex} \text{\(x=5\)} \rule[-1ex]{0pt}{0pt} & \text{ } \rule[-1ex]{0pt}{0pt} & \text{ } \\
\hline
\end{array}
What is \( {\displaystyle \int(6 x+1)^3 d x} \) ?
A piece of zinc weighing 3.20 grams is placed into a beaker containing 300.0 mL of 0.7500 mol/L hydrochloric acid.
\(\ce{Zn(s) + 2HCl(aq) -> ZnCl2(aq) + H2(g)}\)
--- 4 WORK AREA LINES (style=lined) ---
--- 4 WORK AREA LINES (style=lined) ---
Pia's marks in Year 10 assessments are shown. The scores for each subject were normally distributed.
\begin{array}{|l|c|c|c|}
\hline & \textit {Pia's mark} & \textit {Year 10 mean} & \textit {Year 10 standard} \\
&&&\textit {deviation}\\
\hline \text {English} & 78 & 66 & 6 \\
\hline \text {Mathematics} & 80 & 71 & 10 \\
\hline \text {Science} & 77 & 70 & 15 \\
\hline \text {History} & 85 & 72 & 9 \\
\hline
\end{array}
In which subject did Pia perform best in comparison with the rest of Year 10?
Initially there are 350 litres of water in a tank. Water starts flowing into the tank.
The rate of increase of the volume `V` of water in litres is given by `\frac{dV}{dt}=300-7.5t`, where `t` is the time in hours.
Find the volume of water in the tank when `\frac{dV}{dt}=0`. (3 marks)
--- 10 WORK AREA LINES (style=lined) ---
The curves `y=(x-1)^2` and `y=5-x^2` intersect at two points, as shown in the diagram.

--- 4 WORK AREA LINES (style=lined) ---
--- 8 WORK AREA LINES (style=lined) ---
Find the sum of the terms in the arithmetic series
\(50 + 57 + 64 +\ ...\ +2024\) (3 marks)
--- 8 WORK AREA LINES (style=lined) ---
In a group of 60 students, 38 play basketball, 35 play hockey and 5 do not play either basketball or hockey.
How many students play both basketball and hockey?
\(\text{Method 1:}\)

\(\text{Method 2:}\)
| \(n(B \cup H)\) | \(=n(B) + n(H)-n(B \cap H) \) | |
| \(55\) | \(=38+35-n(B \cap H) \) | |
| \(n(B \cap H) \) | \(=18\) |
\( \Rightarrow B \)
Consider the function shown.

Which of the following could be the equation of this function?
| Metal | Reaction when heated with oxygen | Reaction when heated with water |
| \(\ce{Mg}\) | \(\text{burns readily if powered to form oxides}\) | \(\ce{\text{forms}\ OH\ \text{ions and hydrogen gas}}\) |
| \(\ce{Al}\) | \(\text{reacts with steam to form oxide ions and hydrogen gas}\) | |
| \(\ce{Zn}\) | ||
| \(\ce{Fe}\) |
Using the table above, which of the following equations correctly represents the reaction of aluminium with water?
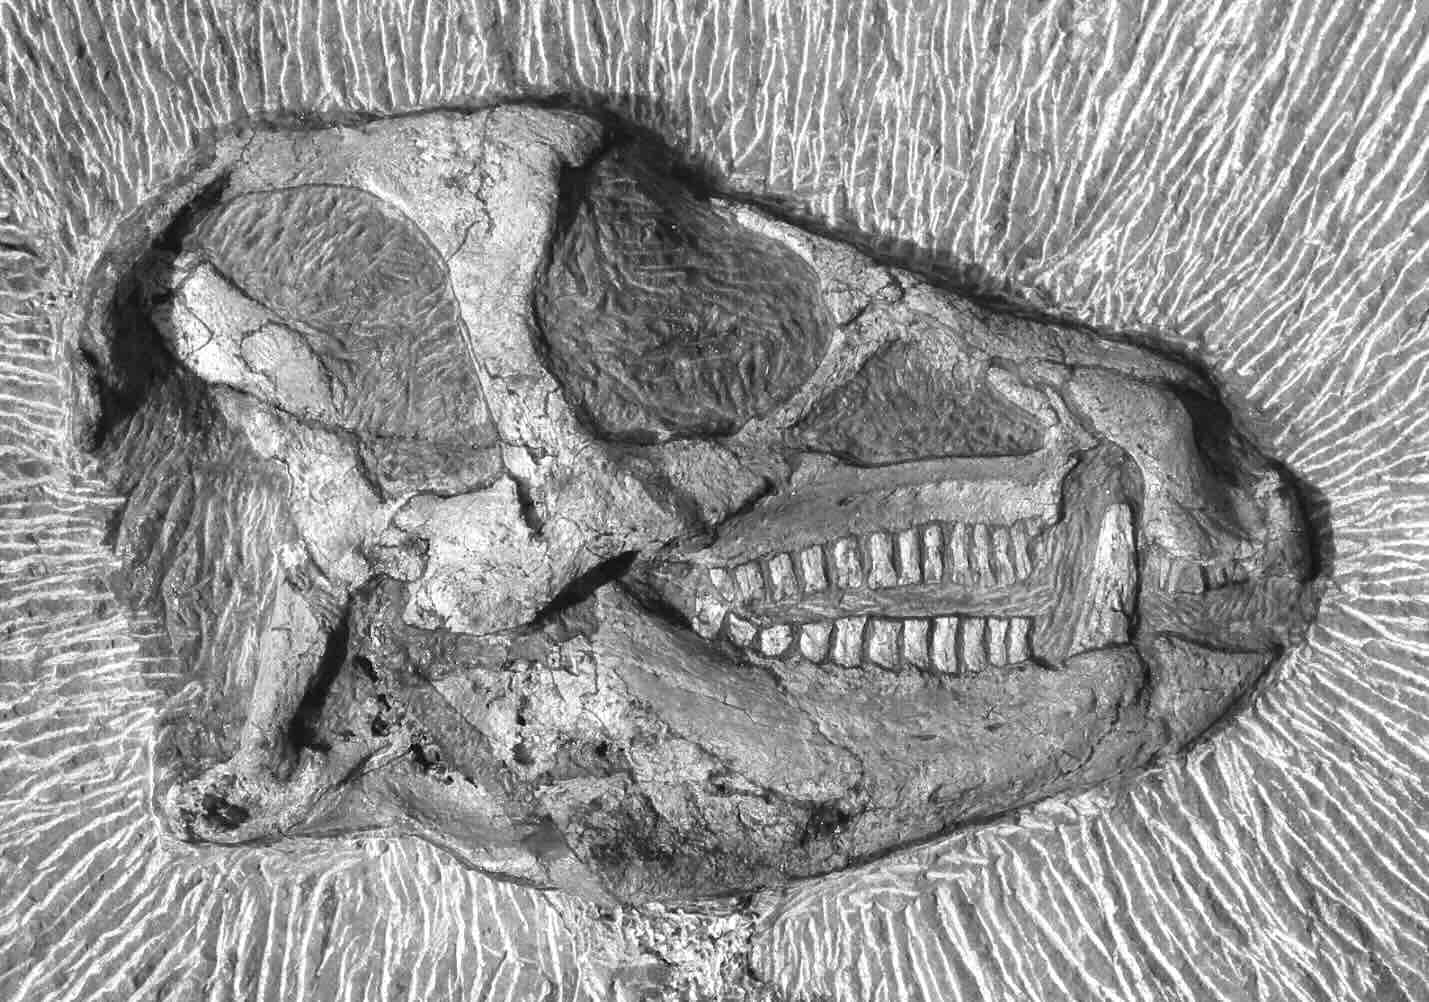
The image below shows a dinosaur fossil found in South Africa believed to be 200 million years old.
--- 2 WORK AREA LINES (style=lined) ---
--- 5 WORK AREA LINES (style=lined) ---
Examine the diagram provided, which depicts the biological relationships within an ecosystem.

--- 4 WORK AREA LINES (style=lined) ---
Consider a grassland ecosystem with a population of rabbits, foxes, and various grass species.
--- 1 WORK AREA LINES (style=lined) ---
--- 2 WORK AREA LINES (style=lined) ---
--- 2 WORK AREA LINES (style=lined) ---
Our actions as a human species are inadvertently altering the evolutionary trajectories of countless organisms.
Explain two distinct mechanisms by which human activities exert selection pressures on other species. For each mechanism, provide a specific example of a species affected by this pressure. (4 marks)
--- 8 WORK AREA LINES (style=lined) ---
Which of the following observations indicates a chemical change has occurred?
Ecosystems are dynamic, shaped not only by physical forces but also by the living organisms within them. Including a specific example, explain one biotic factor that has significantly impacted past ecosystems:
--- 3 WORK AREA LINES (style=lined) ---
--- 3 WORK AREA LINES (style=lined) ---
A student tested how soluble silver salts are by reacting a 0.1 mol L\(^{-1}\) silver nitrate solution with 0.1 mol L\(^{-1}\) solutions of calcium hydroxide, calcium chloride, and calcium sulfate. The results are shown below:
\begin{array} {|l|l|}
\hline \ \ \ \ \ \text{Compound} & \ \ \ \ \ \text{Observation} \\
\hline \text{calcium hydroxide} & \text{No reaction} \\
\hline \text{calcium chloride} & \text{White precipitate} \\
\hline \text{calcium sulfate} & \text{No reaction} \\
\hline \end{array}
--- 2 WORK AREA LINES (style=lined) ---
--- 1 WORK AREA LINES (style=lined) ---
The graph below shows the concentration of \(\ce{CO2}\) in the earth's atmosphere over the last 800 years.

--- 1 WORK AREA LINES (style=lined) ---
--- 6 WORK AREA LINES (style=lined) ---
Scientists analyse the ratio of \(\ce{^{16}O}\) to \(\ce{^{18}O}\) isotopes in various geological samples to reconstruct past climatic conditions.
--- 1 WORK AREA LINES (style=lined) ---
--- 6 WORK AREA LINES (style=lined) ---
Which of the following are the products of the complete combustion of propane, \(\ce{C3H8}\)?
Which of the following equations involving sulfur compounds represents a synthesis reaction?
--- 2 WORK AREA LINES (style=lined) ---
--- 4 WORK AREA LINES (style=lined) ---
--- 4 WORK AREA LINES (style=lined) ---
Which of the following is an example of a behavioural adaptation in Australian wildlife?
Which of the following best explains how an increase in temperature affects the rate of a chemical reaction?
Describe the concept of structural adaptation in living organisms. In your answer, one example of a structural adaptation in a plant species and one example in an animal species. (3 marks)
--- 7 WORK AREA LINES (style=lined) ---
Brian measured the reaction rate of 0.5 g of sodium metal in 2.0 mol/L nitric acid. The volume of hydrogen gas produced per minute was recorded both without a catalyst and with copper as a catalyst. \begin{array} {|c|c|c|} --- 3 WORK AREA LINES (style=blank) ---
\hline \text{Time (minutes)} & \text{Volume of hydrogen gas (mL)} & \text{Volume of hydrogen gas (mL)} \\ & \text{no catalyst} & \text{catalyst} \\
\hline \text{0} & 0 & 0 \\
\hline \text{1} & 16 & 7 \\
\hline \text{2} & 30 & 13\\
\hline \text{3} & 43 & 19 \\
\hline \text{4} & 44 & 26 \\
\hline \text{5} & 44 & 32 \\
\hline \text{6} & 44 & 38 \\
\hline \text{7} & 44 & 44 \\
\hline \end{array}
![]()
a. b. Experiment conclusion:Show Answers Only

a. b. Experiment conclusion:Show Worked Solution
Describe, providing an example, an abiotic factor that could act as a selection pressure in
--- 5 WORK AREA LINES (style=lined) ---
--- 5 WORK AREA LINES (style=lined) ---
In a coral reef ecosystem, which of the following scenarios represents a biotic selection pressure rather than an abiotic one?
Given \(f(x)=x(x+2)(2-x)\) On the graph, sketch the graphs of \(y=f(\abs{x})\) (2 marks) --- 5 WORK AREA LINES (style=lined) ---

Show Worked Solution

Select the correct characteristic of a catalyst from the options below:
A student conducted a series of investigations where 8.50 g of sodium carbonate was reacted with excess nitric acid \(\ce{(HNO3)}\) at a temperature of 25°C and 100 kPa. The volume of carbon dioxide gas produced was measured at regular intervals during each investigation. In experiment A, sodium carbonate was provided as large crystals, and in experiment B, it was supplied in powdered form.
Both reactions produced 1.988 L of \(\ce{CO2(g)}\) however experiment B finished reacting before experiment A finished reacting.
--- 2 WORK AREA LINES (style=blank) ---
--- 2 WORK AREA LINES (style=blank) ---
--- 2 WORK AREA LINES (style=blank) ---
--- 5 WORK AREA LINES (style=lined) --- --- 8 WORK AREA LINES (style=lined) --- \(\text{Domain:}\ \ 3 x-1 \ \geqslant 0 \ \Rightarrow \ x \geqslant \dfrac{1}{3}\) \(\text {Range:}\ \ y \geqslant 0\) ii. \(\text{Domain:}\ \ 3 x-1 \ \geqslant 0 \ \Rightarrow \ x \geqslant \dfrac{1}{3}\) \(\text {Range:}\ \ y \geqslant 0\) ii.
Show Answers Only
i.
\(f(x)\)
\(=3x-1\)
\(y\)
\(=\sqrt{3x-1}\)
 Show Worked Solution
i.
\(f(x)\)
\(=3x-1\)
\(y\)
\(=\sqrt{3x-1}\)
--- 5 WORK AREA LINES (style=lined) --- --- 6 WORK AREA LINES (style=blank) ---
Show Answers Only
a.
\(\text{Domain:}\ \ -1 \leqslant\)
\(2 x-3 \leqslant 1 \)
\( 2 \leqslant\)
\(2 x \leqslant 4\)
\( 1 \leqslant\)
\(x \leqslant 2\)
\(\text{Range:}\ \ -\dfrac{\pi}{2} \leqslant\)
\(y \leqslant \dfrac{\pi}{2}\)
\( -2 \pi \leqslant \)
\(4 y \leqslant 2 \pi\)
b.

Which of the following plant tissues is responsible for transporting water and minerals from the roots to the leaves?
--- 4 WORK AREA LINES (style=blank) ---
--- 6 WORK AREA LINES (style=blank) ---
--- 4 WORK AREA LINES (style=blank) ---
--- 6 WORK AREA LINES (style=blank) ---
Bond energies can be used to estimate the enthalpy change of a reaction. The equation for the combustion of methane \(\ce{CH4}\) is shown below:
\(\ce{CH4(g) + 2O2(g) -> CO2(g) + 2H2O(l)}\)
Given the following bond energies:
Calculate the total bond energy of the products. (2 marks)
--- 4 WORK AREA LINES (style=lined) ---
Explain how physical and chemical digestion work together in mammals to improve the efficiency of nutrient absorption. (3 marks)
--- 6 WORK AREA LINES (style=lined) ---
The combustion of methane \(\ce{(CH4)}\) is represented by the following equation:
\(\ce{CH4(g) + 2O2(g) -> CO2(g) + 2H2O(l)}\qquad \Delta H = -890\ \text{kJ mol}^{-1}\)
Calculate the energy change when 3 moles of methane are combusted. (2 marks)
--- 3 WORK AREA LINES (style=lined) ---
--- 1 WORK AREA LINES (style=lined) ---
--- 5 WORK AREA LINES (style=lined) ---
a.

b. Glucose:
Oxygen:
a.
b. Glucose:
Oxygen:
When \(2x^3-x^2+p x-6\) is divided by \(x+2\) the remainder is \(-4\). What is the value of \(p\) ?
Epidermal tissues in plants can be compared to the epithelium in animals.
--- 2 WORK AREA LINES (style=lined) ---
--- 2 WORK AREA LINES (style=lined) ---
--- 5 WORK AREA LINES (style=lined) ---
--- 2 WORK AREA LINES (style=lined) ---
--- 2 WORK AREA LINES (style=lined) ---
--- 4 WORK AREA LINES (style=lined) ---
In the human body, which of the following is an example of tissue?
Which of the following correctly orders the levels of organisation in a multicellular organism from smallest to largest?
Which of the following statements correctly compares unicellular and multicellular organisms?

