What is the `x`-intercept of the line `x + 3y + 6 = 0`?
- `(-6, 0)`
- `(6, 0)`
- `(0, -2)`
- `(0, 2)`
Aussie Maths & Science Teachers: Save your time with SmarterEd
What is the `x`-intercept of the line `x + 3y + 6 = 0`?
An experiment has three distinct outcomes, A, B and C.
Outcome A occurs 50% of the time. Outcome B occurs 23% of the time.
What is the expected number of times outcome C would occur if the experiment is conducted 500 times?
The driving distance from Alex's home to his work is 20 km. He drives to and from work five times each week. His car uses fuel at the rate of 8 L/100 km.
How much fuel does he use driving to and from work each week?
Which graph best represents the equation `y = x^2-2`?
| A. |  |
B. |  |
| C. |  |
D. |  |
A set of scores has the following five-number summary.
lower extreme = 2
lower quartile = 5
median = 6
upper quartile = 8
upper extreme = 9
What is the range?
In triangle `ABC, BC` is perpendicular to `AC`. Side `BC` has length `a`, side `AC` has length `b` and side `AB` has length `c`. A quadrant of a circle of radius `x`, centered at `C`, is constructed. The arc meets side `BC` at `E`. It touches the side `AB` at `D`, and meets side `AC` at `F`. The interval `CD` is perpendicular to `AB`.


A table is constructed to represent the network diagram below.

Complete the table. (2 marks)

--- 0 WORK AREA LINES (style=lined) ---

Prove by mathematical induction that, for `n >= 1,`
`2-6 + 18-54 + … + 2 (-3)^(n-1) = (1-(-3)^n)/2.` (3 marks)
--- 14 WORK AREA LINES (style=lined) ---
An object is projected from the origin with an initial velocity of `V` at an angle `theta` to the horizontal. The equations of motion of the object are
| `x(t)` | `= Vt cos theta` |
| `y(t)` | `= Vt sin theta - (g t^2)/2.` (Do NOT prove this.) |
`V^2/g sin 2 theta` (2 marks)
--- 6 WORK AREA LINES (style=lined) ---
`V^2/g sin 2 theta`. (1 mark)
--- 3 WORK AREA LINES (style=lined) ---
Let these angles be `alpha` and `beta`, where `beta = pi/2 - alpha.`
Let `h_alpha` be the maximum height reached by the object when projected at the angle `alpha` to the horizontal.
Let `h_beta` be the maximum height reached by the object when projected at the angle `beta` to the horizontal.

Show that the average of the two heights, `(h_alpha + h_beta)/2`, depends only on `V` and `g`. (3 marks)
--- 9 WORK AREA LINES (style=lined) ---
Let `f(x) = sin^(-1) x + cos^(-1) x`.
--- 2 WORK AREA LINES (style=lined) ---
--- 4 WORK AREA LINES (style=lined) ---
--- 8 WORK AREA LINES (style=lined) ---
i. `f^{′}(x) = 1/sqrt(1-x^2) + (-1/sqrt (1-x^2)) = 0`
ii. `text(S)text(ince)\ \ f^{′}(x) = 0\ \ => f(x)\ \ text(is a constant.)`♦ Mean mark (ii) 37%.
`text(Substituting)\ \ x=1\ \ text{into the equation (any value works)}`
| `sin^(-1) 1 + cos^(-1) 1` | `= pi/2 + 0` | |
| `= pi/2\ \ text(… as required)` |
iii. `text(Domain restrictions require:)\ \ -1<x<1`♦ Mean mark (iii) 40%.
|
|
A ferris wheel has a radius of 20 metres and is rotating at a rate of 1.5 radians per minute. The top of a carriage is `h` metres above the horizontal diameter of the ferris wheel. The angle of elevation of the top of the carriage from the centre of the ferris wheel is `theta`.

--- 2 WORK AREA LINES (style=lined) ---
--- 6 WORK AREA LINES (style=lined) ---
Find `int cos^2 (3x)\ dx`. (2 marks)
Evaluate `int_-3^0 x/sqrt(1 - x) dx`, using the substitution `u = 1 - x`. (3 marks)
--- 8 WORK AREA LINES (style=lined) ---
Consider the function `f(x) = 1/(4x - 1)`.
(i) `text(Domain is)\ {text(all real)\ x, x!=1/4}`
| (ii) | `1/(4x – 1)` | `< 1` |
| `(4x – 1)` | `< (4 x – 1)^2` | |
| `(4x – 1)^2 – (4x – 1)` | `> 0` | |
| `(4x – 1)[4x – 1- 1]` | `> 0` | |
| `2 (4x – 1) (2x – 1)` | `> 0` |
`text(Sketching the parabola:)`
`x > 1/2 or x < 1/4.`

`text(From the graph,)`
`y > 1\ \ text(when)\ \ x < 1/4 or x > 1/2`
Write `sqrt 3 sin x + cos x` in the form `R sin (x + alpha)` where `R > 0` and `0 <= alpha <= pi/2.` (2 marks)
--- 6 WORK AREA LINES (style=lined) ---
Solve `log_2 5 + log_2(x - 2) = 3.` (2 marks)
Consider the polynomial `P(x) = x^3-2x^2-5x + 6`.
--- 2 WORK AREA LINES (style=lined) ---
--- 5 WORK AREA LINES (style=lined) ---
The acute angle between the lines `y = 3x` and `y = 5x` is `theta.`
What is the value of `tan theta?`
A. `1/8`
B. `1/7`
C. `1/2`
D. `4/7`
The polynomial `2x^3 + 6x^2 - 7x - 10` has zeros `alpha, beta and gamma.`
What is the value of `alpha beta gamma (alpha + beta + gamma)?`
A. `−60`
B. `−15`
C. `15`
D. `60`
A project will be undertaken in the wildlife park. This project involves the 13 activities shown in the table below. The duration, in hours, and predecessor(s) of each activity are also included in the table.

Activity `G` is missing from the network diagram for this project, which is shown below.

--- 1 WORK AREA LINES (style=lined) ---
--- 2 WORK AREA LINES (style=lined) ---
--- 1 WORK AREA LINES (style=lined) ---
‘If the time to complete just one of the activities in this project is reduced by one hour, then the minimum time to complete the entire project will be reduced by one hour.’
Explain the circumstances under which this statement will be true for this project. (1 mark)
--- 2 WORK AREA LINES (style=lined) ---
--- 2 WORK AREA LINES (style=lined) ---
a.
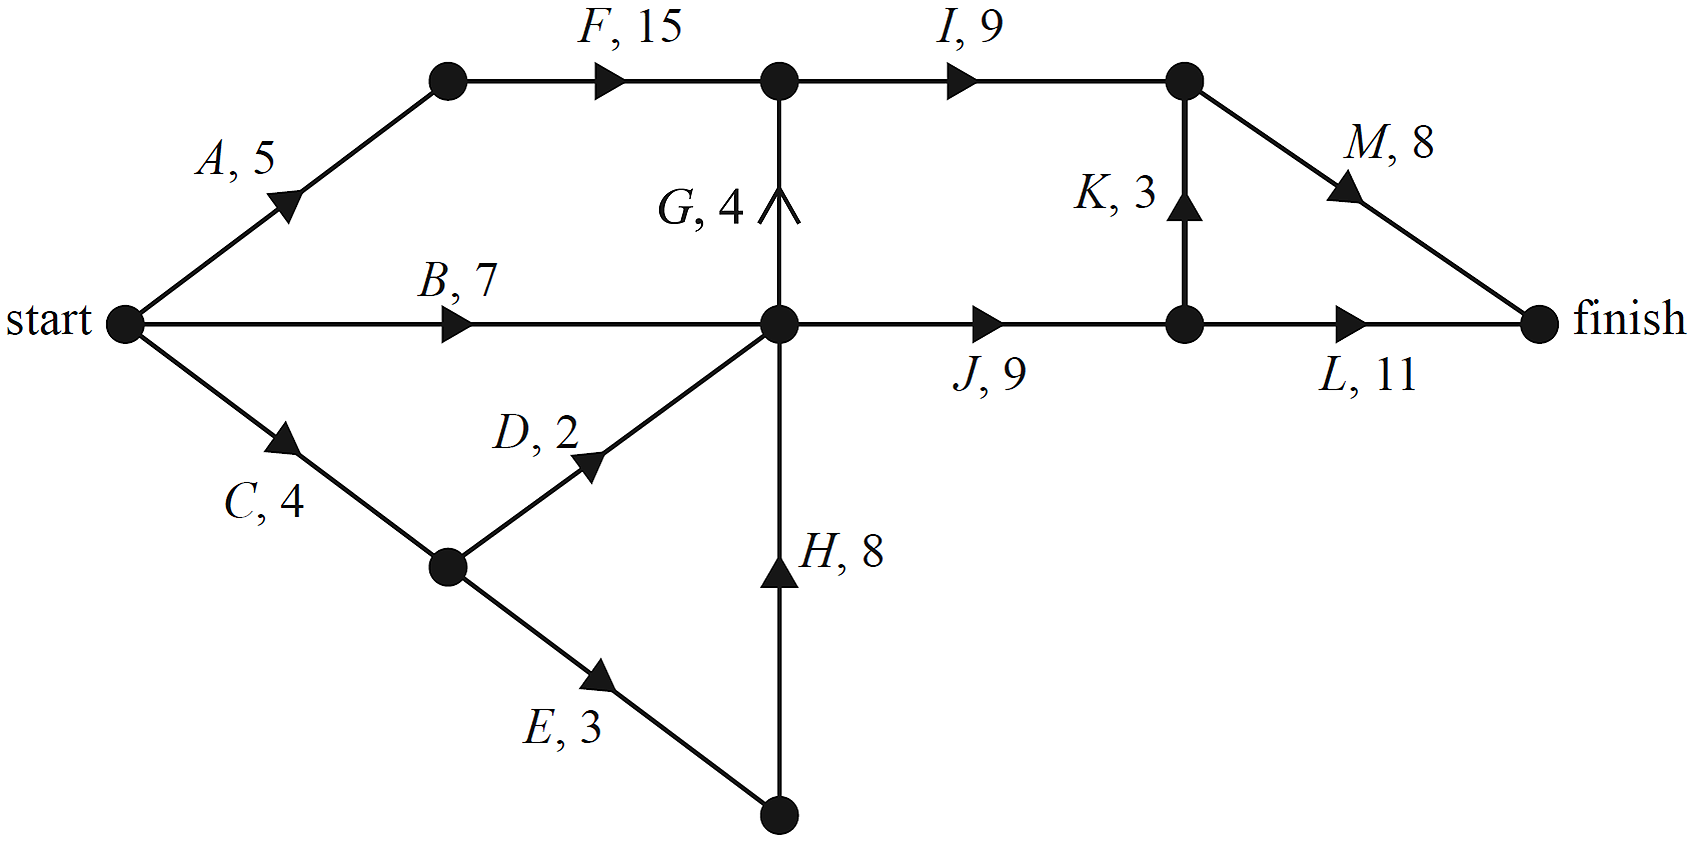
b. `7\ text(hours)`
c.i. `AFIM`
c.ii. `14\ text(hours)`
d. `text(The statement will only be true if the crashed activity)`
`text(is on the critical path)\ \ A F I M.`
e. `text(36 hours)`
| a. | |
b. `text(Scanning forwards and backwards:)`

`text(EST for Activity)\ H`
`= 4 + 3`
`= 7\ text(hours)`
c.i. `A F I M`
c.ii. `text(LST of)\ G = 20 – 4 = 16\ text(hours)`
`text(LST of)\ D = 16 – 2 = 14\ text(hours)`
d. `text(The statement will only be true if the time reduced activity)`
`text(is on the critical path)\ \ A F I M.`
e. `A F I M\ text(is 37 hours.)`
`text(If)\ F\ text(is reduced by 2 hours, the new critical)`
`text(path is)\ \ C E H G I M\ text{(36 hours)}`
`:.\ text(Minimum completion time = 36 hours)`
Thirteen activities must be completed before the produce grown on a farm can be harvested.
The directed network below shows these activities and their completion times in days.

--- 1 WORK AREA LINES (style=lined) ---
Explain why this activity is used on the network diagram. (1 mark)
--- 1 WORK AREA LINES (style=lined) ---
--- 1 WORK AREA LINES (style=lined) ---
--- 2 WORK AREA LINES (style=lined) ---
--- 1 WORK AREA LINES (style=lined) ---
| a. | `text(EST of)\ E` | `= 10 + 2` |
| `= 12\ text(days)` |
b. `F\ text(has)\ B\ text(as a predecessor while)\ G\ text(and)\ H`
`text(have)\ B\ text(and)\ C\ text(as predecessors.)`
`text(S)text(ince there cannot be 2 activities called)\ B, text(a zero)`
`text{duration activity is drawn as an extension of}\ B\ text(to)`
`text(show that it is also a predecessor of)\ G\ text(and)\ H.`
c. `text(Scanning forwards:)`

`text(EST for)\ H = 15\ text(days)`
d. `text(The critical path is)\ \ ABHILM`

e. `text(The shortest time to complete all the activities)`
`= 10 + 5 + 4 + 3 + 4 + 2`
`= 28\ text(days)`
| `:.\ text(LST of)\ J` | `= 28 − 3` |
| `= 25\ text(days)` |
For a particular project there are ten activities that must be completed.
These activities and their immediate predecessors are given in the following table.

A directed graph that could represent this project is
| A. |  |
| B. |  |
| C. |  |
| D. |  |
`text(Consider the information in the table:)`
`text(D and E are prerequisites to F → eliminate B)`
`text(G is a prerequisite to I → eliminate A and C)`
`=>\ text(Option D reflects the information in the table:)`
`rArr D`
An estate has large open parklands that contain seven large trees.
The trees are denoted as vertices A to G on the network diagram below.
Walking paths link the trees as shown.
The numbers on the edges represent the lengths of the paths in metres.

Jamie is standing at A and Michelle is standing at D.
Write down the shortest route that Jamie can take and the distance travelled to meet Michelle at D. (2 marks)
--- 3 WORK AREA LINES (style=lined) ---
`text(One strategy – using Dijkstra’s algorithm:)`

`text(Shortest path is)\ AFCD`
`text(Shortest distance)= 200 + 150 + 150= 500\ text(metres)`

In the directed graph above, the only vertex with a label that can be reached from vertex Y is
A. vertex A
B. vertex B
C. vertex C
D. vertex D
The following directed graph represents a series of one-way streets with intersections numbered as nodes 1 to 8.

All intersections can be reached from
A. intersection 4
B. intersection 5
C. intersection 6
D. intersection 8
A school is designing a computer network between five key areas within the school.
The cost of connecting the rooms is shown in the diagram below.

--- 0 WORK AREA LINES (style=lined) ---

--- 1 WORK AREA LINES (style=lined) ---
a.

b. `$1500`
a. `text(One Strategy: Using Prim’s Algorithm)`
`text(Starting vertex – Staff Room)`
`text(1st edge: Staff Room – Library)`
`text(2nd edge: Library – School Office)`
`text(3rd edge: Staff Room – IT Staff)`
`text(4th edge: Library – Computer Room)`
b. `text(Minimum Cost)= 300 + 300 + 400 + 500= $1500`
This diagram shows the possible paths (in km) for laying gas pipes between various locations.

Gas is to be supplied from one location. Any one of the locations can be the source of the supply.
What is the minimum total length of the pipes required to provide gas to all the locations?
`text(Using Kruskal’s Algorithm:)`

`text(1st edge: Parkview – Summerville)\ (5)`
`text(2nd edge: Summerville – Newville)\ (8)`
`text(3rd edge: Beachview – Summerville)\ (10)`
`text(4th edge: Old Town – Newville)\ (11)`
`:.\ text(Minimum length of pipes.)`
`= 5 + 8 + 10 + 11= 34`
`=> B`
Water will be pumped from a dam to eight locations on a farm.
The pump and the eight locations (including the house) are shown as vertices in the network diagram below.
The numbers on the edges joining the vertices give the shortest distances, in metres, between locations.

--- 1 WORK AREA LINES (style=lined) ---
The total length of all edges in the network is 1180 metres.
The total length of pipe that supplies water from the pump to the eight locations on the farm is a minimum.
This minimum length of pipe is laid along some of the edges in the network.
--- 1 WORK AREA LINES (style=lined) ---

a. `2\ text{(the house and the top right vertex)}`
b. `text(One Strategy – Using Prim’s algorithm:)`
`text(Starting at the house)`
`text(1st edge: 50)`
`text{2nd edge: 40 (either)}`
`text(3rd edge: 40)`
`text(4th edge: 60 etc…)`
c. `text(Minimum spanning tree)`
The factory supplies groceries to stores in five towns, `Q`, `R`, `S`, `T` and `U`, represented by vertices on the graph below.

The edges of the graph represent roads that connect the towns and the factory.
The numbers on the edges indicate the distance, in kilometres, along the roads.
Vehicles may only travel along the road between towns `S` and `Q` in the direction of the arrow due to temporary roadworks.
Each day, a van must deliver groceries from the factory to the five towns.
The first delivery must be to town `T`, after which the van will continue on to the other four towns before returning to the factory.
Describe the order in which these deliveries would follow to achieve the shortest possible circuit and the length, in kilometres, of the circuit. (2 marks)
Aden, Bredon, Carrie, Dunlop, Enwin and Farnham are six towns.
The network shows the road connections and distances between these towns in kilometres.

--- 1 WORK AREA LINES (style=lined) ---
--- 1 WORK AREA LINES (style=lined) ---
An engineer plans to inspect all of the roads in this network.
He will start at Dunlop and inspect each road only once.
--- 2 WORK AREA LINES (style=lined) ---
The diagram below shows a network of tracks (represented by edges) between checkpoints (represented by vertices) in a short-distance running course. The numbers on the edges indicate the time, in minutes, a team would take to run along each track.

A challenge requires teams to run from checkpoint `X` to checkpoint `Y` using these tracks.
What would be the shortest possible time for a team to run from checkpoint `X` to checkpoint `Y`? Mark the shortest route on the diagram below. (2 marks)

--- 4 WORK AREA LINES (style=lined) ---
`text(Using Djikstra’s Algorithm:)`

`text(Shortest distance)\ \ X\ \ text(to)\ \ Y`
`=4 + 3 + 4= 11\ text(minutes)`
One of the landmarks in a city is a hedge maze. The maze contains eight statues. The statues are labelled `F` to `M` on the following directed graph. Walkers within the maze are only allowed to move in the directions of the arrows.

--- 1 WORK AREA LINES (style=lined) ---
List the three other ways that statue `H` can be reached from statue `K`. (1 mark)
--- 1 WORK AREA LINES (style=lined) ---
Bus routes connect six towns.
The towns are Northend (`N`), Opera (`O`), Palmer (`P`), Quigley (`Q`), Rosebush (`R`) and Seatown (`S`).
The graph below gives the cost, in dollars, of bus travel along these routes.
Bai lives in Northend (`N`) and he will travel by bus to take a holiday in Seatown (`S`).

--- 1 WORK AREA LINES (style=lined) ---
--- 1 WORK AREA LINES (style=lined) ---
a. `text(C)text(ost)= 15 + 105= $120`
b. `text(Using Djikstra’s algorithm:)`

`text(Fastest route is:)\ \ NQRS.`
`:.\ text(Other towns are Quigley and Rosebush.)`
The vertices in the network diagram below show the entrance to a wildlife park and six picnic areas in the park: `P1`, `P2`, `P3`, `P4`, `P5` and `P6`.
The numbers on the edges represent the lengths, in metres, of the roads joining these locations.

--- 1 WORK AREA LINES (style=lined) ---
--- 1 WORK AREA LINES (style=lined) ---
a. `3`
b. `text(Using Djikstra’s algorithm:)`

`text( Shortest distance)`
`= E-P1-P3= 600 + 400= 1000\ text(m)`
Water will be pumped from a dam to eight locations on a farm.
The pump and the eight locations (including the house) are shown as vertices in the network diagram below.
The numbers on the edges joining the vertices give the shortest distances, in metres, between locations.
a.i. Determine the shortest distance between the house and the pump. (1 mark)
a.ii. How many vertices on the network diagram have an odd degree? (1 mark)
The total length of pipe that supplies water from the pump to the eight locations on the farm is a minimum.
This minimum length of pipe is laid along some of the edges in the network.
b.i. On the diagram below, draw the minimum length of pipe that is needed to supply water to all locations on the farm. (1 mark)
b.ii. What is the mathematical term that is used to describe this minimum length of pipe in part b.i.? (1 mark)
a.i. `160\ text(m)`
a.ii. `2`
b.i. `1250\ text(m)`
b.ii. `text(Minimal spanning tree)`
a.i. `text(Shortest distance)`
`=70 + 90`
`= 160\ text(m)`
a.ii. `2\ text{(the house and the top right vertex)}`
| b.i. | |
b.ii. `text(Minimal spanning tree)`
A factory requires seven computer servers to communicate with each other through a connected network of cables.
The servers, `J`, `K`, `L`, `M`, `N`, `O` and `P`, are shown as vertices on the graph below.
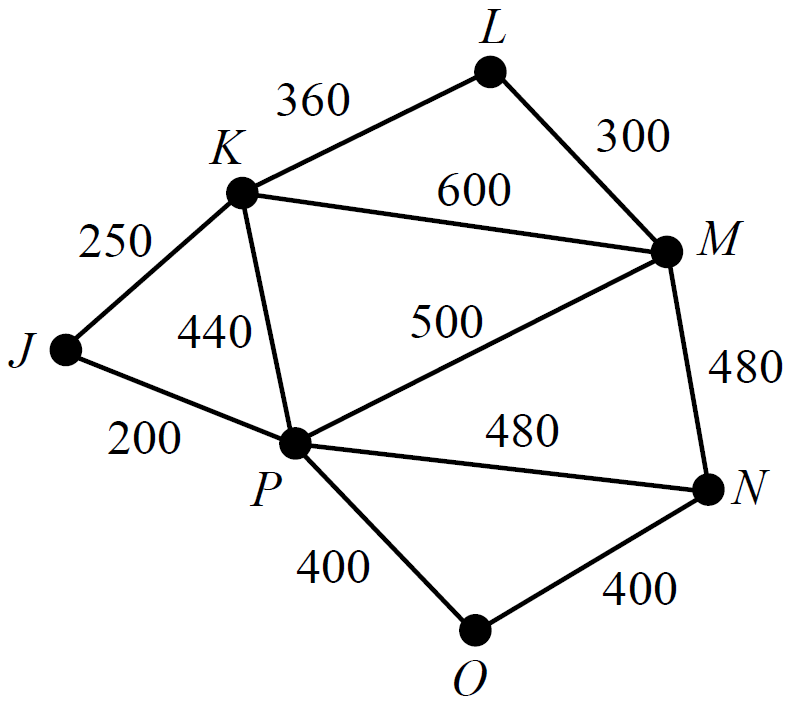
The edges on the graph represent the cables that could connect adjacent computer servers.
The numbers on the edges show the cost, in dollars, of installing each cable.
--- 1 WORK AREA LINES (style=lined) ---
--- 1 WORK AREA LINES (style=lined) ---
How much would be saved in installation costs if the factory removed computer server `P` from its minimum spanning tree network?
A copy of the graph above is provided below to assist with your working. (1 mark)

--- 0 WORK AREA LINES (style=lined) ---
a. `$300`
b. `$920`
c. `N\ text(and)\ P\ text{(or}\ P\ text(and)\ N)`
i.
ii. `$120`
a. `$300`
b. `text(Minimum cost of)\ K\ text(to)\ N`
`= 440 + 480= $920`
c.i. `text(Using Prim’s Algorithm:)`
`text(Starting at Vertex)\ L`
`text{1st Edge: L → M (300)}`
`text{2nd Edge: L → K (360)}`
`text{3rd Edge: K → J (250)}`
`text{4th Edge: J → P (200) etc…}`
c.ii. `text(Disconnect)\ J – P\ text(and)\ O – P`
`text(Savings) = 200 + 400 = $600`
`text(Add in)\ M – N`
`text(C)text(ost) = $480`
`:.\ text(Net savings)= 600-480= $120`
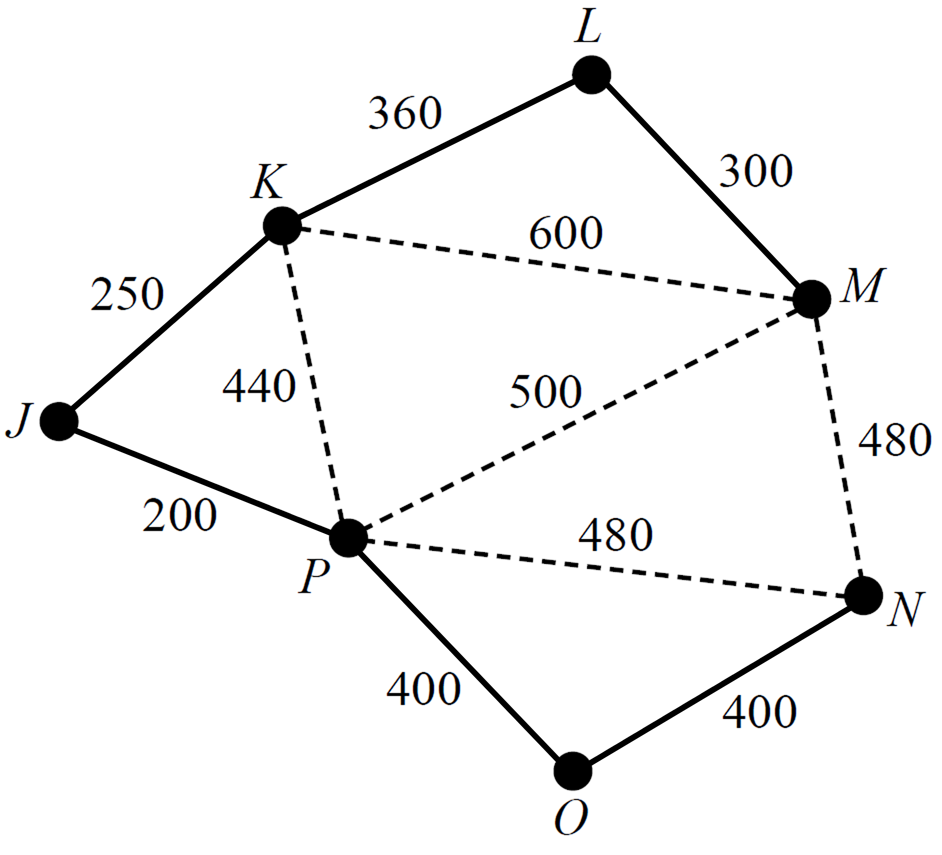
At the Farnham showgrounds, eleven locations require access to water. These locations are represented by vertices on the network diagram shown below. The dashed lines on the network diagram represent possible water pipe connections between adjacent locations. The numbers on the dashed lines show the minimum length of pipe required to connect these locations in metres.

All locations are to be connected using the smallest total length of water pipe possible.
--- 1 WORK AREA LINES (style=lined) ---
a. `text(Using Prim’s Algorithm)`
`text(Starting at bottom right vertex)`
`text{1st Edge: 50}`
`text{2nd Edge: 40`
`text(3rd Edge: 50)`
`text(4th Edge: 40 etc…)`

b. `text(Total length of water pipe)`
`= 50+40+50+40+50+60+40+60+60+60`
`= 510\ text(metres)`
James, Dante, Tahlia and Chanel are four children playing a game.
In this children’s game, seven posts are placed in the ground.
The network below shows distances, in metres, between the seven posts.
The aim of the game is to connect the posts with ribbon using the shortest length of ribbon.
This will be a minimal spanning tree.


--- 1 WORK AREA LINES (style=lined) ---
--- 1 WORK AREA LINES (style=lined) ---
a. `text(Using Kruskal’s Algorithm)`
`text{Edges 1-3: 2}`
`text{Edges 4-5: 3 (2 edges with weight 3 create a circuit and are ignored)`
`text(Edge 6: 4)`

`text(or)`

b. `text(Length of minimal spanning tree)`
`= 2+2+2+3+3+4= 16\ text(metres)`
c. `2`

The vertices of the graph above represent nine computers in a building. The computers are to be connected with optical fibre cables, which are represented by edges. The numbers on the edges show the costs, in hundreds of dollars, of linking these computers with optical fibre cables.
Based on the same set of vertices and edges, which one of the following graphs shows the cable layout (in bold) that would link all the computers with optical fibre cables for the minimum cost?


For the network above, the length of the minimal spanning tree is
`text(Using Kruskal’s algorithm:)`
`text{Edge 1: 2 (least weight)}`
`text(Edge 2: 3)`
`text(Edge 3: 4)`
`text(Edges 4-5: 5)`
`text{Edges 6-7: 8 (unused edges with weights <8 create circuits and are ignored)}`

`:.\ text(Minimal spanning tree)= 2+3+4+5+5+8+8= 35`
`=> C`
Two graphs, labelled Graph 1 and Graph 2, are shown below.

The sum of the degrees of the vertices of Graph 1 is
Which one of the following graphs contains a loop?
| A. | B. |
 |
 |
| C. | D. |
 |
 |
A store manager is directly in charge of five department managers.
Each department manager is directly in charge of six sales people in their department.
This staffing structure could be represented graphically by

The number of vertices with an odd degree in the network above is
Find a primitive of `4 + sec^2\ x`. (2 marks)
--- 2 WORK AREA LINES (style=lined) ---
Find `int sqrt(5x +1) \ dx .` (2 marks)
Find `int (2x + 1)^4\ dx`. (1 mark)
--- 4 WORK AREA LINES (style=lined) ---
Find `f^{′}(x)`, where `f(x) = (x^2 + 3)/(x-1).` (2 marks)
--- 5 WORK AREA LINES (style=lined) ---
Differentiate `x^4 + 5x^(−1)` with respect to `x`. (2 marks)
Differentiate `(x + 2)/(3x-4).` (2 marks)
Let `f(x) = (log_e(x))/(x^2)`.
--- 3 WORK AREA LINES (style=lined) ---
--- 2 WORK AREA LINES (style=lined) ---
Lifeguards are required to ensure the safety of swimmers at the beach.
Let `x` be the number of junior lifeguards required.
Let `y` be the number of senior lifeguards required.
The inequality below represents the constraint on the relationship between the number of senior lifeguards required and the number of junior lifeguards required.
Constraint 1 `y >= x/4`
There are three other constraints.
Constraint 2 `x ≥ 6`
Constraint 3 `y ≥ 4`
Constraint 4 `x + y ≥ 12`
The shaded region of the graph below contains the points that satisfy Constraints 1 to 4.

All lifeguards receive a meal allowance per day.
Junior lifeguards receive $15 per day and senior lifeguards receive $25 per day.
The total meal allowance cost per day, `$C`, for the lifeguards is given by
`C = 15x + 25y`
• Constraint 2 `(x ≥ 6)` and Constraint 3 `(y ≥ 4)` are removed
• Constraint 1 and Constraint 4 are to remain.
Constraint 1 `y >= x/4`
Constraint 4 `x + y >= 12`
The total meal allowance cost per day, `$C`, for the lifeguards remains as
`C = 15x + 25y`
How many junior lifeguards and senior lifeguards work on a rainy day if the total meal allowance cost is to be a minimum?
Write your answers in the boxes provided below. (1 mark)

a. `2`
b. `text(The total combined number of junior and)`
`text(senior lifeguards must be at least 12.)`
c. `$220`
| d. |  |
a. `text(Minimum senior lifeguards) = 8/4 = 2`
b. `text(The total combined number of junior and)`
`text(senior lifeguards must be at least 12.)`
c. `text(Minimum cost occurs at (8, 4))`
| `:. C_text(min)` | `= 15 xx 8 + 25 xx 4` |
| `= $220` |
d. `text(Consider the graph without the restrictions)`♦♦ Mean mark 24%.
MARKER’S COMMENT: A common incorrect answer was 10 and 3.
`x >= 6quadtext(and)quady >= 4:`
`text(By inspection, intersection around (9.5, 2.4))`
`text(⇒ Minimum allowance when)`
The graph below shows the depth of water in a sea bath from 6.00 am to 8.00 pm.

--- 1 WORK AREA LINES (style=lined) ---
--- 1 WORK AREA LINES (style=lined) ---
Miki is planning a gap year in Japan.
She will store some of her belongings in a small storage box while she is away.
This small storage box is in the shape of a rectangular prism.
The diagram below shows that the dimensions of the small storage box are 40 cm × 19 cm × 32 cm.

The lid of the small storage box is labelled on the diagram above.
The large storage box and the small storage box are similar in shape.
The volume of the large storage box is eight times the volume of the small storage box.
The length of the small storage box is 40 cm.
What is the length of the large storage box, in centimetres? (1 mark)
Bus routes connect six towns.
The towns are Northend (`N`), Opera (`O`), Palmer (`P`), Quigley (`Q`), Rosebush (`R`) and Seatown (`S`).
The graph below gives the cost, in dollars, of bus travel along these routes.
Bai lives in Northend (`N`) and he will travel by bus to take a holiday in Seatown (`S`).
How much would Bai have to pay? (1 mark)
--- 2 WORK AREA LINES (style=lined) ---
--- 2 WORK AREA LINES (style=lined) ---
Complete the formula by writing the appropriate numbers in the boxes provided below. (1 mark)
--- 0 WORK AREA LINES (style=lined) ---

a. `$120`
b. `text(Quigley and Rosebush.)`
c.

| a. | `text(C)text(ost)` | `= 15 + 105` |
| `= $120` |
b. `text(Cheapest route is)\ N – Q – R – S`
`:.\ text(Other towns are Quigley and Rosebush.)`
| c. | |
A school canteen sells pies (`P`), rolls (`R`) and sandwiches (`S`).
The number of each item sold over three school weeks is shown in matrix `M`.
`{:(qquadqquadqquadquadPqquadRqquadS),(M = [(35,24,60),(28,32,43),(32,30,56)]{:(text(week 1)),(text(week 2)),(text(week 3)):}):}`
--- 1 WORK AREA LINES (style=lined) ---
--- 1 WORK AREA LINES (style=lined) ---
--- 3 WORK AREA LINES (style=lined) ---
The matrix equation below shows that the total value of all rolls and sandwiches sold in these three weeks is $915.60
`L xx [(491.55),(428.00),(487.60)] = [915.60]`
Matrix `L` in this equation is of order `1 × 3`.
--- 1 WORK AREA LINES (style=lined) ---
Alex is a mobile mechanic. He uses a van to travel to his customers to repair their cars. The value of Alex’s van is depreciated using the flat rate method of depreciation. The value of the van, in dollars, after `n` years, `V_n`, can be modelled by the recurrence relation shown below. `V_0 = 75\ 000 qquad V_(n + 1) = V_n - 3375` Complete the calculations below by writing the appropriate numbers in the boxes provided. (2 marks) --- 0 WORK AREA LINES (style=lined) --- --- 1 WORK AREA LINES (style=lined) --- --- 2 WORK AREA LINES (style=lined) --- `R_0 = 75\ 000 qquad R_(n + 1) = 0.943R_n` At what annual percentage rate is the value of the van depreciated each year? (1 mark) --- 2 WORK AREA LINES (style=lined) ---

Calculate the annual flat rate of depreciation in the value of the van.
Write your answer as a percentage. (1 mark)
b.i. `$3375` b.ii. `4.5text(%)` c. `5.7text(%)`Show Answers Only
a.

Show Worked Solution
a.
b.i. `$3375`
b.ii.
`text(Annual Rate)`
`= 3375/(75\ 000) xx 100`
`= 4.5text(%)`
c.
`text(Annual Rate)`
`= (1-0.943) xx 100text(%)`
`= 5.7text(%)`
Sammy visits a giant Ferris wheel. Sammy enters a capsule on the Ferris wheel from a platform above the ground. The Ferris wheel is rotating anticlockwise. The capsule is attached to the Ferris wheel at point `P`. The height of `P` above the ground, `h`, is modelled by `h(t) = 65-55cos((pit)/15)`, where `t` is the time in minutes after Sammy enters the capsule and `h` is measured in metres.
Sammy exits the capsule after one complete rotation of the Ferris wheel.

--- 2 WORK AREA LINES (style=lined) ---
--- 2 WORK AREA LINES (style=lined) ---
--- 4 WORK AREA LINES (style=lined) ---
As the Ferris wheel rotates, a stationary boat at `B`, on a nearby river, first becomes visible at point `P_1`. `B` is 500 m horizontally from the vertical axis through the centre `C` of the Ferris wheel and angle `CBO = theta`, as shown below.

--- 3 WORK AREA LINES (style=lined) ---
Part of the path of `P` is given by `y = sqrt(3025-x^2) + 65, x ∈ [-55,55]`, where `x` and `y` are in metres.
--- 2 WORK AREA LINES (style=lined) ---
As the Ferris wheel continues to rotate, the boat at `B` is no longer visible from the point `P_2(u, v)` onwards. The line through `B` and `P_2` is tangent to the path of `P`, where angle `OBP_2 = alpha`.

--- 10 WORK AREA LINES (style=lined) ---
--- 4 WORK AREA LINES (style=lined) ---
--- 5 WORK AREA LINES (style=lined) ---
| a. | `h_text(min)` | `= 65-55` | `h_text(max)` | `= 65 + 55` |
| `= 10\ text(m)` | `= 120\ text(m)` |
b. `text(Period) = (2pi)/(pi/15) = 30\ text(min)`
c. `h^{prime}(t) = (11pi)/3\ sin(pi/15 t)`♦ Mean mark 50%.
MARKER’S COMMENT: A number of commons errors here – 2 answers given, calc not in radian mode, etc …
`text(Solve)\ h^{primeprime}(t) = 0, t ∈ (0,30)`
| `t = 15/2\ \ text{(max)}` | `text(or)` | `t = 45/2\ \ text{(min – descending)}` |
`:. t = 7.5`
| d. |  |
♦ Mean mark 36%.
MARKER’S COMMENT: Choosing degrees vs radians in the correct context was critical here.
| `tan(theta)` | `= 65/500` |
| `:. theta` | `=7.406…` |
| `= 7.41^@` |
| e. | `(dy)/(dx)` | `= (-x)/(sqrt(3025-x^2))` |
| f. |  |
`P_2(u,sqrt(3025-u^2) + 65),\ \ B(500,0)`
| `:. m_(P_2B)` | `= (sqrt(3025-u^2) + 65)/(u-500)` |
`text{Using part (e), when}\ \ x=u,`♦♦♦ Mean mark part (f) 18%.
MARKER’S COMMENT: Many students were unable to use the rise over run information to calculate the second gradient.
`dy/dx=(-u)/(sqrt(3025-u^2))`
`text{Solve (by CAS):}`
| `(sqrt(3025-u^2) + 65)/(u-500)` | `= (-u)/(sqrt(3025-u^2))\ \ text(for)\ u` |
`u=12.9975…=13.00\ \ text{(2 d.p.)}`
| `:. v` | `= sqrt(3025-(12.9975…)^2) + 65` |
| `= 118.4421…` | |
| `= 118.44\ \ text{(2 d.p.)}` |
`:.P_2(13.00, 118.44)`
♦♦♦ Mean mark part (g) 7%.
| g. | `tan alpha` | `=v/(500-u)` |
| `= (118.442…)/(500-12.9975…)` | ||
| `:. alpha` | `= 13.67^@\ \ text{(2 d.p.)}` |
| h. |  |
♦♦♦ Mean mark 5%.
`text(Find the rotation between)\ P_1 and P_2:`
`text(Rotation to)\ P_1 = 90-7.41=82.59^@`
`text(Rotation to)\ P_2 = 180-13.67=166.33^@`
`text(Rotation)\ \ P_1 → P_2 = 166.33-82.59 = 83.74^@`
| `:.\ text(Time visible)` | `= 83.74/360 xx 30\ text(min)` |
| `=6.978…` | |
| `= 7\ text{min (nearest degree)}` |


