Which of the following is a specialised test used to determine the compressive strength of cured concrete?
- Slump test
- Janka hardness test
- Shore hardness test
- Rebound hammer test
Aussie Maths & Science Teachers: Save your time with SmarterEd
Which of the following is a specialised test used to determine the compressive strength of cured concrete?
Which of the following would be the most suitable material to use for a spring in a telecommunication component?
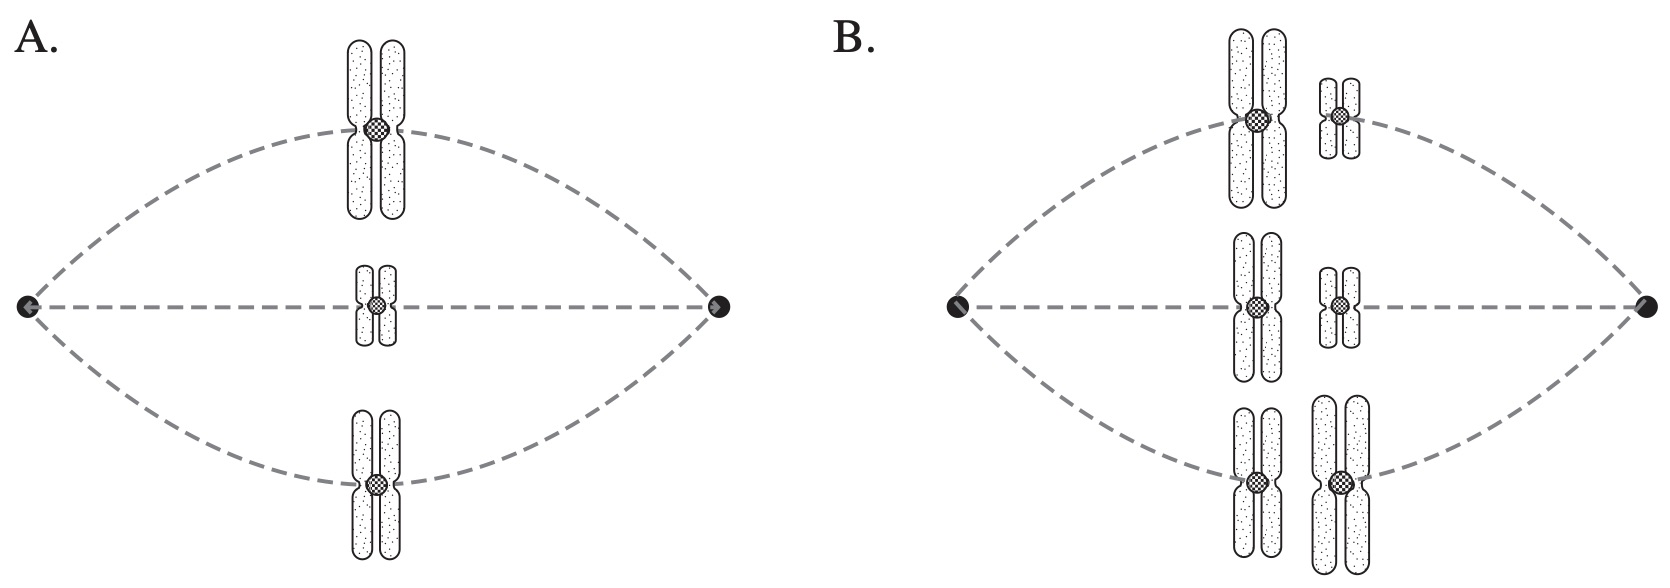
Which diagram correctly models one phase of meiosis in an organism that has six chromosomes in its somatic cells?
SNP databases have been used in forensic investigations. One is outlined below.

Which person is most likely to be the suspect who should be investigated?
Analysis of DNA shows that adenine and guanine always make up 50% of the total amount of nitrogenous bases in DNA.
Which structural feature of DNA does this provide evidence for?
A normal allele results in liver cells with sufficient cholesterol receptors. A different allele results in liver cells without cholesterol receptors. Individuals who are heterozygous have liver cells with insufficient cholesterol receptors.
What type of inheritance is the most likely explanation for this?
Genetically engineered Atlantic salmon have been produced and approved for aquaculture in the US. These salmon have a transgene that includes a protein-coding sequence from a Chinook salmon's growth hormone gene and the promoter region of an Ocean Pout's antifreeze protein gene. The following diagram provides an overview of the production of the transgenic salmon.

Transgenic fish can reproduce and pass on the dominant transgene (T).
Reproduction for aquaculture is strictly controlled using a variety of techniques in order to protect and preserve biodiversity.
Some of these techniques are outlined below.
1. Homozygous (TT) female (XX) breeding stock are kept in quarantine.
2. The female fish undergo hormone treatment that results in sex reversal and the development of male sex organs and sperm.
3. The sperm produced is collected and used to fertilise eggs obtained from wild-type, non-transgenic salmon.
4. The eggs are treated with pressure shock to prevent the completion of meiosis II. As a result, offspring are triploid (three copies of each chromosome).
All offspring are transgenic female fish and have XXX (XXX fish cannot develop sex organs).
5. Offspring are transported to inland aquaculture tanks to be grown to market size.
Analyse how these techniques protect and preserve biodiversity. (9 marks)
--- 21 WORK AREA LINES (style=lined) ---
As a projectile of mass `m` kilograms travels through air, it experiences a frictional force. The magnitude of this force is proportional to the square of the speed `v` of the projectile. The constant of proportionality is the positive number `k`. The position of the particle at time `t` is denoted by `([x],[y])`. The acceleration due to gravity is `g \ text{m s}^(-2)`.
Based on Newton's laws of motion, which equation models the motion of this projectile?
Millions of people around the world take drugs known as statins, which have been shown to reduce the incidence of heart attacks and strokes in vulnerable patients. However, up to 20% of people stop taking statins due to side-effects such as muscle aches, fatigue, feeling sick and joint pain.
A recent study at a public hospital focused on 60 patients who had all stopped taking statins in the past due to severe side-effects. Patients took statin tablets for four months, placebo tablets for four months and no tablets for four months.
Every day for the year the patients scored, from zero to 100, how bad their symptoms were. The results are shown.

Evaluate this study and its results. (6 marks)
--- 12 WORK AREA LINES (style=lined) ---
A radon-198 atom, initially at rest, undergoes alpha decay. The masses of the atoms involved are shown in atomic mass units `(u)`.
![]()
The kinetic energy of the polonium atom produced is `2.55 × 10^(-14)` J.
By considering mass defect, calculate the kinetic energy of the alpha particle, and explain why it is significantly greater than that of the polonium atom. (7 marks)
--- 14 WORK AREA LINES (style=lined) ---
Use the following information to answer this question.

Describe both the production and radiation of energy by the sun. In your answer, include a quantitative analysis of both the power output and the surface temperature of the sun. (9 marks)
--- 22 WORK AREA LINES (style=lined) ---
A strong magnet of mass 0.04 kg falls 0.78 m under the action of gravity from position `X` above a hollow copper cylinder. It then travels a distance of 0.20 m through the cylinder from `Y` to `Z` before falling freely again.

The magnet takes 0.5 seconds to pass through the cylinder. The displacement-time graph of the magnet is shown.

Analyse the motion of the magnet by applying the law of conservation of energy.
Your analysis should refer to gravity and the copper cylinder, and include both qualitative and quantitative information. (9 marks)
--- 20 WORK AREA LINES (style=lined) ---
Three charged particles, `X, Y` and `Z`, travelling along straight, parallel trajectories at the same speed, enter a region in which there is a uniform magnetic field which causes them to follow the paths shown. Assume that the particles do not exert any significant force on each other.

Explain the different paths that the particles follow through the magnetic field. (7 marks)
--- 16 WORK AREA LINES (style=lined) ---
Following the Geiger-Marsden experiment, Rutherford proposed a model of the atom.

Bohr modified this model to explain the spectrum of hydrogen observed in experiments.

The Bohr-Rutherford model of the atom consists of electrons in energy levels around a positive nucleus.
How do features of this model account for all the experimental evidence above? Support your answer with a sample calculation and a diagram, and refer to energy, forces and photons. (9 marks)
--- 18 WORK AREA LINES (style=lined) ---
The Geiger-Marsden experiment, which involved firing alpha particles at a thin sheet of gold foil produced results which can be explained by the Bohr-Rutherford model:
Rutherford’s model alone could not explain the emission spectra of elements such as hydrogen. Bohr’s contribution to the Bohr-Rutherford model amended this:

Using Rydberg’s equation it is possible to predict the emission lines of hydrogen, using an electron moving from the sixth to the second Bohr energy orbit as an example:
| `(1)/(lambda)` | `=R((1)/(n_(f)^(2))-(1)/(n_(i)^(2)))` | |
| `=(1.097 xx10^7)((1)/(2^(2))-(1)/(6^(2)))` | ||
| `=(2 xx1.097 xx10^7)/(9)` | ||
| `=2.438 xx10^6` | ||
| `lambda` | `=410 text{nm}` | |
The Geiger-Marsden experiment, which involved firing alpha particles at a thin sheet of gold foil produced results which can be explained by the Bohr-Rutherford model:
Rutherford’s model alone could not explain the emission spectra of elements such as hydrogen. Bohr’s contribution to the Bohr-Rutherford model amended this:
Using Rydberg’s equation it is possible to predict the emission lines of hydrogen, using an electron moving from the sixth to the second Bohr energy orbit as an example:
| `(1)/(lambda)` | `=R((1)/(n_(f)^(2))-(1)/(n_(i)^(2)))` | |
| `=(1.097 xx10^7)((1)/(2^(2))-(1)/(6^(2)))` | ||
| `=(2 xx1.097 xx10^7)/(9)` | ||
| `=2.438 xx10^6` | ||
| `lambda` | `=410 text{nm}` | |
The graph shows the maximum kinetic energy `E` with which photoelectrons are emitted as a function of frequency `f` for two different metals `X` and `Y`.

The metals are illuminated with light of wavelength 450 nm.
What would be the effect of doubling the intensity of this light without changing the wavelength?
An AC generator is operated by turning a handle, which rotates a coil in a magnetic field.
The handle is turned at a constant speed and the AC voltage output of the generator causes a light globe connected to it to light up, as shown in Circuit 1.

A second identical light globe is then connected in series to the generator output, as shown in Circuit 2 . The handle is turned at the same constant speed.

Which statement describes and explains the effort required to turn the handle in Circuit 2, compared to Circuit 1 ?
A charged oil droplet was observed between metal plates, as shown.

While the switch was open, the oil droplet moved downwards at a constant speed. After the switch was closed, the oil droplet moved upwards at the same constant speed.
Assume that the only three forces that may act on the oil droplet are the force of gravity, the force due to the electric field and the frictional force between the air and the oil droplet. The magnitudes of these forces are `F_G` (due to gravity), `F_E` (due to the electric field) and `F_F` (due to the frictional force).
Which row of the table shows all the forces affecting the motion of the oil droplet in the direction indicated, and the relationship between these forces?
\begin{align*}
\begin{array}{l}
\rule{0pt}{2.5ex} \ \rule[-1ex]{0pt}{0pt}& \\
\rule{0pt}{2.5ex}\textbf{A.}\rule[-1ex]{0pt}{0pt}\\
\rule{0pt}{2.5ex}\textbf{B.}\rule[-1ex]{0pt}{0pt}\\
\rule{0pt}{2.5ex}\textbf{C.}\rule[-1ex]{0pt}{0pt}\\
\rule{0pt}{2.5ex}\textbf{D.}\rule[-1ex]{0pt}{0pt}\\
\end{array}
\begin{array}{|c|c|}
\hline
\rule{0pt}{2.5ex}\text{Downwards motion}\rule[-1ex]{0pt}{0pt}& \text{Upwards motion} \\
\hline
\rule{0pt}{2.5ex}F_{\text{G}}>F_{\text{F}}\rule[-1ex]{0pt}{0pt}&F_{\text{E}}>F_{\text{F}}\\
\hline
\rule{0pt}{2.5ex}F_{\text{G}}>F_{\text{F}}\rule[-1ex]{0pt}{0pt}& F_{\text{E}}>F_{\text{G}}+F_{\text{F}}\\
\hline
\rule{0pt}{2.5ex}F_{\text{G}}=F_{\text{F}}\rule[-1ex]{0pt}{0pt}& F_{\text{G}}=F_{\text{E}} \\
\hline
\rule{0pt}{2.5ex}F_{\text{G}}=F_{\text{F}}\rule[-1ex]{0pt}{0pt}& F_{\text{E}}=F_{\text{G}}+F_{\text{F}} \\
\hline
\end{array}
\end{align*}
Describe how specific experiments have contributed to our understanding of the electron and ONE other fundamental particle. (5 marks)
--- 14 WORK AREA LINES (style=lined) ---
An airline company that has empty seats on a flight is not maximising its profit.
An airline company has found that there is a probability of 5% that a passenger books a flight but misses it. The management of the airline company decides to allow for overbooking, which means selling more tickets than the number of seats available on each flight.
To protect their reputation, management makes the decision that no more than 1% of their flights should have more passengers showing up for the flight than available seats.
Given management's decision and using the attached normal distribution probability table to find a suitable approximation, find the maximum number of tickets that can be sold for a flight which has 350 seats. (4 marks)
--- 10 WORK AREA LINES (style=lined) ---
The vectors `\vec{u}` and `\vec{v}` are not parallel. The vector `\vec{p}` is the projection of `\vec{u}` onto the vector `\vec{v}`.
The vector `\vec{p}` is parallel to `\vec{v}` so it can be written `\lambda_0 \vec{v}` for some real number `\lambda_0`. (Do NOT prove this.)
Prove that `|\vec{u}-\lambda \vec{v}|` is smallest when `\lambda=\lambda_0` by showing that, for all real numbers `\lambda,\|\vec{u}-\lambda_0 \vec{v}\| \leq|\vec{u}-\lambda \vec{v}|`. (3 marks)
--- 8 WORK AREA LINES (style=lined) ---
Which of the following could be the graph of a solution to the differential equation
`(dy)/(dx)=sin y+1?`


A given function `f(x)` has an inverse `f^{-1}(x)`.
The derivatives of `f(x)` and `f^{-1}(x)` exist for all real numbers `x`.
The graphs `y=f(x)` and `y=f^{-1}(x)` have at least one point of intersection.
Which statement is true for all points of intersection of these graphs?
In a reducing-balance loan, an amount `$P` is borrowed for a period of `n` months at an interest rate of 0.25% per month, compounded monthly. At the end of each month, a repayment of `$M` is made. After the `n`th repayment has been made, the amount owing, `$A_n`, is given by
`A_(n)=P(1.0025)^(n)-M(1+(1.0025)^(1)+(1.0025)^(2)+cdots+(1.0025)^(n-1))`
(Do NOT prove this.)
The loan is to be repaid in 180 monthly repayments.
Show that `M` = 1381.16, when rounded to the nearest cent. (2 marks)
--- 5 WORK AREA LINES (style=lined) ---
After 100 repayments of $1381.16 have been made, the interest rate changes to 0.35% per month.
At this stage, the amount owing to the nearest dollar is $100 032. (Do NOT prove this.)
Jane continues to make the same monthly repayments.
For how many more months will Jane need to make full monthly payments of $1381.16? (3 marks)
--- 6 WORK AREA LINES (style=lined) ---
--- 4 WORK AREA LINES (style=lined) ---
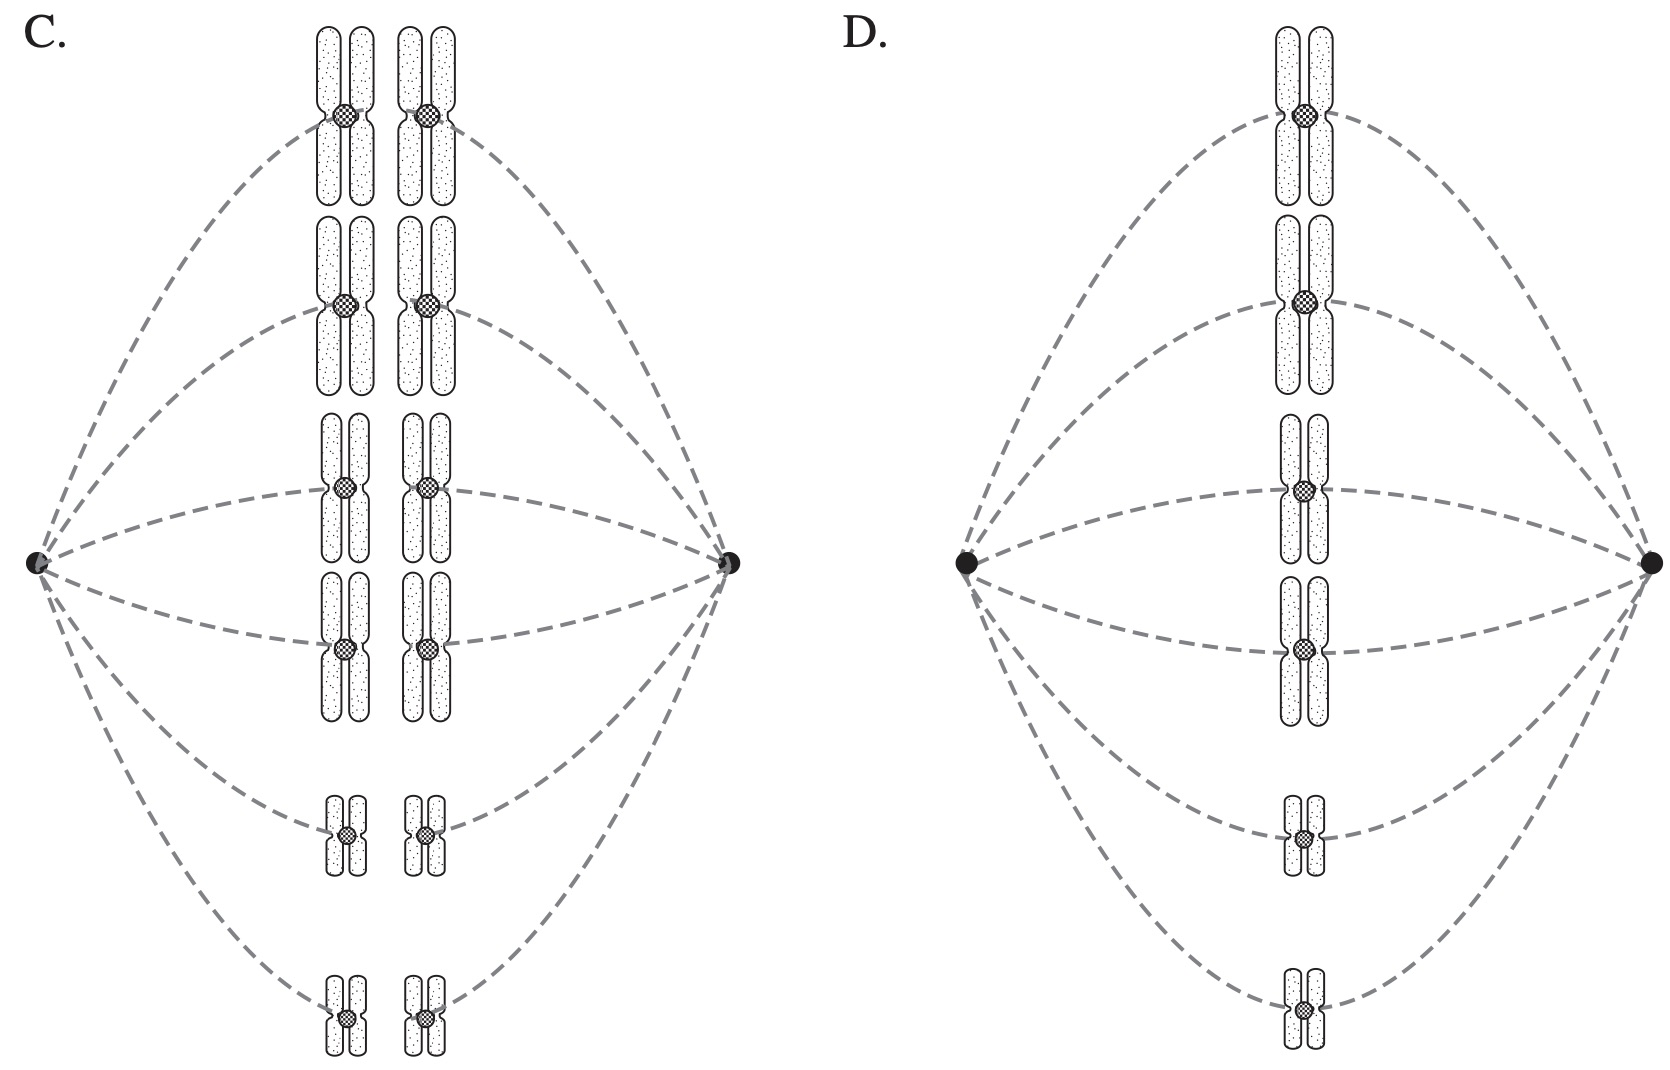
A line passes through the point `P(1,2)` and meets the axes at `X(x, 0)` and `Y(0, y)`, where `x>1`.

--- 5 WORK AREA LINES (style=lined) ---
--- 9 WORK AREA LINES (style=lined) ---
a. `text{Show}\ \ y=(2x)/(x-1)`
`text{S}text{ince}\ \ m_(YP)=m_(PX):`
| `(y-2)/(0-1)` | `=(2-0)/(1-x)` | |
| `y-2` | `=(-2)/(1-x)` | |
| `y` | `=2-2/(1-x)` | |
| `=(2(1-x)-2)/(1-x)` | ||
| `=(-2x)/(1-x)` | ||
| `=(2x)/(x-1)\ \ text{… as required}` |
| b. | `A` | `=1/2 xx b xxh` |
| `=1/2x((2x)/(x-1))` | ||
| `=(x^2)/(x-1)` |
| `(dA)/dx` | `=((x-1)*2x-x^2(1))/((x-1)^2)` | |
| `=(2x^2-2x-x^2)/((x-1)^2)` | ||
| `=(x(x-2))/((x-1)^2)` |
`text{SP’s occur when}\ \ (dA)/dx=0:`
`x=0\ \ text{or}\ \ 2`
`text{Use 1st derivative test to find max/min:}`
`=>\ text{MIN at}\ \ x=2`
| `:.A_min` | `=1/2 xx 2 xx (2xx2)/(2-1)` | |
| `=4\ text{u}^2` |
A continuous random variable \(X\) has cumulative distribution function given by
\(F(x)= \begin{cases}
1 & x>e^3 \\
\ \\
\dfrac{1}{k}\, \ln x & 1 \leq x \leq e^3 . \\
\ \\
0 & x<1\end{cases}\)
--- 2 WORK AREA LINES (style=lined) ---
--- 4 WORK AREA LINES (style=lined) ---

--- 2 WORK AREA LINES (style=lined) ---
--- 5 WORK AREA LINES (style=lined) ---
--- 4 WORK AREA LINES (style=lined) ---
Liam is playing two games. He is equally likely to win each game. The probability that Liam will win at least one of the games is 80%.
Which of the following is closest to the probability that Liam will win both games?
Frankie borrows $200 000 from a bank. The loan is to be repaid over 23 years at a rate of 7.2% per annum, compounded monthly. The repayments have been set at $1485 per month.
The interest charged and the balance owing for the first three months of the loan are shown in the spreadsheet below.

The cumulative frequency graph shows the distribution of the number of movie downloads made by 100 people in one month.

Which box-plot best represents the same data as displayed in the cumulative frequency graph?


`text{1st quartile}\ ~~ 3`
`text{Median}\ ~~ 6`
`text{3rd quartile}\ ~~ 7`
`=>C`
A random variable is normally distributed with mean 0 and standard deviation 1 . The table gives the probability that this random variable lies below `z` for some positive values of `z`.

The probability values given in the table are represented by the shaded area in the following diagram.

What is the probability that a normally distributed random variable with mean 0 and standard deviation 1 lies between 0 and 1.94 ?
A circular loop of wire is connected to a battery and a lamp. The apparatus is moved from `P` to `Q` along the path shown at a constant velocity through a region containing a uniform magnetic field.

Which graph shows the brightness of the lamp as the apparatus moves between `P` and `Q` ?


A typical galaxy has a diameter of 100 000 light years (∼30 000 pc).
Which graph is consistent with Hubble's measurements of the recessional velocity of galaxies?


The trimethylammonium ion, \(\ce{[({CH_3)_3NH}]^+}\), is a weak acid. The acid dissociation equation is shown.
\(\ce{[(CH3)3NH]+($aq$)+H2O($l$)\rightleftharpoons H3O+($aq$)+(CH3)3N($aq$)} \quad K_a = 1.55 \times 10^{-10}\)
At 20°C, a saturated solution of trimethylammonium chloride, \(\ce{[(CH_3)_3NH]Cl}\), has a pH of 4.46.
What is the \(K_{sp}\) of trimethylammonium chloride?
The amount of paracetamol in a sample needs to be determined.
The UV absorption spectrum of paracetamol is shown.

Based on the absorption spectra provided, which solvent should be used to determine the amount of paracetamol?


A conductor `P Q` is in a uniform magnetic field. The conductor rotates around the end `P` at a constant angular velocity.

Which graph shows the induced emf between `P` and `Q` as the conductor completes one revolution from the position shown?


An observer sees Io complete one orbit of Jupiter as Earth moves from `P_1` to `P_2`, and records the observed orbital period as `t_p`. Similarly, the time for one orbit of Io around Jupiter was measured as Earth moved between the pairs of points at `Q`, `R` and `S`, with the corresponding measured periods of Io being `t_Q`, `t_R` and `t_S`.

Which measurement of the orbital period would be the longest?
A model of the core of a nuclear fission reactor is shown.

When the reactor is operating normally, the moderator, control rods and coolant work in combination to maintain a controlled nuclear reaction in the fuel rods.
The moderator is a liquid which slows down neutrons to increase the rate of fission. The control rods absorb free neutrons. The coolant reduces the core temperature.
A fault causes some of the moderator to leak out of the core.
Which action would compensate for the effect of the loss of moderator?
Two experiments are performed with identical light sources having a wavelength of 400 nm.
In experiment \(A\), the light is incident on a pair of narrow slits 5.0 × 10\(^{-5}\) m apart, producing a pattern on a screen located 3.0 m behind the slits.

In experiment \(B\), the light is incident on different metal samples inside an evacuated tube as shown. The kinetic energy of any emitted photoelectrons can be measured.

Some results from experiment \(B\) are shown.
\begin{array}{|l|l|c|}
\hline
\rule{0pt}{1.5ex}\textit{Metal sample}\rule[-0.5ex]{0pt}{0pt}& \textit{Work function} \ \text{(J)} & \textit{Photoelectrons observed?} \\
\hline
\rule{0pt}{2.5ex}\text{Nickel}\rule[-1ex]{0pt}{0pt}&8.25 \times 10^{-19}&\text{No}\\
\hline
\rule{0pt}{2.5ex}\text{Calcium}\rule[-1ex]{0pt}{0pt}& 4.60 \times 10^{-19}&\text{Yes}\\
\hline
\end{array}
How do the results from Experiment \(A\) and Experiment \(B\) support TWO different models of light? In your answer, include a quantitative analysis of each experiment. (9 marks)
--- 22 WORK AREA LINES (style=lined) ---
A metal cylinder is located in a uniform magnetic field. The work function of the metal is `phi`.
Photons having an energy of 2`phi` strike the side of the cylinder, liberating photoelectrons which travel perpendicular to the magnetic field in a circular path. The maximum radius of the path is `r`.

If the photon energy is doubled, what will the maximum radius of the path become?
Which of the following statements correctly describes the gravitational interaction between the Earth and the Moon?
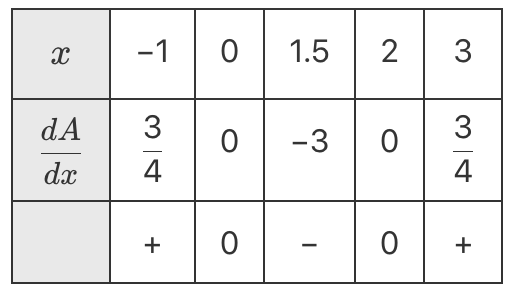
A strong magnet is moved past a copper block at a constant speed as shown.
What is the direction of the force acting on the copper block?
Consider this system in a fixed volume at constant temperature.
\(\ce{PCl5}(s)\rightleftharpoons \ce{PCl3}(l) + \ce{Cl2}(g)\)
This system is initially at equilibrium. A small amount of solid \(\ce{PCl5}\) is added.
Which statement is correct?
Which row of the table describes what happens when a solution of a weak acid is diluted? (Assume constant temperature.)

Cystic fibrosis is an autosomal recessive disorder caused by mutations in the CFTR gene. Many different recessive alleles cause cystic fibrosis.
The four most common alleles of the CFTR gene and their frequencies in the Australian population are shown in the table.
\begin{array}{|c|c|}
\hline \rule{0pt}{2.5ex}\quad \quad \textit{Allele} \quad \quad& \ \ \textit{Frequency of allele (%)}\ \ \\
\hline \rule{0pt}{2.5ex}\text{A} \rule[-1ex]{0pt}{0pt}& 98.33 \\
\hline \rule{0pt}{2.5ex}\text{al} \rule[-1ex]{0pt}{0pt}& 1.13 \\
\hline \rule{0pt}{2.5ex}\text{a2}\rule[-1ex]{0pt}{0pt}& 0.08 \\
\hline \rule{0pt}{2.5ex}\text{a3} \rule[-1ex]{0pt}{0pt}& 0.07 \\
\hline
\end{array}
What will be the most common genotype of cystic fibrosis patients in Australia?
Let `f: R to R, \ f(x)=x^{3}-x`.
Let `g_{a}: R to R` be the function representing the tangent to the graph of `f` at `x=a`, where `a in R`.
Let `(b, 0)` be the `x`-intercept of the graph of `g_{a}`.
--- 7 WORK AREA LINES (style=lined) ---
--- 2 WORK AREA LINES (style=lined) ---
--- 2 WORK AREA LINES (style=lined) ---
--- 2 WORK AREA LINES (style=lined) ---
--- 2 WORK AREA LINES (style=lined) ---
The coordinate `(b, 0)` is the horizontal axis intercept of `g_a`.
Let `g_b` be the function representing the tangent to the graph of `f` at `x=b`, as shown in the graph below.

--- 8 WORK AREA LINES (style=lined) ---
Let `p:R rarr R, \ p(x)=x^(3)+wx`, where `w in R`.
--- 3 WORK AREA LINES (style=lined) ---
A property of the graphs of `p` is that two distinct parallel tangents will always occur at `(t, p(t))` and `(-t,p(-t))` for all `t!=0`.
--- 6 WORK AREA LINES (style=lined) ---
--- 2 WORK AREA LINES (style=lined) ---
The Sunny Coast cricket clubroom is undergoing a major works project.
This project involves nine activities: `A` to `I`.
The table below shows the earliest start time (EST) and duration, in months, for each activity.
The immediate predecessor(s) is also shown.
The duration for activity `C` is missing.

The information in the table above can be used to complete a directed network.
This network will require a dummy activity.
--- 0 WORK AREA LINES (style=lined) ---
--- 5 WORK AREA LINES (style=blank) ---
--- 2 WORK AREA LINES (style=lined) ---
--- 4 WORK AREA LINES (style=lined) ---
What is the minimum time, in months, that the project can be completed in? (1 mark)
--- 3 WORK AREA LINES (style=lined) ---
a. `B\ text{to the start of activity}\ C.`
b. `text{Sketch network diagram.}`

`text{Duration of Activity C = 2 months}`
c. `text{Critical path:}\ BCDGI`
`text{Activities with a float time are activities}`
`text{not on critical path.}`
`:. \ text{Four activities are:}\ \ A, E, F, H`
d. `text{Completion time of}\ BCDGI = 20\ text{months}`
`text{Reduce the completion of}\ B\ text{by 3 months to create}`
`text{a new minimum completion time of 17 months.}`
A transport company has detailed records of all its deliveries. The number of minutes a delivery is made before or after its schedule delivery time can be modelled as a normally distributed random variable, `T`, with a mean of zero and a standard deviation of four minutes. A graph of the probability distribution of `T` is shown below. --- 3 WORK AREA LINES (style=lined) --- --- 3 WORK AREA LINES (style=lined) --- --- 5 WORK AREA LINES (style=lined) --- A rival transport company claims that there is a 0.85 probability that each delivery it makes will arrive on time or earlier. Assume that whether each delivery is on time or earlier is independent of other deliveries. --- 3 WORK AREA LINES (style=lined) --- --- 3 WORK AREA LINES (style=lined) --- --- 3 WORK AREA LINES (style=lined) --- --- 5 WORK AREA LINES (style=lined) ---

Hence, or otherwise, find the minimum value of `n` such that there is at least a 0.95 probability that one or more deliveries will not arrive on time or earlier. (1 mark)
Khaleda manufacturers the face cream in Dhaka, Bangladesh.
Dhaka is located at latitude 24° N and longitude 90° E.
Assume that the radius of Earth is 6400 km.
Khaleda receives an order from Abu Dhabi, United Arab Emirates (24° N, 54° E).
Khaleda sends the order by plane from Dhaka (24° N, 90° E) to Abu Dhabi (24° N, 54° E).
The flight departs Dhaka at 1.00 pm and arrives in Abu Dhabi 11 hours later.
The time difference between Dhaka and Abu Dhabi is two hours.
A helicopter takes the order from the airport to the customer's hotel.
The hotel is 27 km south and 109 km east of the airport.
a. `text(Let)\ \ r= \ text(radius of small circle)`

| `cos \ 24^@` | `= r/6400` |
| `r` | `=6400 xx cos 24^@` |
| `= 5846.69 …` | |
| `=5847 \ text{(nearest km)}` |
b. `text{Small circle through Dhaka and Abu Dhabi has radius of 5847 km.}`
| `text{Longitudinal difference}` | `= 90 – 54` |
| `= 36^@` |
| `:. \ text{Shortest distance}` | `= 36/360 xx 2 xx pi xx 5847` |
| `= 3673.77 …` | |
| `= 3674 \ text{km (nearest km)}` |
c. `text{Dhaka} \ (24^@ text{N}, 90^@ \ text{E}) \ text{is further east than Abu Dhabi} \ (24^@ text{N}, 54^@ \ text{E})`
`=> \ text{Dhaka is 2 hours ahead.}`
`:. \ text{Flight arrival time (Abu Dhabi time)}`
`= 1:00 \ text{pm} + 11 \ text{hours} – 2 \ text{hours}`
`= 10:00 \ text{pm}`
d.

| `tan theta` | `= 109/27` |
| `theta` | `=tan^(-1) (109/27) = 76.1^@` |
`:.\ text{Bearing of hotel from airport}`
`=180 – 76.1`
`=104^@\ \ text{(nearest degree)}`
e.

`text{Let X = position of hangar}`
`text{Find OX:}`
| `tan 12^@` | `= text{OX}/109` |
| `text{OX}` | `= 109 xx tan 12^@` |
| `= 23.17 \ text{km}` |
`:. \ text{AX (distance hangar is south of airport)}`
`= 27 – 23.17`
`= 4 \ text{km (nearest km)}`
Khaleda has designed a logo for her business.
The logo contains two identical equilateral triangles,
The side length of each triangle is 4.8 cm, shown in the diagram below.

In the logo, the two triangles overlap, as shown below. Part of the logo is shaded and part of the logo is not shaded.

An area of parkland has a river running through it, as shown below. The river is shown shaded.
The north bank of the river is modelled by the function `f_(1):[0,200]rarr R, \ f_(1)(x)=20 cos((pi x)/(100))+40`.
The south bank of the river is modelled by the function `f_(2):[0,200]rarr R, \ f_(2)(x)=20 cos((pi x)/(100))+30`.
The horizontal axis points east and the vertical axis points north.
All distances are measured in metres.

A swimmer always starts at point `P`, which has coordinates (50, 30).
Assume that no movement of water in the river affects the motion or path of the swimmer, which is always a straight line.
--- 2 WORK AREA LINES (style=lined) ---
--- 4 WORK AREA LINES (style=lined) ---
--- 5 WORK AREA LINES (style=lined) ---
--- 3 WORK AREA LINES (style=lined) ---
--- 6 WORK AREA LINES (style=lined) ---
--- 6 WORK AREA LINES (style=lined) ---
Another section of Kyla's business services and details cars and trucks.
Every vehicle is both serviced and detailed.
Each car takes two hours to service and one hour to detail.
Each truck takes three hours to service and three hours to detail.
Let `x` represent the number of cars that are serviced and detailed each day.
Let `y` represent the number of trucks that are serviced and detailed each day.
Past records suggest there are constraints on the servicing and detailing of vehicles each day.
These constraints are represented by Inequalities 1 to 4 below.
| `text{Inequality 1}` | `x >= 16` | |||
| `text{Inequality 2}` | `y >= 10` | |||
| `text{Inequality 3}` | `2x + 3y <= 96` | `text{(servicing department)}` | ||
| `text{Inequality 4}` | `x + 3y <= 72` | `text{(detailing department)}` |
The graph below shows the feasible region (shaded) that satisfies Inequalities 1 to 4 .

a. `text{At least 16 cars are serviced and detailed each day.}`
b. `text{Consider Inequality 3:} \ 2x + 3y ≤ 96`
`text{Total time} \ ≤ 96 \ text{hours and each employee works 8 hours.}`
`:. \ text{Maximum employees in servicing}`
`=96/8`
`=12`
c. `text{Find} \ y_text{max} \ text{when} \ x= 20`
`text{With reference to the feasible region,}`
`y_text{max} \ text{lies on the line of Inequality 4}`
| `x + 3y` | `= 72` |
| `20 + 3y` | `= 72` |
| `3y` | `= 52` |
| `y` | `= 17.33` |
`:. y_text{max} = 17 \ text{trucks (highest integer within the feasible region)}`
d. `text{Profits: $150 per car, $225 per truck}`
`P = 150x + 225y`
`=> \ m_P = – 150/225 = – 2/3`
`text{The objective function} \ (P) \ text{is parallel to}\ \ 2x+3y=96\ \ text{(Inequality 3)}`

`=> text{Maximum profit occurs at integer co-ordinates on line} \ AB.`
`A\ text(occurs at intersection of:)`
`2x+3y=96 and x+3y=72\ \ =>\ \ x=24`
`B\ text(occurs at intersection of:)`
`2x+3y=96 and y=10\ \ =>\ \ x=33`
`text(Max profit requires)\ \ x in [24,33]`
`text{Test each integer}\ xtext{-value for an integer}\ ytext{-value:}`
`:.\ text{Maximum profit occurs at}`
`text{(24, 16), (27, 14), (30, 12) and (33, 10)}`
The feasible region for a linear programming problem is shaded in the diagram below.

The line through points `A` and `B` is horizontal and the line through points `C` and `D` is vertical.
The equation for the objective function for this problem is of the form
`Z = bx + 4.5y` where `b > 0`
The value(s) of `b` such that the objective function is maximised only at point `C` is
Let `f:R→R, \ f(x)=cos(ax)`, where `a in R text(\{0})`, be a function with the property
`f(x)=f(x+h),` for all `h in Z`
Let `g:D rarr R, \ g(x)=log_(2)(f(x))` be a function where the range of `g` is `[-1,0]`.
A possible interval for `D` is
Shown below is the graph of `p`, which is the probability function for the number of times, `x`, that a ' 6 ' is rolled on a fair six-sided die in 20 trials.

Let `q` be the probability function for the number of times, `w`, that a ' 6 ' is not rolled on a fair six-sided die in 20 trials. `q(w)` is given by
The transformation `T:R^(2)rarrR^(2)` that maps the graph of `y=cos(x)` onto the graph of `y=cos(2x+4)` is
Four friends go to an ice-cream shop.
Akiro chooses chocolate and strawberry ice cream.
Doris chooses chocolate and vanilla ice cream.
Gohar chooses vanilla ice cream.
Imani chooses vanilla and lemon ice cream.
This information could be presented as a graph.
Consider the following four statements:
How many of these four statements are true?

`text(True statements :)`
`text{The graph is connected (a path exists between all vertices).}`
`text{The graph is bipartite (vertices can be divided into two groups).}`
`text{The graph is planar (no edges cross if strawberry is moved to the top).}`
`text{The graph forms a tree (no cycles).}`
`=> E`
Roadworks planned by the local council require 13 activities to be completed.
The network below shows these 13 activities and their completion times in weeks.

--- 1 WORK AREA LINES (style=lined) ---
--- 4 WORK AREA LINES (style=lined) ---

--- 6 WORK AREA LINES (style=lined) ---
a. `text{Scan forwards:}`

`EST \ (text{activity} \ K)`
`= A \ E \ J`
`= 6 + 5 + 3`
`= 14 \ text{weeks}`
b. `text{Scan backwards:}`

`text{Critical paths:}\ ADGLM\ text(and)\ AEHLM`
`:. \ text{7 activities have no float time:} \ ADEGHLM`
c. `text{There are 9 possible paths}`
`ADGLM\ (19), AEHLM\ (19) , AEIM\ (14)`
`AEJK\ (17), BCEIM \ (13), BCEJK\ (16)`
`BCEHLM\ (18), BCDGLM \ (18), BFK (11)`
`text{Consider the 5 paths with completions over 16 weeks}`
` to \ text{all contain}\ A\ text{or}\ L \ text{or both.}`
`text{Consider} \ ADGLM, AEHLM \ (text{contains both} \ A\ text{and} \ L )`
`to \ text{reduce} \ L xx 2 \ , A xx 1 \ text{to reach 16 weeks}`
`to \ text{cheaper than} \ L xx 1 \ , \ A xx 2`
`text{Consider} \ BCEHLM , BCDGLM\ (text{both contain} \ L \ text{only})`
`to \ text{reduce} \ L xx 2 \ text{to reach 16 weeks}`
`text{Consider} \ AEJK \ ( text{contains} \ A \ text{only} )`
`to \ text{reduce} \ A xx 1 \ text{reach 16 weeks}.`
`:. \ text{Minimum cost to reduce time to 16 weeks}`
`= 2 xx 120\ 000 + 1 xx 140\ 000`
`= $ 380\ 000`
Health and training sessions are held each day at the new community centre.
The constraints on the health and training sessions each day can be represented by the following five inequalities.
Inequality 1 `x >= 0`
Inequality 2 `y >= 0`
Inequality 3 `x + y >= 10`
Inequality 4 `y >= x`
Inequality 5 `30x + 40y <= 600`
The graph below shows the feasible region (shaded) that satisfies Inequality 1 to 5.

a. `text{The time of all adult and children sessions each day, in total,}`
`text{must be less than 600 minutes (10 hours).}`
b. `text{Maximum children sessions = 8}`
`text{(largest integer value of} \ x \ text{in the feasible region)}`
c.i. `P = 45 x + 60 y`
`y = – 3/4 x + P/60`
`text{Objective function’s gradient is the same as} \ 30x + 40y = 600`
`=> \ text{maximum profit occurs at integer points on graph of}`
`30x+40y=600\ \ text{in feasible region.}`
`text{Using (0, 15):}`
| `P_text{max}` | `= 45 xx 0 + 60 xx 15` |
| `= $900` |
c.ii.

`P_text{max} \ text{occurs at (0, 15), (4, 12) and (8, 9)}`
The maximum load of a lift in a chocolate company's office building is 1000 kg. The masses of the employees who use the lift are normally distributed with a mean of 75 kg and a standard deviation of 8 kg. On a particular morning there are `n` employees about to use the lift.
--- 6 WORK AREA LINES (style=lined) ---
Clare, who is one of the employees, likes to have a hot drink after she exits the lift. The time taken for the drink machine to dispense a hot drink is normally distributed with a mean of 2 minutes and a standard deviation of 0.5 minutes. Times taken to dispense successive hot drinks are independent.
--- 5 WORK AREA LINES (style=lined) ---
Clare is a statistician for the chocolate company. The number of chocolate bars sold daily is normally distributed with a mean of 60 000 and a standard deviation of 5000. To increase sales, the company decides to run an advertising campaign. After the campaign, the mean daily sales from 14 randomly selected days was found to be 63 500.
Clare has been asked to investigate whether the advertising campaign was effective, so she decides to perform a one-sided statistical test at the 1% level of significance.
--- 1 WORK AREA LINES (style=lined) ---
--- 2 WORK AREA LINES (style=lined) ---
--- 2 WORK AREA LINES (style=lined) ---
--- 3 WORK AREA LINES (style=lined) ---
--- 5 WORK AREA LINES (style=lined) ---
Roadworks planned by the local council require 13 activities to be completed.
The network below shows these 13 activities and their completion times in weeks.
--- 5 WORK AREA LINES (style=lined) ---
--- 3 WORK AREA LINES (style=lined) ---
--- 12 WORK AREA LINES (style=lined) ---
a. `text{Scan forwards:}`
`EST \ (text{activity} \ K)`
`= A \ E \ J`
`= 6 + 5 + 3`
`= 14 \ text{weeks}`
b. `text{Scan backwards:}`
`text{Critical paths:}\ ADGLM\ text(and)\ AEHLM`
`:. \ text{7 activities have no float time:} \ ADEGHLM`
c. `text{There are 9 possible paths}`
`ADGLM\ (19), AEHLM\ (19) , AEIM\ (14)`
`AEJK\ (17), BCEIM \ (13), BCEJK\ (16)`
`BCEHLM\ (18), BCDGLM \ (18), BFK (11)`
`text{Consider the 5 paths with completions over 16 weeks}`
` to \ text{all contain}\ A\ text{or}\ L \ text{or both.}`
`text{Consider} \ ADGLM, AEHLM \ (text{contains both} \ A\ text{and} \ L )`
`to \ text{reduce} \ L xx 2 \ , A xx 1 \ text{to reach 16 weeks}`
`to \ text{cheaper than} \ L xx 1 \ , \ A xx 2`
`text{Consider} \ BCEHLM , BCDGLM\ (text{both contain} \ L \ text{only})`
`to \ text{reduce} \ L xx 2 \ text{to reach 16 weeks}`
`text{Consider} \ AEJK \ ( text{contains} \ A \ text{only} )`
`to \ text{reduce} \ A xx 1 \ text{reach 16 weeks}.`
`:. \ text{Minimum cost to reduce time to 16 weeks}`
`= 2 xx 120\ 000 + 1 xx 140\ 000`
`= $ 380\ 000`