The diagram shows the graph `f(x)`.

What is the value of `a`, where `a > 0`, so that `int_-a^a f(x)\ dx = 0`? (1 mark)
--- 3 WORK AREA LINES (style=lined) ---
Aussie Maths & Science Teachers: Save your time with SmarterEd
The diagram shows the graph `f(x)`.
What is the value of `a`, where `a > 0`, so that `int_-a^a f(x)\ dx = 0`? (1 mark)
--- 3 WORK AREA LINES (style=lined) ---
A particle is moving along the `x`-axis. The displacement of the particle at time `t` seconds is `x` metres.
At a certain time, `dot x = -3\ text(ms)^(-1)` and `ddot x = 2\ text(ms)^(-2)`.
Which statement describes the motion of the particle at that time?
(A) The particle is moving to the right with increasing speed.
(B) The particle is moving to the left with increasing speed.
(C) The particle is moving to the right with decreasing speed.
(D) The particle is moving to the left with decreasing speed.
Norman and Pat each bought the same type of tractor for $60 000 at the same time. The value of their tractors depreciated over time.
The salvage value `S`, in dollars, of each tractor, is its depreciated value after `n` years.
Norman drew a graph to represent the salvage value of his tractor.

--- 2 WORK AREA LINES (style=lined) ---
--- 2 WORK AREA LINES (style=lined) ---
--- 3 WORK AREA LINES (style=lined) ---
--- 4 WORK AREA LINES (style=lined) ---
Pat used the declining balance formula for calculating the salvage value of her tractor. The depreciation rate that she used was 20% per annum.
--- 4 WORK AREA LINES (style=lined) ---
--- 2 WORK AREA LINES (style=lined) ---
A study on the mobile phone usage of NSW high school students is to be conducted.
Data is to be gathered using a questionnaire.
The questionnaire begins with the three questions shown.

--- 1 WORK AREA LINES (style=lined) ---
--- 2 WORK AREA LINES (style=lined) ---
Describe a method that could be used to obtain a representative stratified sample. (1 mark)
--- 2 WORK AREA LINES (style=lined) ---
--- 2 WORK AREA LINES (style=lined) ---
The graph shows tax payable against taxable income, in thousands of dollars.

--- 1 WORK AREA LINES (style=lined) ---
--- 3 WORK AREA LINES (style=lined) ---
--- 2 WORK AREA LINES (style=lined) ---
--- 4 WORK AREA LINES (style=lined) ---
| i. |  |
`text(Income on)\ $21\ 000=$3000\ \ \ text{(from graph)}`
ii. `text(Using the points)\ (21,3)\ text(and)\ (39,9)`
| `text(Gradient at)\ A` | `= (y_2\ – y_1)/(x_2\ – x_1)` |
| `= (9000-3000)/(39\ 000 -21\ 000)` | |
| `= 6000/(18\ 000)` | |
| `= 1/3\ \ \ \ \ text(… as required)` |
iii. `text(The gradient represents the tax applicable to each dollar)`
| `text(Tax)` | ` = 1/3\ text(of each dollar earned)` |
| ` = 33 1/3\ text(cents per dollar earned)` |
iv. `text( Tax payable up to $21 000 = $3000)`
`text(Tax payable on income between $21 000 and $39 000)`
` = 1/3 (I\ – 21\ 000)`
| `:.\ text(Tax payable on)\ \ I` | `= 3000 + 1/3 (I\ – 21\ 000)` |
| `= 3000 + 1/3 I\ – 7000` | |
| `= 1/3 I\ – 4000` |
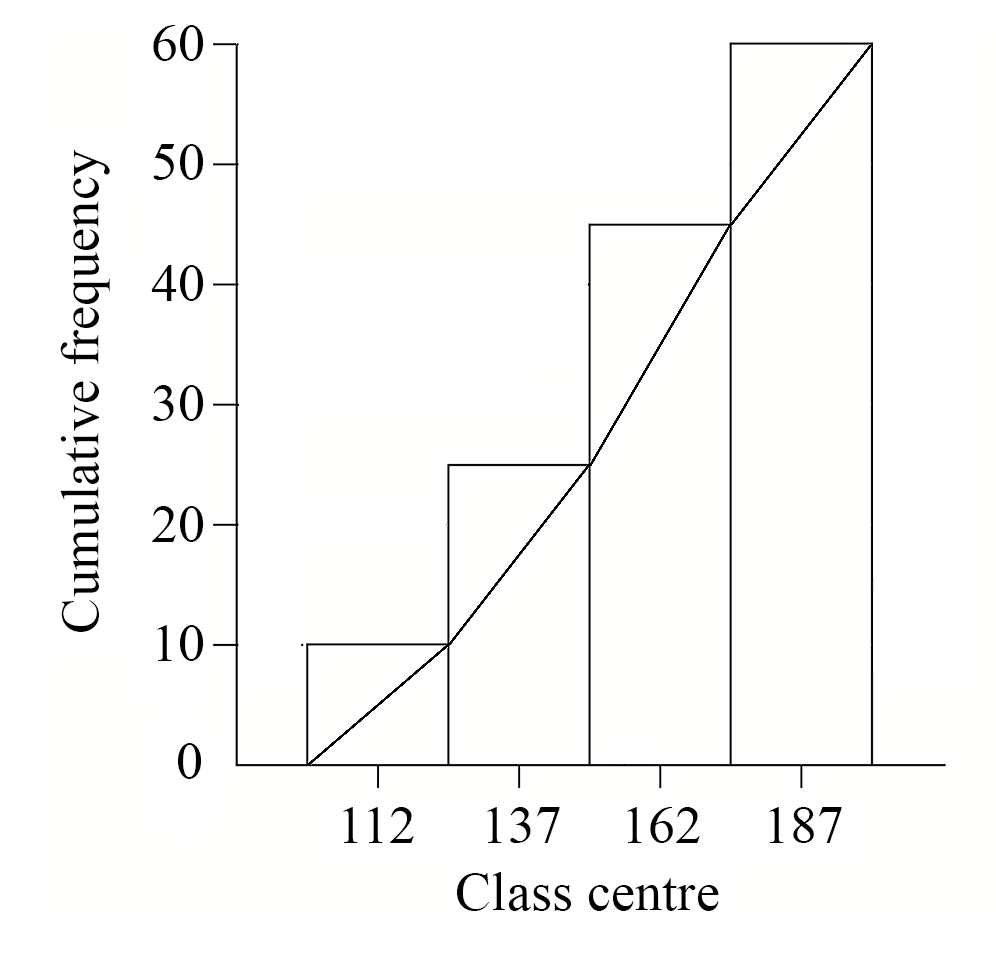
A new shopping centre has opened near a primary school. A survey is conducted to determine the number of motor vehicles that pass the school each afternoon between 2.30 pm and 4.00 pm.
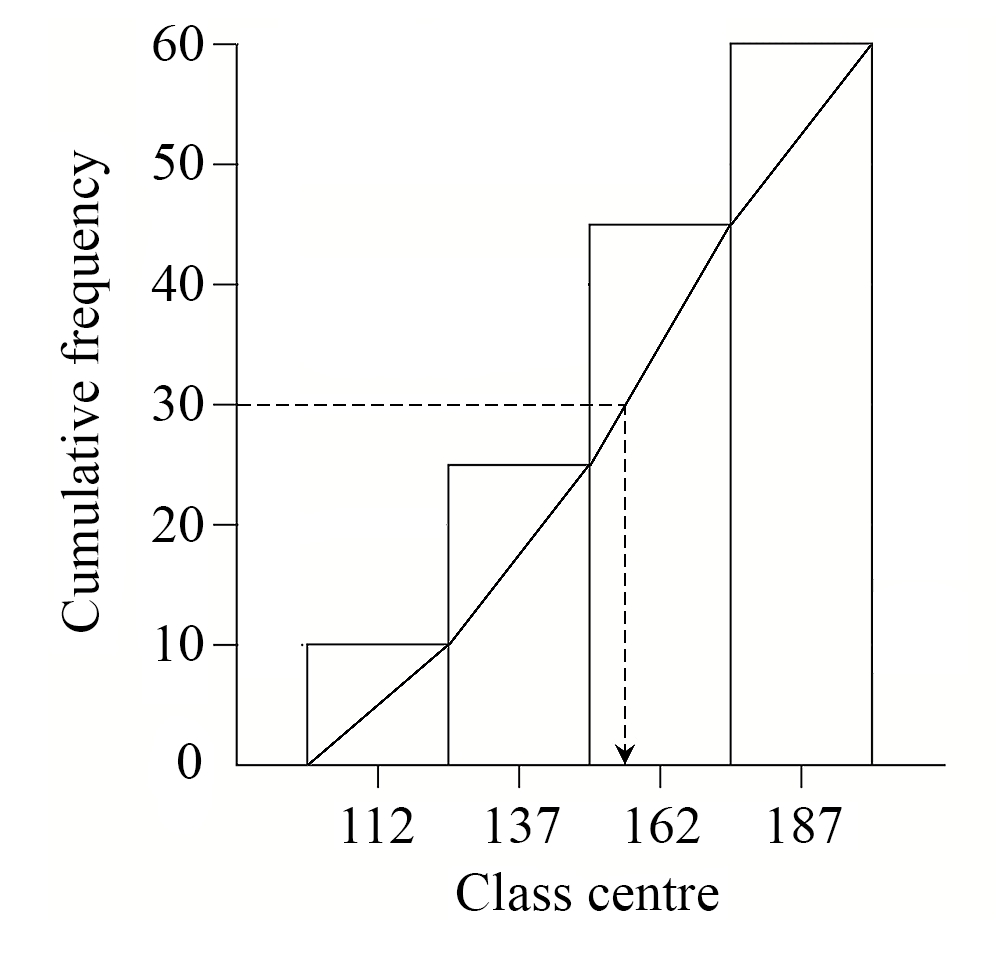
The results for 60 days have been recorded in the table and are displayed in the cumulative frequency histogram.

--- 1 WORK AREA LINES (style=lined) ---
What problem could arise from the change in the median number of motor vehicles passing the school before and after the opening of the new shopping centre?
Briefly recommend a solution to this problem. (2 marks)
--- 5 WORK AREA LINES (style=lined) ---
`text(Solutions)`
| i. | `X` | `= 25\ -10` |
| `= 15` |
| ii. | |
iii. `text(Median)\ ~~155`
| iv. | `text(Problems)` |
| `text(- increased traffic delays)` | |
| `text(- increased danger to students leaving school)` | |
| `text(Solutions)` | |
| `text(- signpost alternative routes around school)` | |
| `text(- decrease the speed limit in the area)` |
Joel mixes petrol and oil in the ratio 40 : 1 to make fuel for his leaf blower.
How much oil should he add to the petrol to ensure that the fuel is in the correct ratio? (1 mark)
--- 2 WORK AREA LINES (style=lined) ---
He wishes to use this fuel in his lawnmower. However, his lawnmower requires the petrol and oil to be mixed in the ratio 25 : 1.
How much oil should he add to the container so that the fuel is in the correct ratio for his lawnmower? (3 marks)
--- 6 WORK AREA LINES (style=lined) ---
A ship sails 6 km from `A` to `B` on a bearing of 121°. It then sails 9 km to `C`. The
size of angle `ABC` is 114°.

Copy the diagram into your writing booklet and show all the information on it.
| (i) |  |
`text(Let point)\ D\ text(be due North of point)\ B`
| `/_ABD` | `=180-121\ text{(cointerior with}\ \ /_A text{)}` |
| `=59^@` | |
| `/_DBC` | `=114-59` |
| `=55^@` |
`:. text(Bearing of)\ \ C\ \ text(from)\ \ B\ \ text(is)\ 055^@`
(ii) `text(Using cosine rule:)`
| `AC^2` | `=AB^2+BC^2-2xxABxxBCxxcos/_ABC` |
| `=6^2+9^2-2xx6xx9xxcos114^@` | |
| `=160.9275…` | |
| `:.AC` | `=12.685…\ \ \ text{(Noting}\ AC>0 text{)}` |
| `=13\ text(km)\ text{(nearest km)}` |
(iii) `text(Need to find)\ /_ACB\ \ \ text{(see diagram)}`
| `cos/_ACB` | `=(AC^2+BC^2-AB^2)/(2xxACxxBC)` |
| `=((12.685…)^2+9^2-6^2)/(2xx(12.685..)xx9)` | |
| `=0.9018…` | |
| `/_ACB` | `=25.6^@\ text{(to 1 d.p.)}` |
`text(From diagram,)`
`/_BCE=55^@\ text{(alternate angle,}\ DB\ text(||)\ CE text{)}`
`:.\ text(Bearing of)\ A\ text(from)\ C`
| `=180+55+25.6` | |
| `=260.6` | |
| `=261^@\ text{(nearest degree)}` |
In an experiment, two unbiased dice, with faces numbered 1, 2, 3, 4, 5, 6 are rolled 18 times.
The difference between the numbers on their uppermost faces is recorded each time. Juan performs this experiment twice and his results are shown in the tables.

Juan states that Experiment 2 has given results that are closer to what he expected than the results given by Experiment 1.
Is he correct? Explain your answer by finding the sample space for the dice differences and using theoretical probability. (4 marks)
--- 8 WORK AREA LINES (style=lined) ---
`text(Sample space for dice differences)`


`text(Juan is correct. The table shows Experiment 1)`
`text(has greater total differences to the expected)`
`text(frequencies than Experiment 2)`
The height and mass of a child are measured and recorded over its first two years.
\begin{array} {|l|c|c|}
\hline \rule{0pt}{2.5ex} \text{Height (cm), } H \rule[-1ex]{0pt}{0pt} & \text{45} & \text{50} & \text{55} & \text{60} & \text{65} & \text{70} & \text{75} & \text{80} \\
\hline \rule{0pt}{2.5ex} \text{Mass (kg), } M \rule[-1ex]{0pt}{0pt} & \text{2.3} & \text{3.8} & \text{4.7} & \text{6.2} & \text{7.1} & \text{7.8} & \text{8.8} & \text{10.2} \\
\hline
\end{array}
This information is displayed in a scatter graph.
--- 2 WORK AREA LINES (style=lined) ---
Find the equation of this line. (2 marks)
--- 4 WORK AREA LINES (style=lined) ---
A yacht race follows the triangular course shown in the diagram. The course from `P` to `Q` is 1.8 km on a true bearing of 058°.
At `Q` the course changes direction. The course from `Q` to `R` is 2.7 km and `/_PQR = 74^@`.

--- 1 WORK AREA LINES (style=lined) ---
--- 4 WORK AREA LINES (style=lined) ---
What is the area of this ‘no-go’ zone? (1 mark)
--- 2 WORK AREA LINES (style=lined) ---
| i. |  |
`/_ PQS = 58^@ \ \ \ (text(alternate to)\ /_TPQ)`
`text(Bearing of)\ R\ text(from)\ Q`
| `= 180^@ + 58^@ + 74^@` |
| `= 312^@` |
ii. `text(Using Cosine rule:)`
| `RP^2` | `=RQ^2` + `PQ^2` `- 2` `xx RQ` `xx PQ` `xx cos` `/_RQP` |
| `= 2.7^2` + `1.8^2` `- 2` `xx 2.7` `xx 1.8` `xx cos74^@` | |
| `=7.29 + 3.24\ – 2.679…` | |
| `=7.851…` |
| `:.RP` | `= sqrt(7.851…)` |
| `=2.8019…` | |
| `~~ 2.8\ text(km) (text(1 d.p.) )` |
iii. `text(Using)\ \ A = 1/2 ab sinC`
| `A` | `= 1/2` `xx 2.7` `xx 1.8` `xx sin74^@` |
| `= 2.3358…` | |
| `= 2.3\ text(km²)` |
`:.\ text(No-go zone is 2.3 km²)`
In a school, boys and girls were surveyed about the time they usually spend on the internet over a weekend. These results were displayed in box-and-whisker plots, as shown below.

--- 1 WORK AREA LINES (style=lined) ---
--- 1 WORK AREA LINES (style=lined) ---
Under what circumstances would this statement be true? (1 mark)
--- 2 WORK AREA LINES (style=lined) ---
The mass of a sample of microbes is 50 mg. There are approximately `2.5 × 10^6` microbes in the sample.
In standard form, what is the approximate mass in grams of one microbe? (2 marks)
--- 4 WORK AREA LINES (style=lined) ---
Adhele has 2000 shares. The current share price is $1.50 per share. Adhele is paid a dividend of $0.30 per share.
A retailer has collected data on the number of televisions that he sold each week in 2012.
He grouped the data into classes and displayed the data using a cumulative frequency histogram and polygon (ogive).

--- 4 WORK AREA LINES (style=lined) ---
Is he correct? Give a reason for your answer. (1 mark)
--- 2 WORK AREA LINES (style=lined) ---
The probability that Michael will score more than 100 points in a game of bowling is `31/40`.
Is the commentator correct? Give a reason for your answer. (1 mark)
--- 2 WORK AREA LINES (style=lined) ---
--- 1 WORK AREA LINES (style=lined) ---
In July, Ms Alott received a statement for her credit card account. The account has no interest free period. Compound interest is calculated daily and charged to her account on the statement date.

What is the minimum payment due on this account?
(A) `$23.56`
(B) `$25.00`
(C) `$86.08`
(D) `$87.20`
The area graph shows the cost and profits for a business over a period of time.

The information in the area graph is then displayed as a line graph.
Which of the following line graphs best displays the data from the area graph?


A restaurant serves three scoops of different flavoured ice-cream in a bowl. There are five flavours to choose from.
How many different combinations of ice-cream could be chosen?
(A) `10`
(B) `15`
(C) `30`
(D) `60`
A factory makes boots and sandals. In any week
• the total number of pairs of boots and sandals that are made is 200
• the maximum number of pairs of boots made is 120
• the maximum number of pairs of sandals made is 150.
The factory manager has drawn a graph to show the numbers of pairs of boots (`x`) and sandals (`y`) that can be made.

--- 2 WORK AREA LINES (style=lined) ---
--- 3 WORK AREA LINES (style=lined) ---
Compare the profits at `B` and `C`. (2 marks)
--- 5 WORK AREA LINES (style=lined) ---
A personal identification number (PIN) is made up of four digits. An example of a PIN is

--- 2 WORK AREA LINES (style=lined) ---
--- 2 WORK AREA LINES (style=lined) ---
How many square centimetres are in 0.0075 square metres?
(A) 0.75
(B) 7.5
(C) 75
(D) 7500
In 2010, the city of Thagoras modelled the predicted population of the city using the equation
`P = A(1.04)^n`.
That year, the city introduced a policy to slow its population growth. The new predicted population was modelled using the equation
`P = A(b)^n`.
In both equations, `P` is the predicted population and `n` is the number of years after 2010.
The graph shows the two predicted populations.

--- 1 WORK AREA LINES (style=lined) ---
What does `A` represent? (1 mark)
--- 1 WORK AREA LINES (style=lined) ---
(1) Explain, with or without calculations, why 1.05 is not a suitable first estimate for `b`. (1 mark)
(2) With `n = 20` and `P = 4\ 460\ 000`, use the guess-and-check method and the equation `P = A(b)^n` to estimate the value of `b` to two decimal places. Show at least TWO estimate values for `b`, including calculations and conclusions. (2 marks)
--- 4 WORK AREA LINES (style=lined) ---
Justify your answer with suitable calculations. (2 marks)
--- 5 WORK AREA LINES (style=lined) ---
A golf ball is hit from point `A` to point `B`, which is on the ground as shown. Point `A` is 30 metres above the ground and the horizontal distance from point `A` to point `B` is 300 m.

The path of the golf ball is modelled using the equation
`h = 30 + 0.2d-0.001d^2`
where
`h` is the height of the golf ball above the ground in metres, and
`d` is the horizontal distance of the golf ball from point `A` in metres.
The graph of this equation is drawn below.

--- 1 WORK AREA LINES (style=lined) ---
What horizontal distance does the ball travel in the period between these two occasions? (1 mark)
--- 2 WORK AREA LINES (style=lined) ---
--- 2 WORK AREA LINES (style=lined) ---
Find all values of `d` that are not suitable to use with this model, and explain why these values are not suitable. (2 marks)
--- 4 WORK AREA LINES (style=lined) ---
The mean of a set of ten scores is 14. Another two scores are included and the new mean is 16.
What is the mean of the two additional scores?
(A) 4
(B) 16
(C) 18
(D) 26
Leanne wants to build a rectangular vegetable garden in her backyard. She has 20 metres of fencing and will use a wall as one side of the garden. The plan for her garden is shown, where `x` metres is the width of her garden.

Which equation gives the area, `A`, of the vegetable garden?
(A) `A=10x-x^2`
(B) `A=10x-2x^2`
(C) `A=20x-x^2`
(D) `A=20x-2x^2`
There are 60 000 students sitting a state-wide examination. If the results form a normal distribution, how many students would be expected to score a result between 1 and 2 standard deviations above the mean?
You may assume for normally distributed data that:
(A) `8100`
(B) `16\ 200`
(C) `20\ 400`
(D) `28\ 500`
The circle `x^2+(y-c)^2=r^2`, where `c>0` and `r>0`, lies inside the parabola `y=x^2`. The circle touches the parabola at exactly two points located symmetrically on opposite sides of the `y`-axis, as shown in the diagram.


The diagram shows two parallel brick walls `KJ` and `MN` joined by a fence from `J` to `M`. The wall `KJ` is `s` metres long and `/_KJM=alpha`. The fence `JM` is `l` metres long.
A new fence is to be built from `K` to a point `P` somewhere on `MN`. The new fence `KP` will cross the original fence `JM` at `O`.
Let `OJ=x` metres, where `0<x<l`.
--- 6 WORK AREA LINES (style=lined) ---
--- 6 WORK AREA LINES (style=lined) ---
--- 2 WORK AREA LINES (style=lined) ---
| i. |  |
`A=text(Area)\ Delta OJK+text(Area)\ Delta OMP`
`text(Using sine rule)`
`text(Area)\ Delta OJK=1/2\ x s sin alpha`
`text(Area)\ DeltaOMP =>text(Need to find)\ \ MP`
| `/_OKJ` | `=/_MPO\ \ text{(alternate angles,}\ MP\ text(||)\ KJtext{)}` |
| `/_PMO` | `=/_OJK=alpha\ \ text{(alternate angles,}\ MP\ text(||)\ KJtext{)}` |
`:.\ DeltaOJK\ text(|||)\ Delta OMP\ \ text{(equiangular)}`
| `=>x/s` | `=(l-x)/(MP)\ ` | ` text{(corresponding sides of similar triangles)}` |
| `MP` | `=(l-x)/x *s` |
| `text(Area)\ Delta\ OMP` | `=1/2 (l-x)* MP * sin alpha` |
| `=1/2 (l-x)*((l-x))/x* s sin alpha` |
| `:. A` | `=1/2 x*s sin alpha+1/2 (l-x)*((l-x))/x* s sin alpha` |
| `=s sin alpha(1/2 x+1/2 (l-x)*((l-x))/x)` | |
| `=s sin alpha(1/2 x+(l-x)^2/(2x))` | |
| `=s sin alpha(1/2 x+l^2/(2x)-l+1/2 x)` | |
| `=s(x-l+l^2/(2x))sin alpha\ \ \ \ text(… as required)` |
ii. `text(Find)\ x\ text(such that)\ A\ text(is a minimum)`
| `A` | `=s(x-l+l^2/(2x))sin alpha` |
| `(dA)/(dx)` | `=s(1-l^2/(2x^2))sin alpha` |
`text(MAX/MIN when)\ (dA)/(dx)=0`
| `s(1-l^2/(2x^2))sin alpha` | `=0` |
| `l^2/(2x^2)` | `=1` |
| `2x^2` | `=l^2` |
| `x^2` | `=l^2/2` |
| `x` | `=l/sqrt2,\ \ \ x>0` |
`(d^2A)/(dx^2)=s((l^2)/(2x^3))sin alpha`
`text(S)text(ince)\ \ 0<alpha<90°\ \ =>\ sin alpha>0,\ \ l>0\ \ text(and)\ \ x>0`
`(d^2A)/(dx^2)>0\ \ \ =>text(MIN at)\ \ x=l/sqrt2`
iii. `text(S)text(ince)\ \ MP=((l-x))/x s\ \ text(and MIN when)\ \ x=l/sqrt2`
| `MP` | `=((l-l/sqrt2)/(l/sqrt2))s xx sqrt2/sqrt2` |
| `=((sqrt2 l-l))/l s` | |
| `=(sqrt2-1)s\ \ text(metres)` |
`:.\ MP=(sqrt2-1)s\ \ text(metres when)\ A\ text(is a MIN.)`
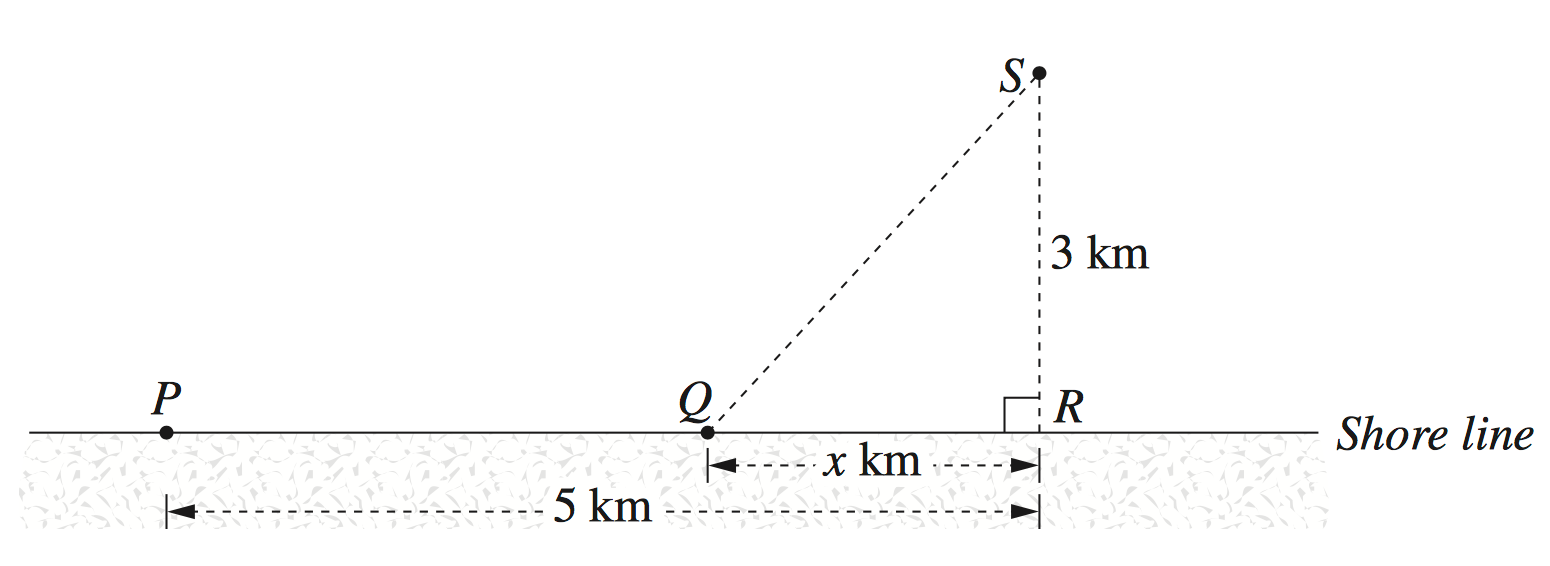
An oil rig, `S`, is 3 km offshore. A power station, `P`, is on the shore. A cable is to be laid from `P` to `S`. It costs $1000 per kilometre to lay the cable along the shore and $2600 per kilometre to lay the cable underwater from the shore to `S`.
The point `R` is the point on the shore closest to `S`, and the distance `PR` is 5 km.
The point `Q` is on the shore, at a distance of `x` km from `R`, as shown in the diagram.
--- 2 WORK AREA LINES (style=lined) ---
--- 2 WORK AREA LINES (style=lined) ---
--- 5 WORK AREA LINES (style=lined) ---
--- 8 WORK AREA LINES (style=lined) ---
Determine the path for laying the cable in order to minimise the cost in this case. (2 marks)
--- 5 WORK AREA LINES (style=lined) ---
A farmer is fencing a paddock using `P` metres of fencing. The paddock is to be in the shape of a sector of a circle with radius `r` and sector angle `theta` in radians, as shown in the diagram.

--- 2 WORK AREA LINES (style=lined) ---
--- 2 WORK AREA LINES (style=lined) ---
--- 4 WORK AREA LINES (style=lined) ---
--- 2 WORK AREA LINES (style=lined) ---
--- 5 WORK AREA LINES (style=lined) ---
Two points, `A` and `B`, are on cliff tops on either side of a deep valley. Let `h` and `R` be the vertical and horizontal distances between `A` and `B` as shown in the diagram. The angle of elevation of `B` from `A` is `theta`, so that `theta=tan^-1(h/R)`.

At time `t=0`, projectiles are fired simultaneously from `A` and `B`. The projectile from `A` is aimed at `B`, and has initial speed `U` at an angle of `theta` above the horizontal. The projectile from `B` is aimed at `A` and has initial speed `V` at an angle `theta` below the horizontal.
The equations of motion for the projectile from `A` are
`x_1=Utcos theta` and `y_1=Utsin theta-1/2 g t^2`,
and the equations for the motion of the projectile from `B` are
`x_2=R-Vtcos theta` and `y_2=h-Vtsin theta-1/2 g t^2`, (DO NOT prove these equations.)
--- 3 WORK AREA LINES (style=lined) ---
--- 6 WORK AREA LINES (style=lined) ---
--- 6 WORK AREA LINES (style=lined) ---
A basketball player throws a ball with an initial velocity `v` m/s at an angle of `theta` to the horizontal. At the time the ball is released its centre is at `(0,0)`, and the player is aiming for the point `(d,h)` as shown on the diagram. The line joining `(0,0) ` and `(d,h)` makes an angle `alpha` with the horizontal, where `0<alpha<pi/2`.

Assume that at time `t` seconds after the ball is thrown its centre is at the point `(x,y)`, where
`x=vtcos theta`
`y=vt sin theta-5 t^2`. (DO NOT prove this.)
--- 1 WORK AREA LINES (style=lined) ---
(2) What happens to `v` as `theta\ ->pi/2` ? (1 mark)
--- 1 WORK AREA LINES (style=lined) ---
--- 6 WORK AREA LINES (style=lined) ---
--- 3 WORK AREA LINES (style=lined) ---
*Please note for the purposes of this question, part (a)(ii) showed that when `tanA tanB=-1`, then `A-B=pi/2`
--- 6 WORK AREA LINES (style=lined) ---
Points `A` and `B` are located `d` metres apart on a horizontal plane. A projectile is fired from `A` towards `B` with initial velocity `u` m/s at angle `alpha` to the horizontal.
At the same time, another projectile is fired from `B` towards `A` with initial velocity `w` m/s at angle `beta` to the horizontal, as shown on the diagram.
The projectiles collide when they both reach their maximum height.

The equations of motion of a projectile fired from the origin with initial velocity `V` m/s at angle `theta` to the horizontal are
`x=Vtcostheta` and `y=Vtsintheta-g/2 t^2`. (DO NOT prove this.)
--- 5 WORK AREA LINES (style=lined) ---
--- 3 WORK AREA LINES (style=lined) ---
--- 8 WORK AREA LINES (style=lined) ---
The diagram shows a point `T` on the unit circle `x^2+y^2=1` at an angle `theta` from the positive `x`-axis, where `0<theta<pi/2`.
The tangent to the circle at `T` is perpendicular to `OT`, and intersects the `x`-axis at `P`, and the line `y=1` intersects the `y`-axis at `B`.

--- 5 WORK AREA LINES (style=lined) ---
--- 2 WORK AREA LINES (style=lined) ---
--- 5 WORK AREA LINES (style=lined) ---
--- 6 WORK AREA LINES (style=lined) ---
| i. |  |
`text(Find)\ T:`
`text(S)text(ince)\ \ cos theta=x/1\ \ \ text(and)\ \ \ sin theta=y/1`
`:. T\ (cos theta, sin theta)`
`text(Gradient of)\ OT=sin theta/cos theta`
`:.\ text(Gradient)\ PT=-cos theta/sin theta\ \ text{(} _|_ text{lines)}`
`text(Equation of)\ PT\ text(where)`
`m=-cos theta/sin theta,\ \ text(and through)\ \ (cos theta, sin theta)`
| `text(Using)\ \ y-y_1` | `=m(x-x_1)` |
| `y-sin theta` | `=-cos theta/sin theta(x-cos theta)` |
| `y sin theta-sin^2 theta` | `=-x cos theta+cos^2 theta` |
| `x cos theta+y sin theta` | `=sin^2 theta+cos^2 theta` |
| `x cos theta+y sin theta` | `=1\ \ \ \ \ text(… as required)` |
ii. `text(Find)\ Q:`
`Q\ => text(intersection of)\ xcos theta+y sin theta=1\ \ text(and)\ \ y=1`
| `x cos theta+sin theta` | `=1` |
| `x cos theta` | `=1-sin theta` |
| `x` | `=(1-sin theta)/cos theta` |
`:.\ text(Length of)\ BQ\ text(is)\ \ (1-sin theta)/cos theta\ text(units)`
iii. `text(Show Area)\ OPQB=(2-sin theta)/(2cos theta)`
`A=1/2h(a+b)\ \ text(where)\ \ h=OB=1\ \ a=OP\ \ text(and)`
`b=BQ=(1-sin theta)/cos theta`
`text(Find length)\ OP:`
`P => xcos theta+ysin theta=1 \ text(cuts)\ \ x text(-axis)`
| `xcos theta` | `=1` |
| `x` | `=1/cos theta` |
| `=>text(Length)\ OP` | `=1/cos theta` |
| `text(Area)\ OPQB` | `=1/2xx1(1/cos theta+(1-sin theta)/cos theta)` |
| `=1/2((2-sin theta)/cos theta)` | |
| `=(2-sin theta)/(2cos theta)\ \ text(u²)\ \ \ text(… as required)` |
iv. `text(Find)\ theta\ text(such that Area)\ OPQB\ text(is a MIN)`
| `A` | `=(2-sin theta)/(2cos theta)` |
| `(dA)/(d theta)` | `=(2cos theta(-cos theta)-(2- sin theta)(-2 sin theta))/(4cos^2 theta)` |
| `=(4 sin theta-2sin^2 theta-2 cos^2 theta)/(4 cos^2 theta)` | |
| `=(4sin theta-2(sin^2 theta+cos^2 theta))/(4 cos^2 theta)` | |
| `=(4sin theta-2)/(4cos^2 theta)` | |
| `=(2sin theta-1)/(2 cos^2 theta)` |
`text(MAX or MIN when)\ (dA)/(d theta)=0`
| `=>2sin theta-1` | `=0` |
| `sin theta` | `=1/2` |
| `theta` | `=pi/6\ \ \ \ \0<theta<pi/2` |
`text(Test for MAX/MIN)`
`text(If)\ theta=pi/12\ \ (dA)/(d theta)<0`
`text(If)\ theta=pi/3\ \ (dA)/(d theta)>0\ \ =>text(MIN)`
`:.\text(Area)\ OPQB\ text(is a MIN when)\ theta=pi/6`.
Two straight roads meet at `R` at an angle of 60°. At time `t=0` car `A` leaves `R` on one road, and car `B` is 100km from `R` on the other road. Car `A` travels away from `R` at a speed of 80 km/h, and car `B` travels towards `R` at a speed of 50 km/h.

The distance between the cars at time `t` hours is `r` km.
--- 5 WORK AREA LINES (style=lined) ---
--- 7 WORK AREA LINES (style=lined) ---
Trout and carp are types of fish. A lake contains a number of trout. At a certain time, 10 carp are introduced into the lake and start eating the trout. As a consequence, the number of trout, `N`, decreases according to
`N=375-e^(0.04t)`,
where `t` is the time in months after the carp are introduced.
The population of carp, `P`, increases according to `(dP)/(dt)=0.02P`.
--- 2 WORK AREA LINES (style=lined) ---
--- 6 WORK AREA LINES (style=lined) ---
--- 6 WORK AREA LINES (style=lined) ---
--- 10 WORK AREA LINES (style=lined) ---
--- 8 WORK AREA LINES (style=lined) ---

i. `text(Carp introduced at)\ \ t=0`
`N=375-e^0=374`
`:.\ text(There was 374 trout when carp were introduced.)`
ii. `text(Trout population will be zero when)`
| `N` | `=375-e^(0.04t)=0` |
| `e^(0.04t)` | `=375` |
| `0.04t` | `=ln375` |
| `t` | `=ln375/0.04` |
| `=148.173 …` | |
| `=148\ text{months (nearest month)}` |
`:.\ text(After 148 months, the trout population will be zero.)`
| iii. | |
iv. `text(We need) \ |(dN)/(dt)|=(dP)/(dt)`
`text(Given)\ N=375-e^(0.04t)`
`(dN)/(dt)=-0.04e^(0.04t)`
`text(Find)\ P\ text(in terms of)\ t`
`text(Given)\ (dP)/(dt)=0.02P`
`=> P=Ae^(0.02t)`
`text(Find)\ A\ \ =>text(when)\ t=0,\ P=10`
| `10` | `=Ae^0` |
| `:.A` | `=10` |
| `=>P` | `=10xx0.02e^(0.02t)` |
| `=0.2e^(0.02t)` |
`text(Given that)\ \ (dP)/(dt)=|(dN)/(dt)|`
| `0.2e^(0.02t)` | `=0.04e^(0.04t)` |
| `5e^(0.02t)` | `=e^(0.04t)` |
| `e^(0.04t)/e^(0.02t)` | `=5` |
| `e^(0.04t-0.02t)` | `=5` |
| `lne^(0.02t)` | `=ln5` |
| `0.02t` | `=ln5` |
| `t` | `=ln5/0.02` |
| `=80.4719…` | |
| `=80\ text{months (nearest month)}` |
v. `text(Find)\ t\ text(when)\ N=P`
| `text(i.e.)\ \ 375-e^(0.04t)` | `=10e^(0.02t)` |
| `e^(0.04t)+10e^(0.02t)-375` | `=0` |
`text(Let)\ X=e^(0.02t),\ text(noting)\ \ X^2=(e^(0.02t))^2=e^(0.04t)`
| `:.\ X^2+10X-375` | `=0` |
| `(X-15)(X+25)` | `=0` |
`X=15\ \ text(or)\ \ –25`
`text(S)text(ince)\ X=e^(0.02t)`
| `e^(0.02t)` | `=15\ \ \ \ (e^(0.02t)>0)` |
| `lne^(0.02t)` | `=ln15` |
| `0.02t` | `=ln15` |
| `t` | `=ln15/0.02` |
| `=135.4025…` | |
| `=135\ text(months)` |
The velocity of a particle moving along the `x`-axis is given by
`v=8-8e^(-2t)`,
where `t` is the time in seconds and `x` is the displacement in metres.
--- 1 WORK AREA LINES (style=lined) ---
--- 2 WORK AREA LINES (style=lined) ---
--- 5 WORK AREA LINES (style=lined) ---
Find the value of this constant. (1 mark)
--- 2 WORK AREA LINES (style=lined) ---
--- 8 WORK AREA LINES (style=lined) ---
i. `text(Initial velocity when)\ \ t=0`
| `v` | `=8-8e^0` |
| `=0\ text(m/s)` | |
| `:.\ text(Particle is initially at rest.)` | |
ii. `a=d/(dt) (v)=-2xx-8e^(-2t)=16e^(-2t)`
`text(S)text(ince)\ e^(-2t)=1/e^(2t)>0\ text(for all)\ t`.
`=>\ a=16e^(-2t)=16/e^(2t)>0\ text(for all)\ t`.
`:.\ text(Acceleration is positive for all)\ \ t>0`.
iii. `text{S}text{ince the particle is initially at rest, and ALWAYS}`
`text{has a positive acceleration.`
`:.\ text(It moves in a positive direction for all)\ t`.
iv. `text(As)\ t->oo`, `e^(-2t)=1/e^(2t)->0`
`=>8/e^(2t)->0\ text(and)`
`=>v=8-8/e^(2t)->8\ text(m/s)`
`:.\ text(As)\ \ t->oo,\ text(velocity approaches 8 m/s.)`
| v. |
|
Peter retires with a lump sum of $100 000. The money is invested in a fund which pays interest each month at a rate of 6% per annum, and Peter receives a fixed monthly payment `$M` from the fund. Thus the amount left in the fund after the first monthly payment is `$(100\ 500-M)`.
--- 4 WORK AREA LINES (style=lined) ---
--- 6 WORK AREA LINES (style=lined) ---
--- 4 WORK AREA LINES (style=lined) ---
--- 8 WORK AREA LINES (style=lined) ---
--- 6 WORK AREA LINES (style=lined) ---
--- 5 WORK AREA LINES (style=lined) ---
--- 2 WORK AREA LINES (style=lined) ---
| i. |  |
| ii. `text(Area)` | `~~h/2[f(1)+2xxf(2)+f(3)]` |
| `~~1/2[0+2ln2+ln3]` | |
| `~~1/2[ln(2^2 xx3)]` | |
| `~~1/2ln12` | |
| `~~1.24\ \ text(u²)` `text{(to 2 d.p.)}` |
| iii. |  |
`text(The approximation is less because the sides)`
`text{of the trapezia lie below the concave down}`
`text{curve (see diagram).}`
Pat and Chandra are playing a game. They take turns throwing two dice. The game is won by the first player to throw a double six. Pat starts the game.
--- 2 WORK AREA LINES (style=lined) ---
--- 5 WORK AREA LINES (style=lined) ---
--- 5 WORK AREA LINES (style=lined) ---

