Trigonometry, 2ADV T1 2018 HSC 12a
A ship travels from Port A on a bearing of 050° for 320 km to Port B. It then travels on a bearing of 120° for 190 km to Port C.
- What is the size of `/_ ABC`? (1 mark)
--- 3 WORK AREA LINES (style=lined) ---
- What is the distance from Port A to Port C ? Answer to the nearest 10 kilometres. (2 marks)
--- 5 WORK AREA LINES (style=lined) ---
Algebra, STD2 A1 2018 HSC 28b
Solve the equation `(2x)/5 + 1 = (3x + 1)/2`, leaving your answer as a fraction. (3 marks)
--- 6 WORK AREA LINES (style=lined) ---
Statistics, STD2 S5 2018 HSC 27e
Joanna sits a Physics test and a Biology test.
- Joanna’s mark in the Physics test is 70. The mean mark for this test is 58 and the standard deviation is 8.
Calculate the `z`-score for Joanna’s mark in this test. (1 mark)
--- 2 WORK AREA LINES (style=lined) ---
- In the Biology test, the mean mark is 64 and the standard deviation is 10.
Joanna’s `z`-score is the same in both the Physics test and the Biology test.
What is her mark in the Biology test? (2 marks)
--- 4 WORK AREA LINES (style=lined) ---
Statistics, STD2 S1 2018 HSC 26e
A cumulative frequency table for a data set is shown.
\begin{array} {|c|c|}
\hline
\ \ \ \ \ \ \ \textit{Score}\ \ \ \ \ \ \ & \ \ \ \ \ \textit{Cumulative}\ \ \ \ \ \\ & \textit{frequency} \\
\hline
\rule{0pt}{2.5ex} \text{1} \rule[-1ex]{0pt}{0pt} & 5 \\
\hline
\rule{0pt}{2.5ex} \text{2} \rule[-1ex]{0pt}{0pt} & 9 \\
\hline
\rule{0pt}{2.5ex} \text{3} \rule[-1ex]{0pt}{0pt} & 16 \\
\hline
\rule{0pt}{2.5ex} \text{4} \rule[-1ex]{0pt}{0pt} & 20 \\
\hline
\rule{0pt}{2.5ex} \text{5} \rule[-1ex]{0pt}{0pt} & 34 \\
\hline
\rule{0pt}{2.5ex} \text{6} \rule[-1ex]{0pt}{0pt} & 42 \\
\hline
\end{array}
What is the interquartile range of this data set? (2 marks)
--- 4 WORK AREA LINES (style=lined) ---
Statistics, STD2 S1 2018 HSC 26d
The graph displays the mean monthly rainfall in Sydney and Perth.
- For how many months is the mean monthly rainfall higher in Perth than in Sydney? (1 mark)
--- 1 WORK AREA LINES (style=lined) ---
- For which of the two cities is the standard deviation of the mean monthly rainfall smaller? Justify your answer WITHOUT calculations. (1 mark)
--- 2 WORK AREA LINES (style=lined) ---
Financial Maths, STD2 F5 2018 HSC 26c
Ali made monthly deposits of $100 into an annuity for 5 years.
Calculate the total amount Ali deposited into the annuity over this period. (1 mark)
Probability, STD2 S2 2018 HSC 26a
Jeremy rolled a biased 6-sided die a number of times. He recorded the results in a table.
\begin{array} {|l|c|c|c|c|c|c|}
\hline
\rule{0pt}{2.5ex} \text{Number} \rule[-1ex]{0pt}{0pt} & \ \ 1 \ \ & \ \ 2 \ \ & \ \ 3 \ \ & \ \ 4 \ \ & \ \ 5 \ \ & \ \ 6 \ \ \\
\hline
\rule{0pt}{2.5ex} \text{Frequency} \rule[-1ex]{0pt}{0pt} & \ \ 23 \ \ & \ \ 19 \ \ & \ \ 48 \ \ & \ \ 20 \ \ & \ \ 21 \ \ & \ \ 19 \ \ \\
\hline
\end{array}
What is the relative frequency of rolling a 3? (1 mark)
--- 2 WORK AREA LINES (style=lined) ---
Functions, 2ADV F1 2018 HSC 3 MC
What is the `x`-intercept of the line `x + 3y + 6 = 0`?
- `(-6, 0)`
- `(6, 0)`
- `(0, -2)`
- `(0, 2)`
Statistics, STD2 S5 2018 HSC 23 MC
A set of data is normally distributed with a mean of 48 and a standard deviation of 3.
Approximately what percentage of the scores lies between 39 and 45?
- 15.85%
- 31.7%
- 47.5%
- 49.85%
Probability, STD2 S2 2018 HSC 20 MC
Financial Maths, STD2 F4 2018 HSC 19 MC
The table shows the compounded values of $1 at different interest rates over different periods.
Amy hopes to have $21 000 in 2 years to buy a car. She opens an account today which pays interest of 4% pa, compounded quarterly.
Using the table, which expression calculates the minimum single sum that Amy needs to invest today to ensure she reaches her savings goal?
- 21 000 × 1.0816
- 21 000 ÷ 1.0816
- 21 000 × 1.0829
- 21 000 ÷ 1.0829
Statistics, STD2 S1 2018 HSC 11 MC
Measurement, STD2 M6 2018 HSC 7 MC
Statistics, STD2 S1 2018 HSC 6 MC
Statistics, STD2 S1 2018 HSC 3 MC
A survey asked the following question.
'How many brothers do you have?'
How would the responses be classified?
- Categorical, ordinal
- Categorical, nominal
- Numerical, discrete
- Numerical, continuous
Statistics, STD2 S1 2018 HSC 1 MC
A set of scores has the following five-number summary.
lower extreme = 2
lower quartile = 5
median = 6
upper quartile = 8
upper extreme = 9
What is the range?
- 2
- 3
- 6
- 7
Functions, 2ADV F1 2017 HSC 1 MC
What is the gradient of the line `2x + 3y + 4 = 0`?
- `-2/3`
- `2/3`
- `-3/2`
- `3/2`
Measurement, STD2 M6 2017 HSC 30c
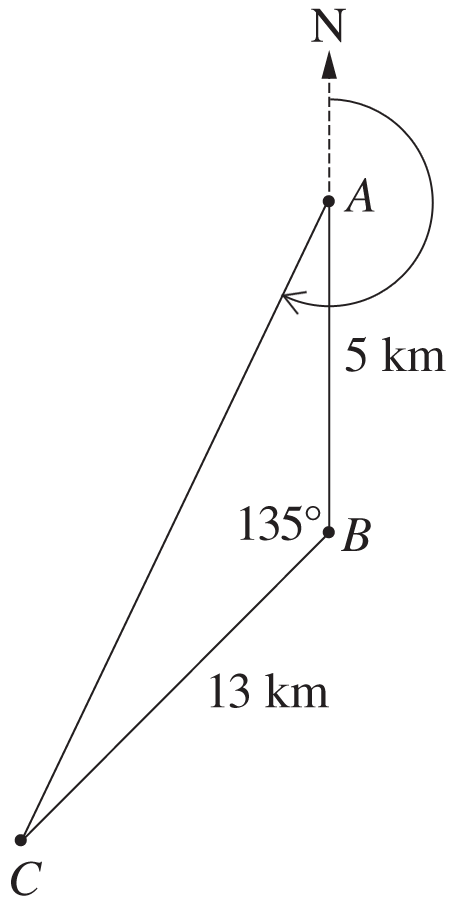
The diagram shows the location of three schools. School `A` is 5 km due north of school `B`, school `C` is 13 km from school `B` and `angleABC` is 135°.
- Calculate the shortest distance from school `A` to school `C`, to the nearest kilometre. (2 marks)
--- 4 WORK AREA LINES (style=lined) ---
- Determine the bearing of school `C` from school `A`, to the nearest degree. (3 marks)
--- 6 WORK AREA LINES (style=lined) ---
Statistics, STD2 S1 2017 HSC 30a
A set of data has a lower quartile (`Q_L`) of 10 and an upper quartile (`Q_U`) of 16.
What is the maximum possible range for this set of data if there are no outliers? (2 marks)
--- 4 WORK AREA LINES (style=lined) ---
Statistics, STD2 S5 2017 HSC 29d
All the students in a class of 30 did a test.
The marks, out of 10, are shown in the dot plot.
- Find the median test mark. (1 mark)
--- 1 WORK AREA LINES (style=lined) ---
- The mean test mark is 5.4. The standard deviation of the test marks is 4.22.
Using the dot plot, calculate the percentage of the marks which lie within one standard deviation of the mean. (2 marks)
--- 4 WORK AREA LINES (style=lined) ---
- A student states that for any data set, 68% of the scores should lie within one standard deviation of the mean. With reference to the dot plot, explain why the student’s statement is NOT relevant in this context. (1 mark)
--- 2 WORK AREA LINES (style=lined) ---
Probability, STD2 S2 2017 HSC 29c
A group of Year 12 students was surveyed. The students were asked whether they live in the city or the country. They were also asked if they have ever waterskied.
The results are recorded in the table.
- A person is selected at random from the group surveyed. Calculate the probability that the person lives in the city and has never waterskied. (2 marks)
--- 4 WORK AREA LINES (style=lined) ---
- A newspaper article claimed that Year 12 students who live in the country are more likely to have waterskied than those who live in the city.
Is this true, based on the survey results? Justify your answer with relevant calculations. (2 marks)
--- 4 WORK AREA LINES (style=lined) ---
Financial Maths, STD2 F5 2017 HSC 27c
A table of future value interest factors for an annuity of $1 is shown.
An annuity involves contributions of $12 000 per annum for 5 years. The interest rate is 4% per annum, compounded annually.
- Calculate the future value of this annuity. (1 mark)
--- 1 WORK AREA LINES (style=lined) ---
- Calculate the interest earned on this annuity. (1 mark)
--- 1 WORK AREA LINES (style=lined) ---
Statistics, STD2 S1 2017 HSC 27a
Jamal surveyed eight households in his street. He asked them how many kilolitres (kL) of water they used in the last year. Here are the results.
`220, 105, 101, 450, 37, 338, 151, 205`
- Calculate the mean of this set of data. (1 mark)
--- 1 WORK AREA LINES (style=lined) ---
- What is the standard deviation of this set of data, correct to one decimal place? (1 mark)
--- 1 WORK AREA LINES (style=lined) ---
Statistics, STD2 S5 2017 HSC 13 MC
The heights of Year 12 girls are normally distributed with a mean of 165 cm and a standard deviation of 5.5 cm.
What is the `z`-score for a height of 154 cm?
A. `−2`
B. `−0.5`
C. `0.5`
D. `2`
Statistics, STD2 S4 2017 HSC 12 MC
Financial Maths, STD2 F4 2017 HSC 10 MC
A single amount of $10 000 is invested for 4 years, earning interest at the rate of 3% per annum, compounded monthly.
Which expression will give the future value of the investment?
- `10\ 000 xx (1 + 0.03)^4`
- `10\ 000 xx (1 + 0.03)^48`
- `10\ 000 xx (1 + 0.03/12)^4`
- `10\ 000 xx (1 + 0.03/12)^48`
Algebra, STD2 A1 2017 HSC 9 MC
What is the value of `x` in the equation `(5-x)/3 = 6`?
- `-13`
- `-3`
- `3`
- `13`
Statistics, STD2 S1 2017 HSC 4 MC
A factory’s quality control department has tested every 50th item produced for possible defects.
What type of sampling has been used?
A. Random
B. Stratified
C. Systematic
D. Numerical
Probability, STD2 S2 2017 HSC 5 MC
In a survey of 200 randomly selected Year 12 students it was found that 180 use social media.
Based on this survey, approximately how many of 75 000 Year 12 students would be expected to use social media?
A. 60 000
B. 67 500
C. 74 980
D. 75 000
Algebra, STD2 A2 2017 HSC 3 MC
Statistics, STD2 S1 2017 HSC 1 MC
Algebra, STD2 A2 2016 HSC 29e
The graph shows the life expectancy of people born between 1900 and 2000.
- According to the graph, what is the life expectancy of a person born in 1932? (1 mark)
--- 1 WORK AREA LINES (style=lined) ---
- With reference to the value of the gradient, explain the meaning of the gradient in this context. (2 marks)
--- 4 WORK AREA LINES (style=lined) ---
Statistics, STD2 S1 2016 HSC 29c
The ages of members of a dance class are shown in the back-to-back stem-and-leaf plot.
Pat claims that the women who attend the dance class are generally older than the men.
Is Pat correct? Justify your answer by referring to the median and skewness of the two sets of data. (3 marks)
--- 6 WORK AREA LINES (style=lined) ---
Algebra, STD2 A4 2016 HSC 29b
The mass `M` kg of a baby pig at age `x` days is given by `M = A(1.1)^x` where `A` is a constant. The graph of this equation is shown.
- What is the value of `A`? (1 mark)
--- 1 WORK AREA LINES (style=lined) ---
- What is the daily growth rate of the pig’s mass? Write your answer as a percentage. (1 mark)
--- 2 WORK AREA LINES (style=lined) ---
Financial Maths, STD2 F5 2016 HSC 28d
The table gives the contribution per period for an annuity with a future value of $1 at different interest rates and different periods of time.
Margaret needs to save $75 000 over 6 years for a deposit on a new apartment. She makes regular quarterly contributions into an investment account which pays interest at 3% pa.
How much will Margaret need to contribute each quarter to reach her savings goal? (2 marks)
--- 4 WORK AREA LINES (style=lined) ---
Statistics, STD2 S1 2016 HSC 27c
Statistics, STD2 S1 2016 HSC 27b
A small population consists of three students of heights 153 cm, 168 cm and 174 cm. Samples of varying sizes can be taken from this population.
What is the mean of the mean heights of all the possible samples? Justify your answer. (2 marks)
--- 4 WORK AREA LINES (style=lined) ---
Measurement, STD2 M6 2016 HSC 25 MC
Probability, STD2 S2 2016 HSC 23 MC
Statistics, STD2 S1 2016 HSC 22 MC
Statistics, STD2 S1 2016 HSC 21 MC
A grouped data frequency table is shown.
\begin{array} {|c|c|}
\hline
\rule{0pt}{2.5ex} \textit{Class Interval} \rule[-1ex]{0pt}{0pt} & \ \ \ \ \ \textit{Frequency}\ \ \ \ \ \\
\hline
\rule{0pt}{2.5ex} \text{1 – 5} \rule[-1ex]{0pt}{0pt} & 3 \\
\hline
\rule{0pt}{2.5ex} \text{6 – 10} \rule[-1ex]{0pt}{0pt} & 6 \\
\hline
\rule{0pt}{2.5ex} \text{11 – 15} \rule[-1ex]{0pt}{0pt} & 8 \\
\hline
\rule{0pt}{2.5ex} \text{16 – 20} \rule[-1ex]{0pt}{0pt} & 9 \\
\hline
\end{array}
What is the mean for this set of data?
- 6.5
- 10.5
- 11.9
- 12.4
Statistics, STD2 S1 2016 HSC 19 MC
A soccer referee wrote down the number of goals scored in 9 different games during the season.
`2, \ 3, \ 3, \ 3, \ 5, \ 5, \ 8, \ 9, \ ...`
The last number has been omitted. The range of the data is 10.
What is the five-number summary for this data set?
- `2, 3, 5, 8.5, 12`
- `2, 3, 5, 8.5, 10`
- `2, 3, 5, 8, 12`
- `2, 3, 5, 8, 10`
Statistics, STD2 S5 2016 HSC 13 MC
The speed limit outside a school is 40 km/h. Year 11 students measured the speed of passing vehicles over a period of time. They found the set of data to be normally distributed with a mean speed of 36 km/h and a standard deviation of 2 km/h.
What percentage of the vehicles passed the school at a speed greater than 40 km/h?
- `text(2.5%)`
- `text(5%)`
- `text(47.5%)`
- `text(95%)`
Financial Maths, STD2 F4 2016 HSC 8 MC
Statistics, STD2 S1 2016 HSC 7 MC
Which set of data is classified as categorical and nominal?
- blue, green, yellow
- small, medium, large
- 5.2 cm, 6 cm, 7.21 cm
- 4 people, 5 people, 9 people
Statistics, STD2 S4 2016 HSC 3 MC
Statistics, STD2 S5 SM-Bank 2 MC
The pulse rates of a large group of 18-year-old students are approximately normally distributed with a mean of 75 beats/minute and a standard deviation of 11 beats/minute.
The percentage of 18-year-old students with pulse rates less than 53 beats/minute or greater than 86 beats/minute is closest to
- `2.5text(%)`
- `5text(%)`
- `16text(%)`
- `18.5text(%)`
Statistics, STD2 S5 SM-Bank 1 MC
The head circumference (in cm) of a population of infant boys is normally distributed with a mean of 49.5 cm and a standard deviation of 1.5 cm.
Four hundred of these boys are selected at random and each boy’s head circumference is measured.
The number of these boys with a head circumference of less than 48.0 cm is closest to
- `3`
- `10`
- `64`
- `272`
Algebra, STD2 A1 SM-Bank 13
If `(y-3)/3 =5`, find `y`. (1 mark)
Algebra, STD2 A1 SM-Bank 3
Find the value of `r` given `r/7-4 = 3`. (1 mark)
Financial Maths, STD2 F5 2015 HSC 30c
The table gives the present value interest factors for an annuity of $1 per period, for various interest rates `(r)` and numbers of periods `(N)`.
- Oscar plans to invest $200 each month for 74 months. His investment will earn interest at the rate of 0.0080 (as a decimal) per month.
Use the information in the table to calculate the present value of this annuity. (1 mark)
--- 2 WORK AREA LINES (style=lined) ---
- Lucy is using the same table to calculate the loan repayment for her car loan. Her loan is `$21\ 500` and will be repaid in equal monthly repayments over 6 years. The interest rate on her loan is 10.8% per annum.
Calculate the amount of each monthly repayment, correct to the nearest dollar. (2 marks)
--- 4 WORK AREA LINES (style=lined) ---
Statistics, STD2 S1 2015 HSC 29d
Data from 200 recent house sales are grouped into class intervals and a cumulative frequency histogram is drawn.
- Use the graph to estimate the median house price. (1 mark)
--- 1 WORK AREA LINES (style=lined) ---
- By completing the table, calculate the mean house price. (3 marks)
\begin{array} {|c|c|}
\hline
\rule{0pt}{2.5ex} \text{Class Centre} \rule[-1ex]{0pt}{0pt} & \text{Frequency} \\ \text{(\$'000)} & \\
\hline
\rule{0pt}{2.5ex} \rule[-1ex]{0pt}{0pt} & \\
\hline
\rule{0pt}{2.5ex} \rule[-1ex]{0pt}{0pt} & \\
\hline
\rule{0pt}{2.5ex} \rule[-1ex]{0pt}{0pt} & \\
\hline
\rule{0pt}{2.5ex} \rule[-1ex]{0pt}{0pt} & \\
\hline
\end{array}
--- 2 WORK AREA LINES (style=lined) ---
Statistics, STD2 S4 2015 HSC 28e
The shoe size and height of ten students were recorded.
\begin{array} {|l|c|c|}
\hline \rule{0pt}{2.5ex} \text{Shoe size} \rule[-1ex]{0pt}{0pt} & \text{6} & \text{7} & \text{7} & \text{8} & \text{8.5} & \text{9.5} & \text{10} & \text{11} & \text{12} & \text{12} \\
\hline \rule{0pt}{2.5ex} \text{Height} \rule[-1ex]{0pt}{0pt} & \text{155} & \text{150} & \text{165} & \text{175} & \text{170} & \text{170} & \text{190} & \text{185} & \text{200} & \text{195} \\
\hline
\end{array}
- Complete the scatter plot AND draw a line of fit by eye. (2 marks)
- Use the line of fit to estimate the height difference between a student who wears a size 7.5 shoe and one who wears a size 9 shoe. (1 mark)
--- 1 WORK AREA LINES (style=lined) ---
- A student calculated the correlation coefficient to be 1 for this set of data. Explain why this cannot be correct. (1 mark)
--- 2 WORK AREA LINES (style=lined) ---
Statistics, STD2 S5 2015 HSC 28b
The results of two tests are normally distributed. The mean and standard deviation for each test are displayed in the table.
Kristoff scored 74 in Mathematics and 80 in English. He claims that he has performed better in English.
Is Kristoff correct? Justify your answer using appropriate calculations. (2 marks)
--- 4 WORK AREA LINES (style=lined) ---
Statistics, STD2 S1 2015 HSC 27d
In a small business, the seven employees earn the following wages per week:
\(\$300, \ \$490, \ \$520, \ \$590, \ \$660, \ \$680, \ \$970\)
- Is the wage of $970 an outlier for this set of data? Justify your answer with calculations. (3 marks)
--- 6 WORK AREA LINES (style=lined) ---
- Each employee receives a $20 pay increase.
What effect will this have on the standard deviation? (1 mark)
--- 2 WORK AREA LINES (style=lined) ---
Algebra, STD2 A2 2015 HSC 27c
Ariana’s parents have given her an interest‑free loan of $4800 to buy a car. She will pay them back by paying `$x` immediately and `$y` every month until she has repaid the loan in full.
After 18 months Ariana has paid back $1510, and after 36 months she has paid back $2770.
This information can be represented by the following equations.
`x + 18y = 1510`
`x + 36y = 2770`
Probability, STD2 S2 2015 HSC 26e
The table shows the relative frequency of selecting each of the different coloured jelly beans from packets containing green, yellow, black, red and white jelly beans.
\begin{array} {|c|c|}
\hline
\rule{0pt}{2.5ex} \textit{Colour} \rule[-1ex]{0pt}{0pt} & \textit{Relative frequency} \\
\hline
\rule{0pt}{2.5ex} \text{Green} \rule[-1ex]{0pt}{0pt} & 0.32 \\
\hline
\rule{0pt}{2.5ex} \text{Yellow} \rule[-1ex]{0pt}{0pt} & 0.13 \\
\hline
\rule{0pt}{2.5ex} \text{Black} \rule[-1ex]{0pt}{0pt} & 0.14 \\
\hline
\rule{0pt}{2.5ex} \text{Red} \rule[-1ex]{0pt}{0pt} & \\
\hline
\rule{0pt}{2.5ex} \text{White} \rule[-1ex]{0pt}{0pt} & 0.24 \\
\hline
\end{array}
- What is the relative frequency of selecting a red jelly bean? (1 mark)
--- 2 WORK AREA LINES (style=lined) ---
- Based on this table of relative frequencies, what is the probability of NOT selecting a black jelly bean? (1 mark)
--- 2 WORK AREA LINES (style=lined) ---
Financial Maths, STD2 F4 2015 HSC 26d
A family currently pays $320 for some groceries.
Assuming a constant annual inflation rate of 2.9%, calculate how much would be paid for the same groceries in 5 years’ time. (2 marks)
Algebra, STD2 A1 2015 HSC 24 MC
Consider the equation `(2x)/3-4 = (5x)/2 + 1`.
Which of the following would be a correct step in solving this equation?
- `(2x)/3-3 = (5x)/2`
- `(2x)/3 = (5x)/2 + 5`
- `2x-4 = (15x)/2 + 3`
- `(4x)/6-8 = 5x + 2`