A random variable is normally distributed with mean 0 and standard deviation 1. The table gives the probability that this random variable lies between 0 and `z` for different values of `z`.
\begin{array} {|c|c|c|c|c|c|c|}
\hline
\rule{0pt}{2.5ex} z \rule[-1ex]{0pt}{0pt} & 0.1 & 0.2 & 0.3 & 0.4 & 0.5 & 0.6 \\
\hline
\rule{0pt}{2.5ex} \text{Probability} \rule[-1ex]{0pt}{0pt} & 0.0398 & 0.0793 & 0.1179 & 0.1554 & 0.1915 & 0.2257 \\
\hline
\end{array}
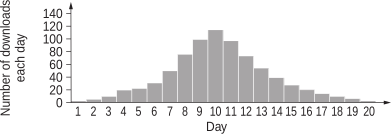
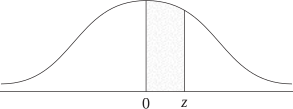
The probability values given in the table for different values of `z` are represented by the shaded area in the following diagram.
- Using the table, find the probability that a value from a random variable that is normally distributed with a mean of 0 and standard deviation 1 lies between 0.1 and 0.5. (1 mark)
--- 1 WORK AREA LINES (style=lined) ---
- Birth weights are normally distributed with a mean of 3300 grams and a standard deviation of 570 grams. By first calculating a `z`-score, find how many babies, out of 1000 born, are expected to have a birth weight greater than 3528 grams. (3 marks)
--- 6 WORK AREA LINES (style=lined) ---