- Show that `int sin^3 x\ dx = 1/3 cos^3 x - cos x + C.` (1 mark)
- Using a graphical approach, or otherwise, explain why
`int_0^pi cos^(2n - 1) x\ dx = 0`, for all positive integers `n.` (1 mark)
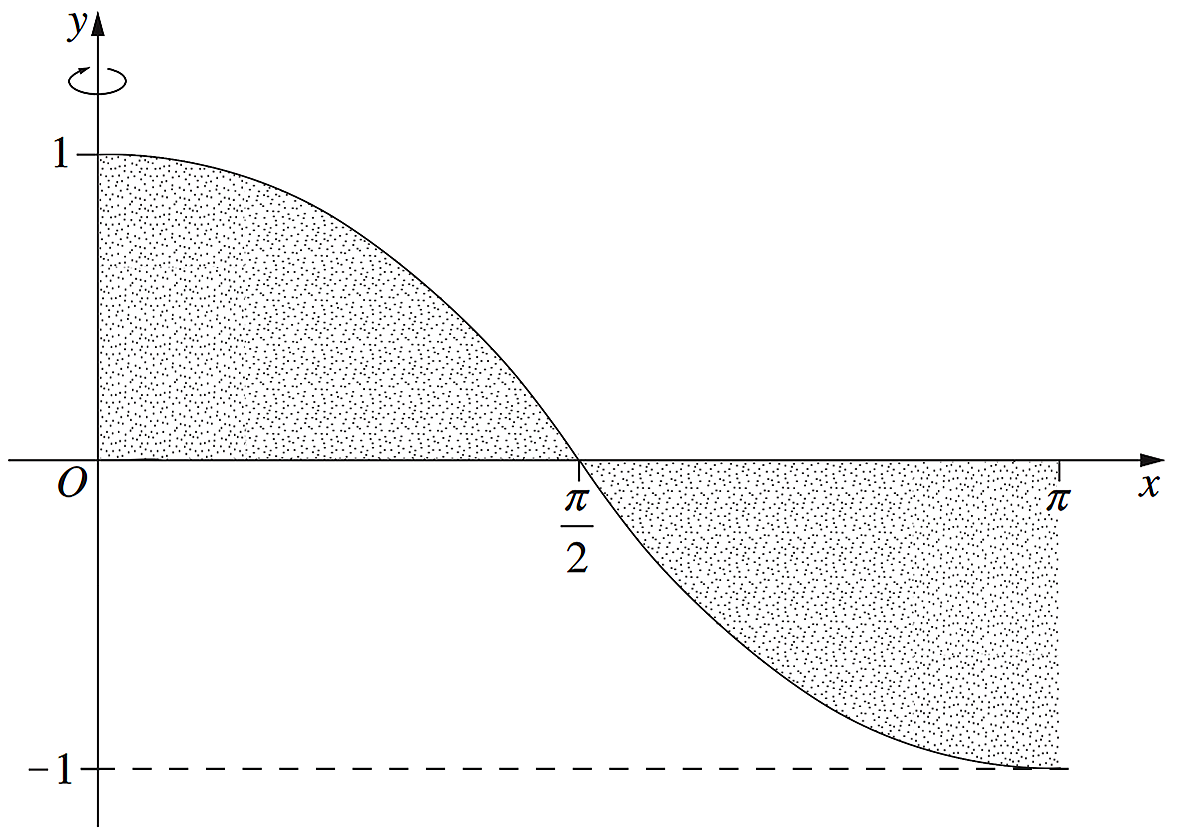
- The diagram shows the region `R` enclosed by `y = sin^3 x` and the `x`-axis for `0 <= x <= pi.`
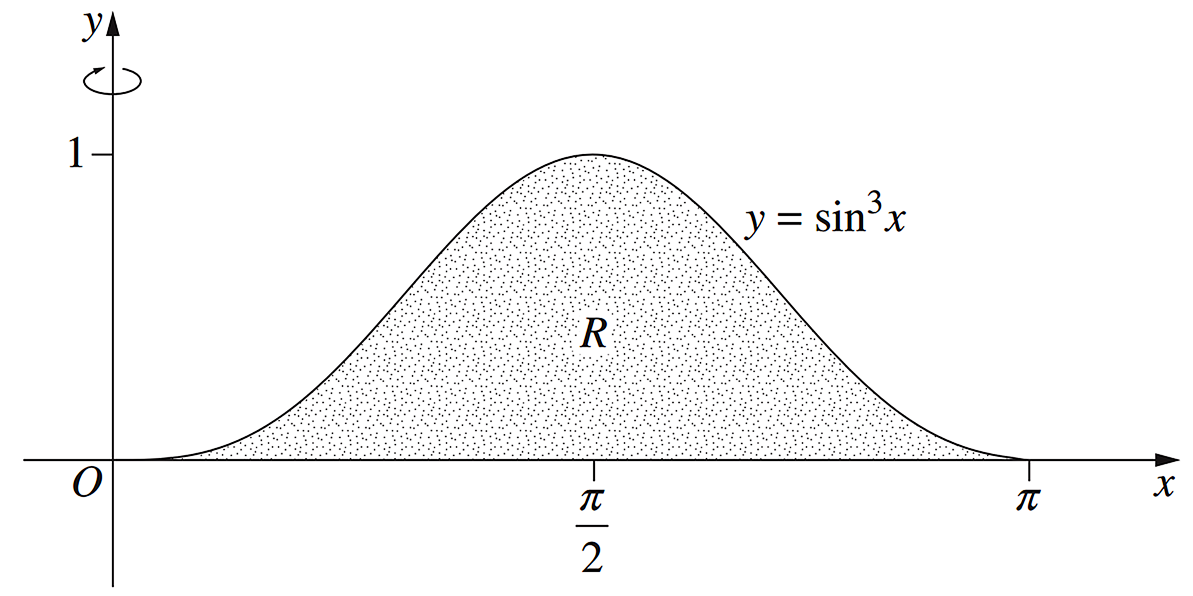
Using the method of cylindrical shells and the results in parts (i) and (ii), find the exact volume of the solid formed when `R` is rotated about the `y`-axis. (3 marks)
Functions, 2ADV F1 2016 HSC 12a*
The diagram shows points `A(1, 0), B(2, 4)` and `C(6, 1).` The point `D` lies on `BC` such that `AD _|_ BC.`
- Show that the equation of `BC` is `3x + 4y-22 = 0`. (2 marks)
--- 6 WORK AREA LINES (style=lined) ---
- Determine the gradient of `AD`. (1 mark)
--- 3 WORK AREA LINES (style=lined) ---
--- 5 WORK AREA LINES (style=lined) ---
Conics, EXT2 2016 HSC 12d
- Show that the equation of the normal to the hyperbola `xy = c^2,\ \ c != 0`, at `P (cp, c/p)` is given by `px - y/p = c (p^2 - 1/p^2).` (2 marks)
- The normal at `P` meets the hyperbola again at `Q (cq, c/q).`
Show that `q = -1/p^3.` (3 marks)
Complex Numbers, EXT2 N2 2016 HSC 12c
Let `z = cos theta + i sin theta.`
- By considering the real part of `z^4`, show that `cos 4 theta` is
- `qquad cos^4 theta-6 cos^2 theta sin^2 theta + sin^4 theta.` (2 marks)
- Hence, or otherwise, find an expression for `cos 4 theta` involving only powers of `cos theta.` (1 mark)
--- 3 WORK AREA LINES (style=lined) ---
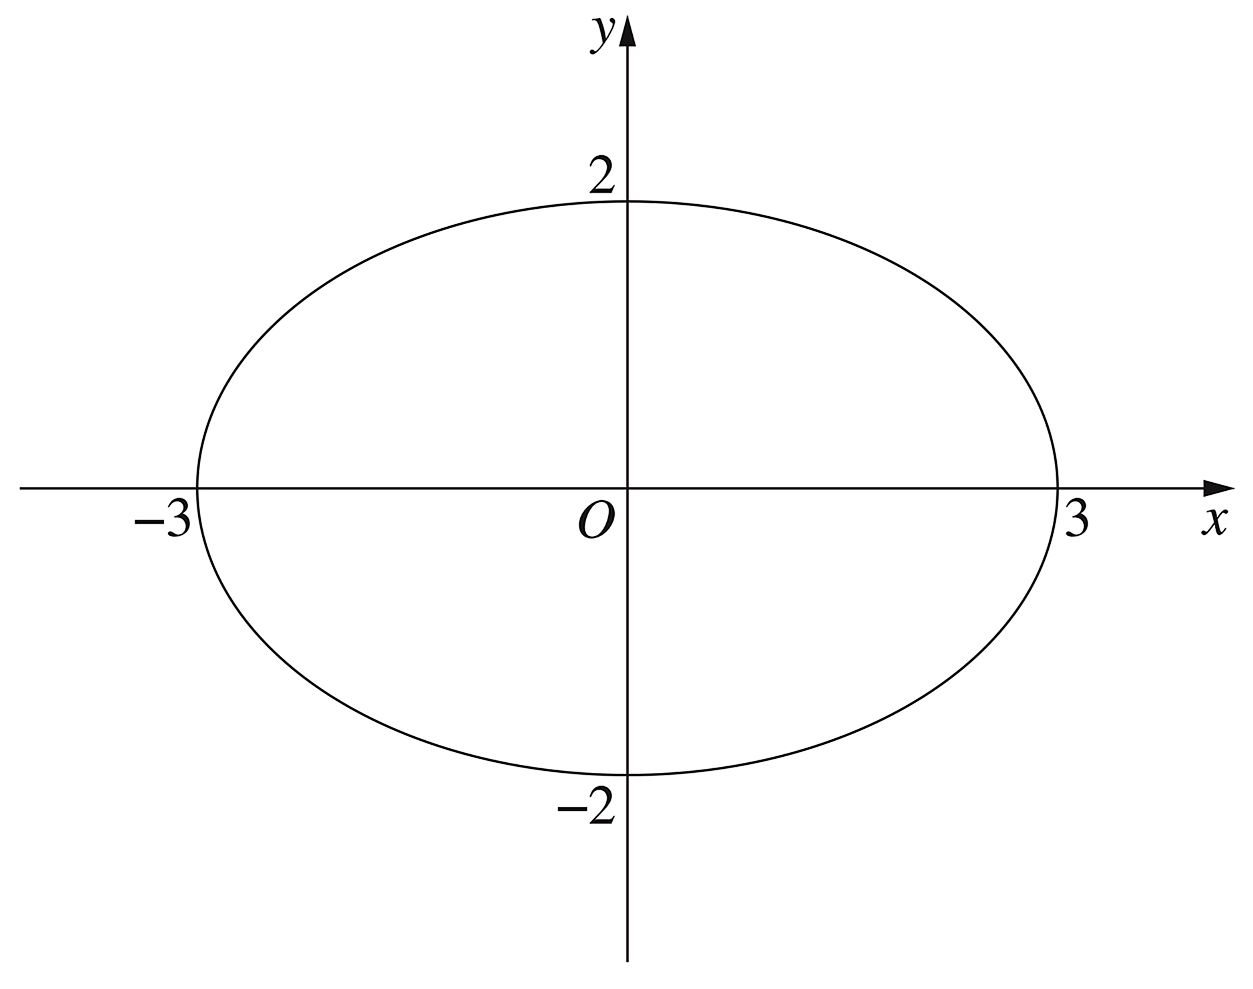
Conics, EXT2 2016 HSC 12a
Graphs, EXT2 2016 HSC 11c
Find `(dy)/(dx)` for the curve given by `x^3 + y^3 = 2xy`, leaving your answer in terms of `x` and `y.` (2 marks)
Complex Numbers, EXT2 N1 2016 HSC 11a
Let `z = sqrt 3 - i.`
- Express `z` in modulus-argument form. (2 marks)
--- 5 WORK AREA LINES (style=lined) ---
- Show that `z^6` is real. (1 mark)
--- 2 WORK AREA LINES (style=lined) ---
- Find a positive integer `n` such that `z^n` is purely imaginary. (1 mark)
--- 5 WORK AREA LINES (style=lined) ---
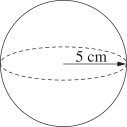
Measurement, STD2 M1 2016 HSC 26a
Algebra, STD2 A1 2016 HSC 2 MC
Which of the following equations has `x = 5` as the solution?
- `x - 5 = 10`
- `5 - x = 10`
- `x/2 = 10`
- `2x = 10`
Calculus, 2ADV C1 2016 HSC 11b
Differentiate `(x + 2)/(3x-4).` (2 marks)
--- 5 WORK AREA LINES (style=lined) ---
Functions, MET1 2006 VCAA 4
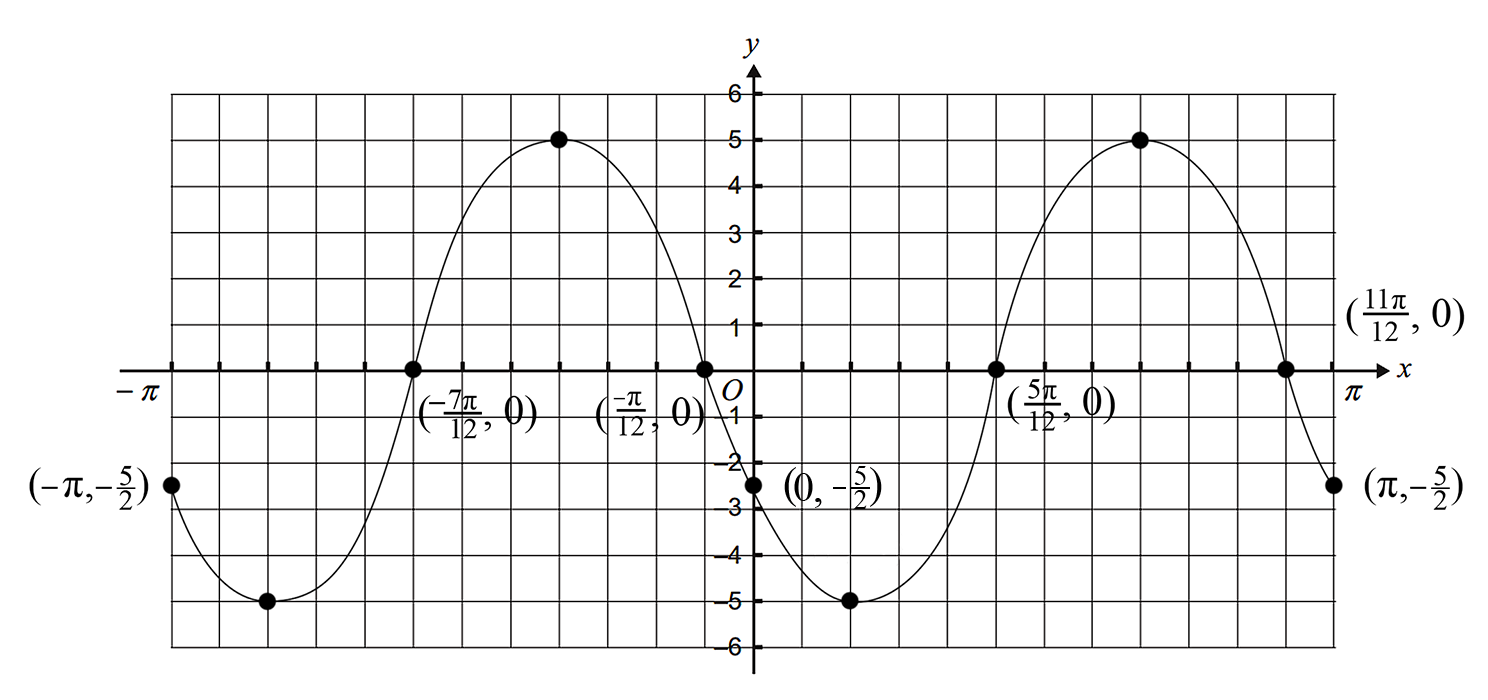
For the function `f: [-pi, pi] -> R, f(x) = 5 cos (2 (x + pi/3))`
- write down the amplitude and period of the function. (2 marks)
--- 2 WORK AREA LINES (style=lined) ---
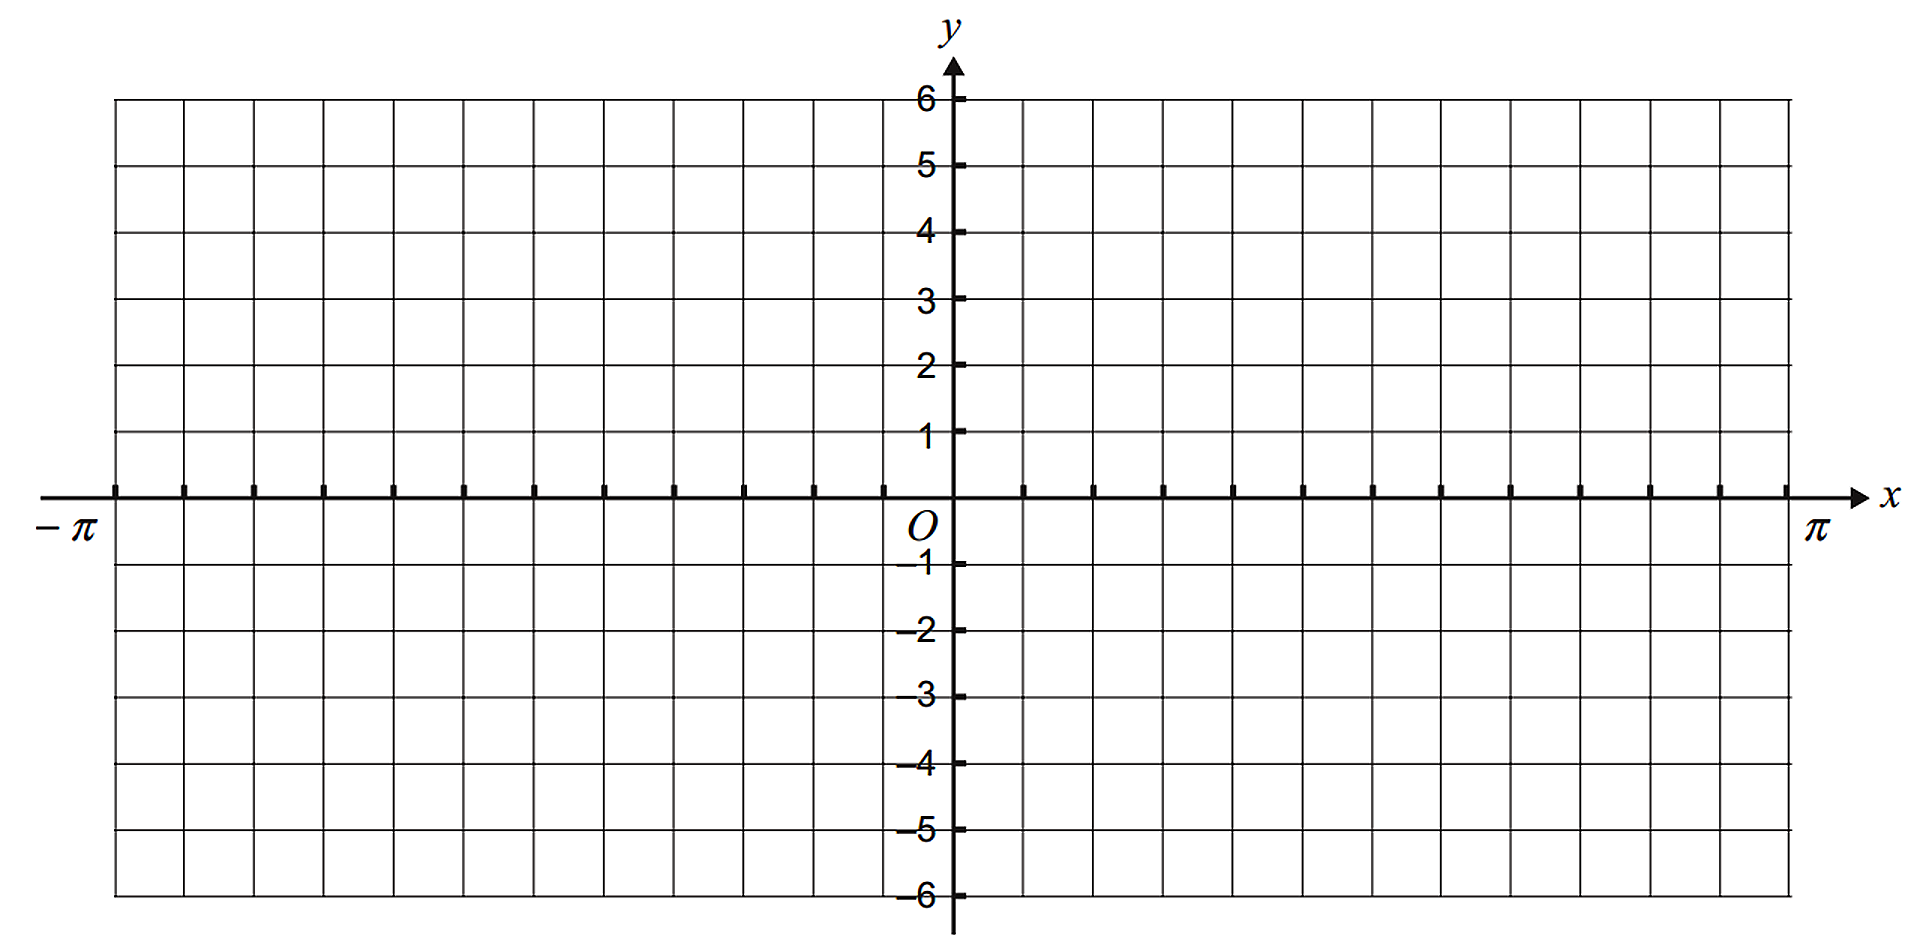
- sketch the graph of the function `f` on the set of axes below. Label axes intercepts with their coordinates.
Label endpoints of the graph with their coordinates. (3 marks)
--- 3 WORK AREA LINES (style=lined) ---
Functions, MET1 2006 VCAA 1
Let `f(x) = x^2 + 1 and g(x) = 2x + 1.` Write down the rule of `f(g(x)).` (1 mark)
Calculus, MET1 2014 VCAA 1a
If `y = x^2sin(x)`, find `(dy)/(dx)`. (2 marks)
--- 3 WORK AREA LINES (style=lined) ---
CORE*, FUR2 2007 VCAA 1
Khan wants to buy some office furniture that is valued at $7000. --- 2 WORK AREA LINES (style=lined) --- --- 2 WORK AREA LINES (style=lined) --- Another store offers the same $7000 office furniture for $500 deposit and 36 monthly instalments of $220. --- 2 WORK AREA LINES (style=lined) --- --- 5 WORK AREA LINES (style=lined) --- A third store has the office furniture marked at $7000 but will give 15% discount if payment is made in cash at the time of sale. --- 3 WORK AREA LINES (style=lined) ---
GRAPHS, FUR2 2007 VCAA 1
The Goldsmith family are going on a driving holiday in Western Australia.
On the first day, they leave home at 8 am and drive to Watheroo then Geraldton.
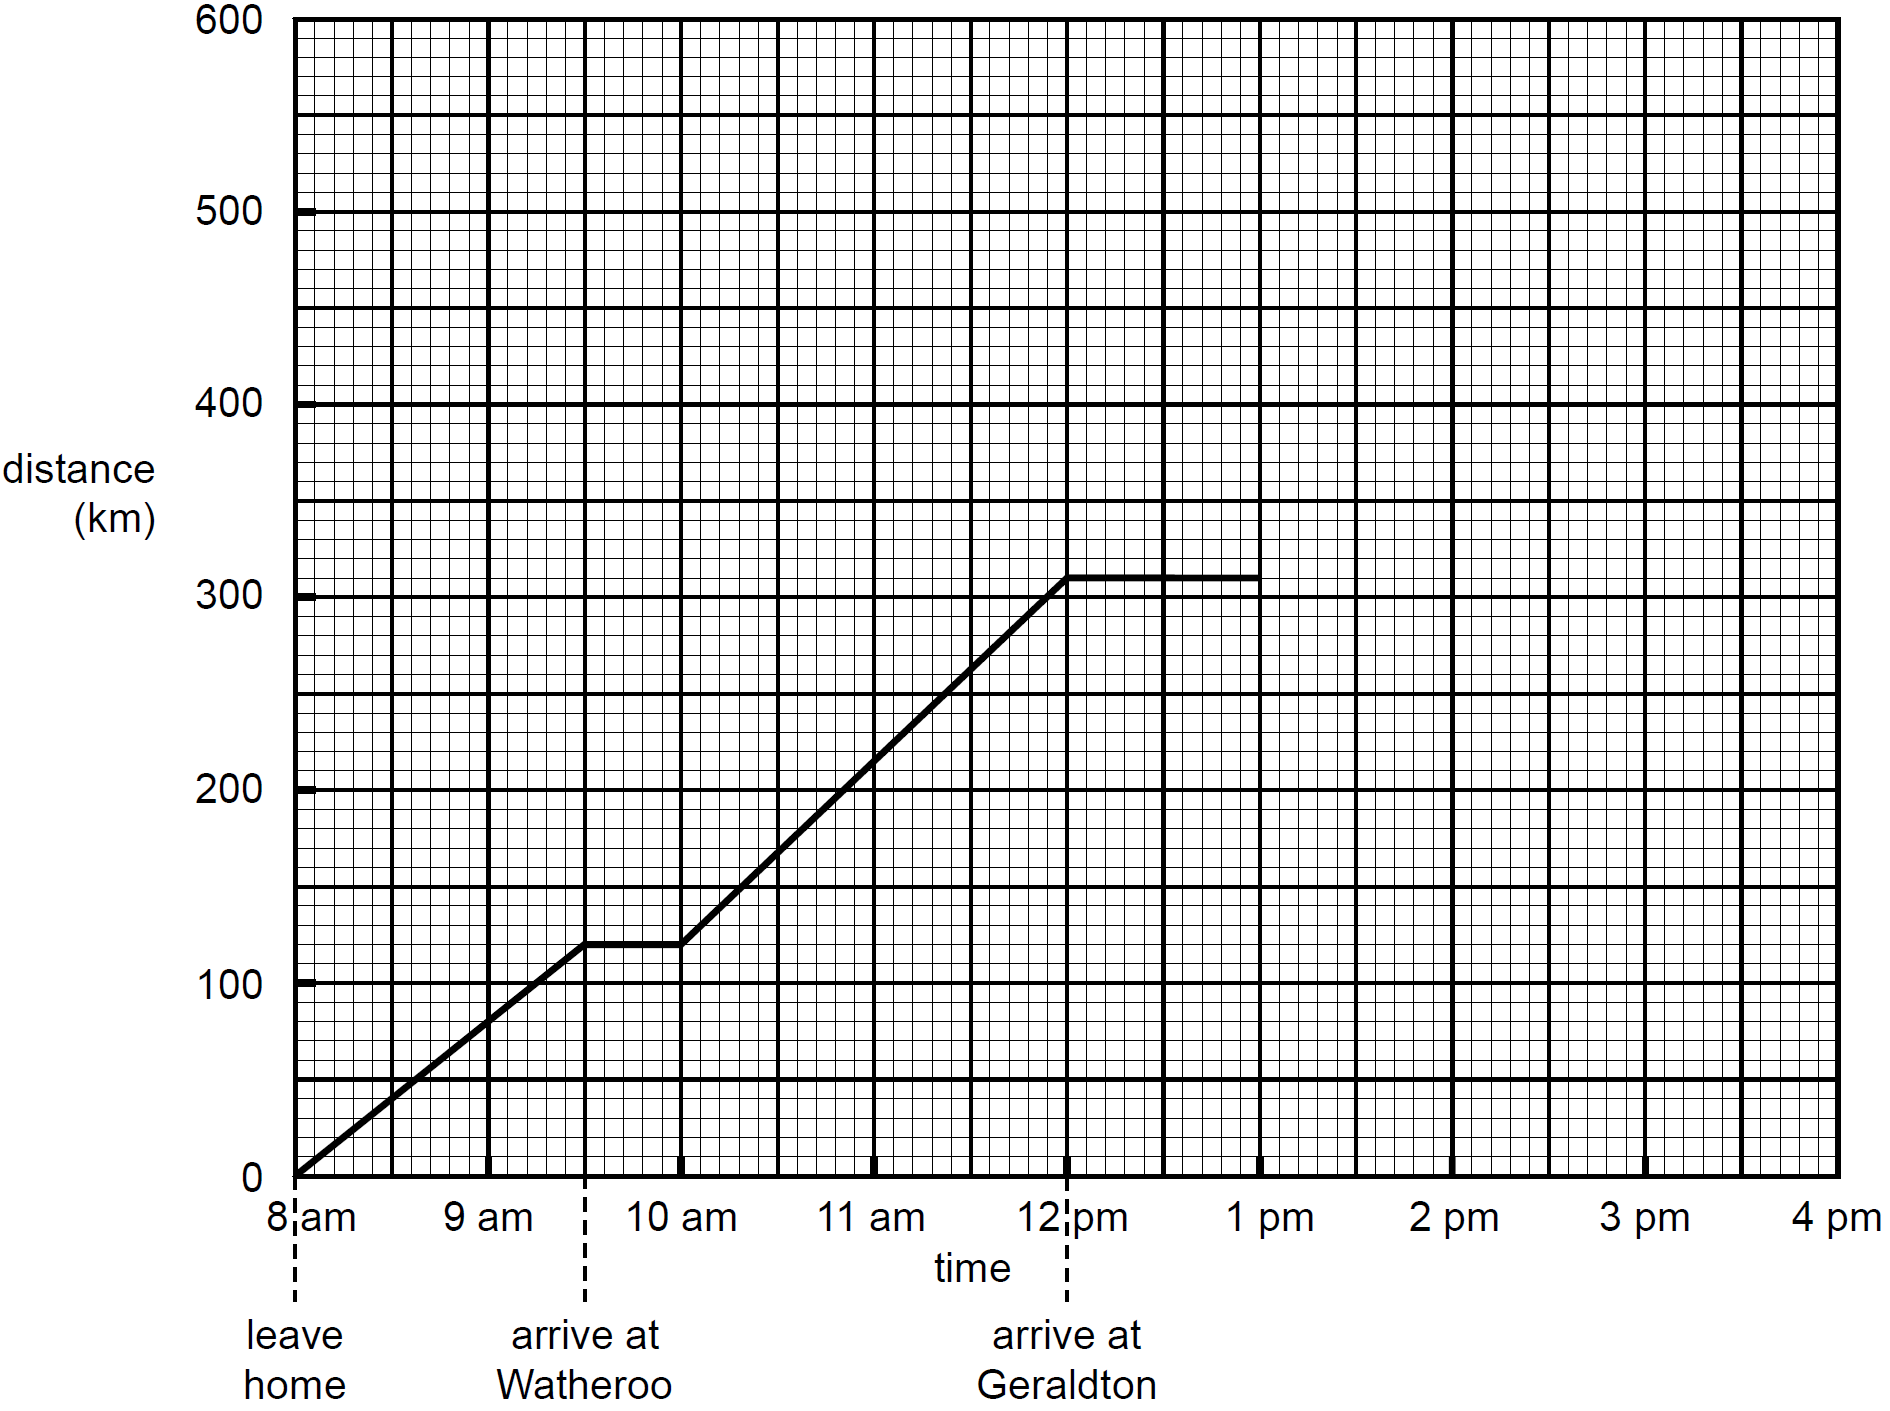
The distance–time graph below shows their journey to Geraldton.
At 9.30 am the Goldsmiths arrive at Watheroo.
They stop for a period of time.
- For how many minutes did they stop at Watheroo? (1 mark)
After leaving Watheroo, the Goldsmiths continue their journey and arrive in Geraldton at 12 pm.
- What distance (in kilometres) do they travel between Watheroo and Geraldton? (1 mark)
- Calculate the Goldsmiths' average speed (in km/h) when travelling between Watheroo and Geraldton. (1 mark)
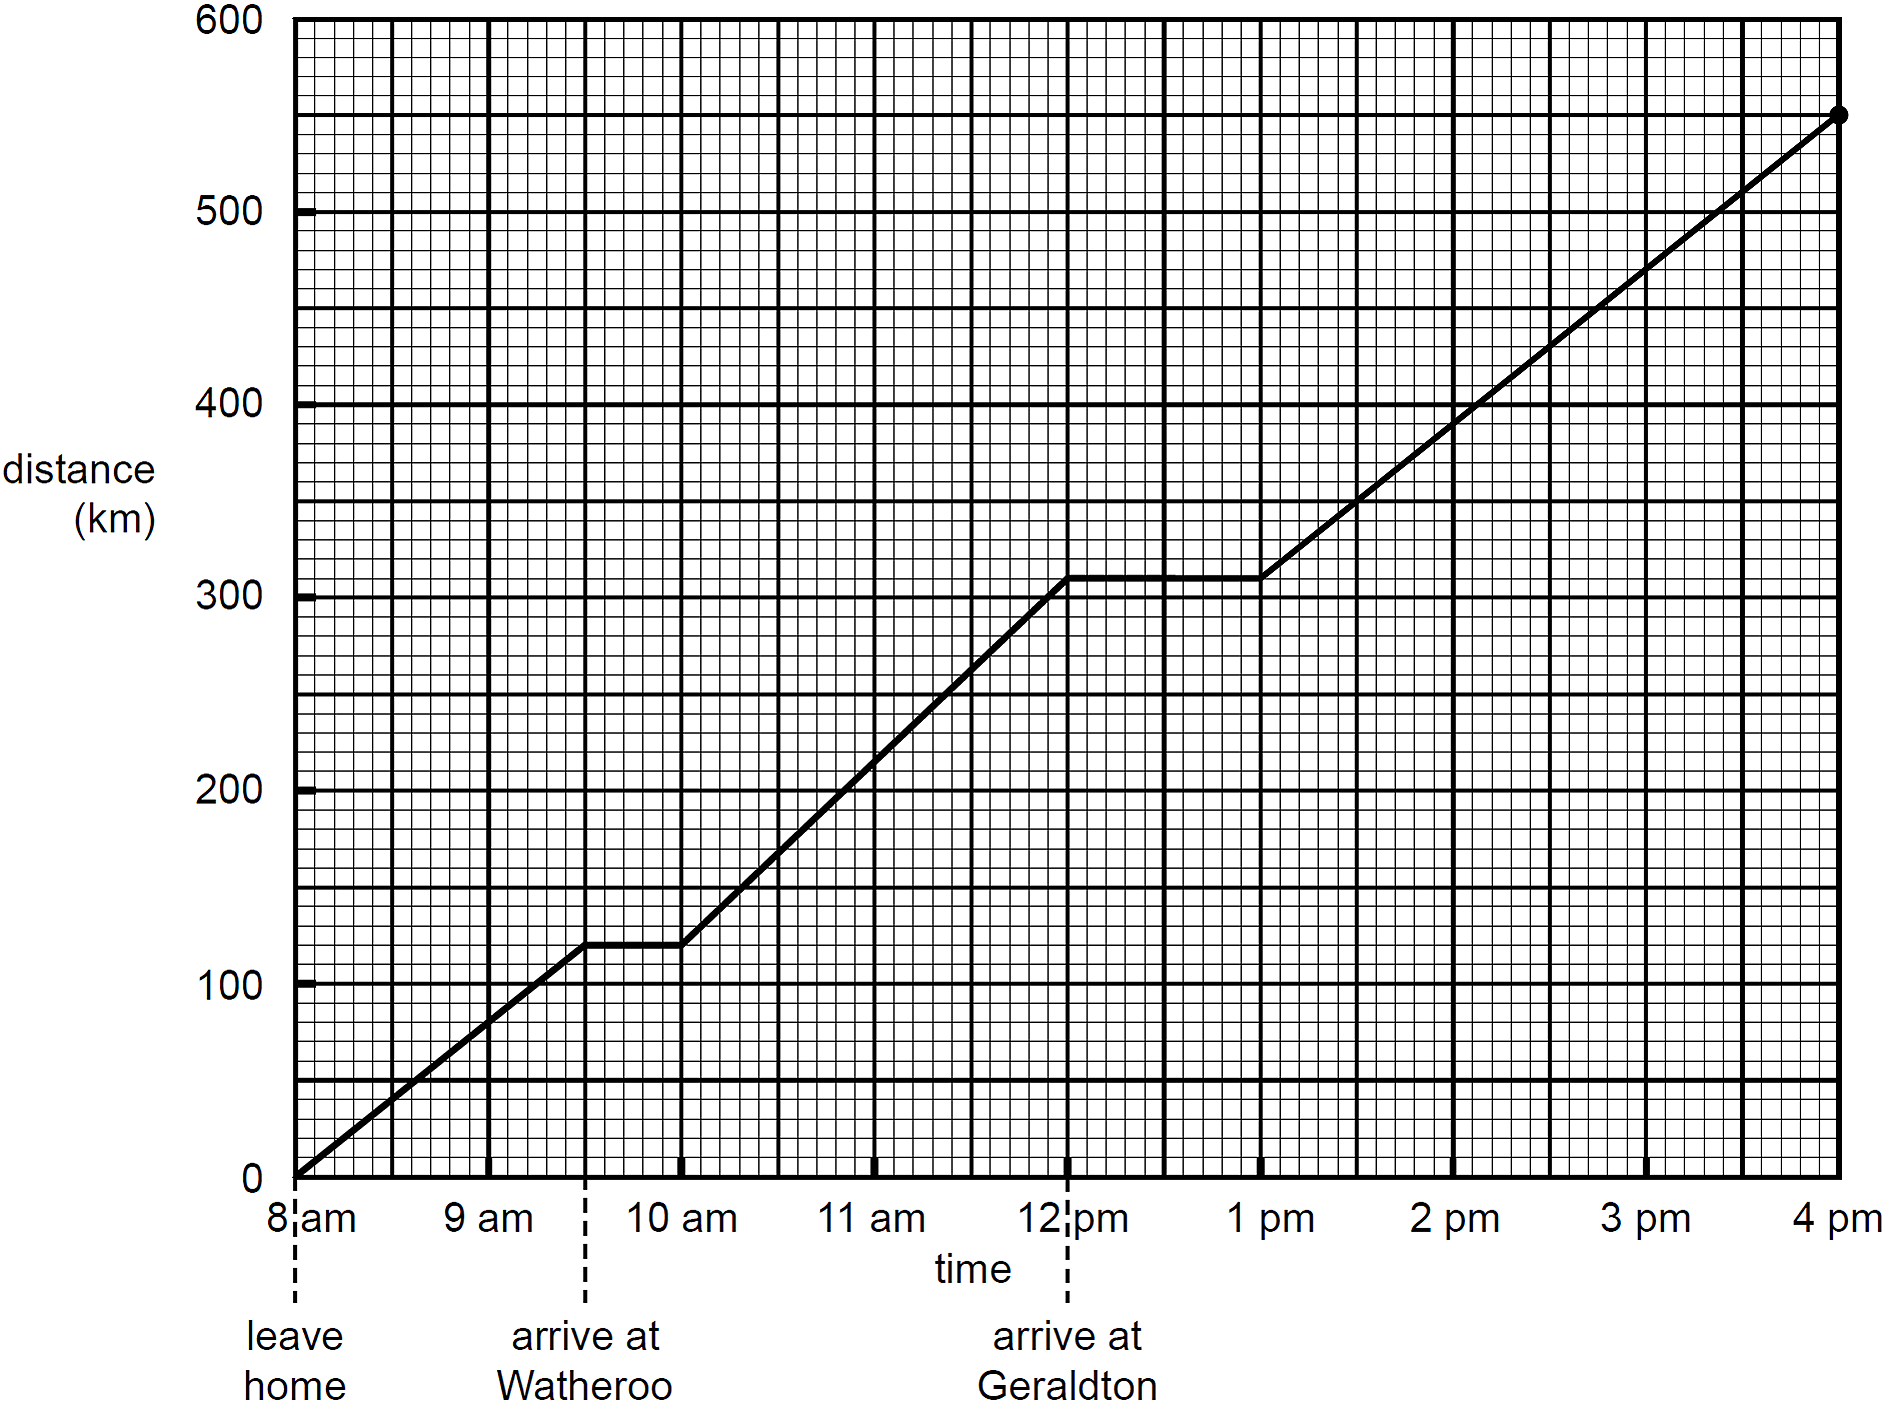
The Goldsmiths leave Geraldton at 1 pm and drive to Hamelin. They travel at a constant speed of 80 km/h for three hours. They do not make any stops.
- On the graph above, draw a line segment representing their journey from Geraldton to Hamelin. (1 mark)
GRAPHS, FUR2 2008 VCAA 1
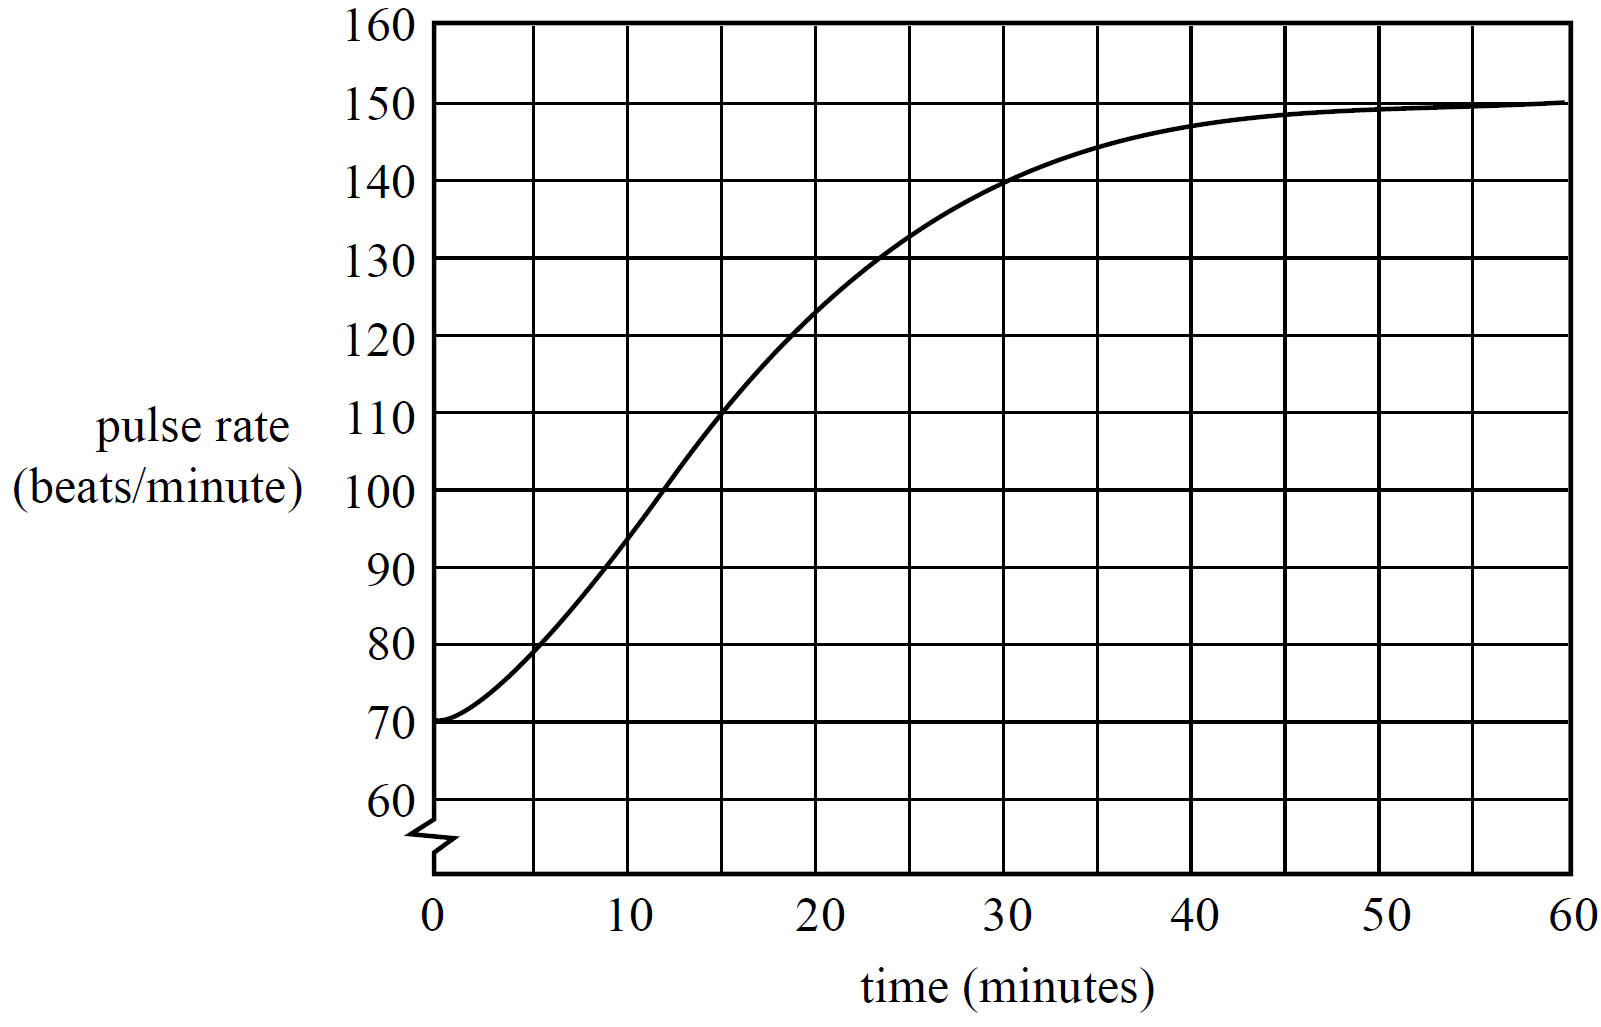
Tiffany’s pulse rate (in beats/minute) during the first 60 minutes of a long-distance run is shown in the graph below.
- What was Tiffany’s pulse rate (in beats/minute) 15 minutes after she started her run? (1 mark)
- By how much did Tiffany’s pulse rate increase over the first 60 minutes of her run?
Write your answer in beats/minute. (1 mark)
- The recommended maximum pulse rate for adults during exercise is determinded by subtracting the person’s age in years from 220.
- Write an equation in terms of the variables maximum pulse rate and age that can be used to determine a person’s recommended maximum pulse rate from his or her age. (1 mark)
The target zone for aerobic exercise is between 60% and 75% of a person’s maximum pulse rate.
Tiffany is 20 years of age.
- Determine the values between which Tiffany’s pulse rate should remain so that she exercises within her target zone.
Write your answers correct to the nearest whole number. (1 mark)
CORE*, FUR2 2009 VCAA 1
The recommended retail price of a golf bag is $500. Rebecca sees the bag discounted by $120 at a sale.
- What is the price of the golf bag after the $120 discount has been applied? (1 mark)
--- 2 WORK AREA LINES (style=lined) ---
- Find the discount as a percentage of the recommended retail price. ( 1 mark)
--- 2 WORK AREA LINES (style=lined) ---
GRAPHS, FUR2 2009 VCAA 1
Fair Go Airlines offers air travel between destinations in regional Victoria.
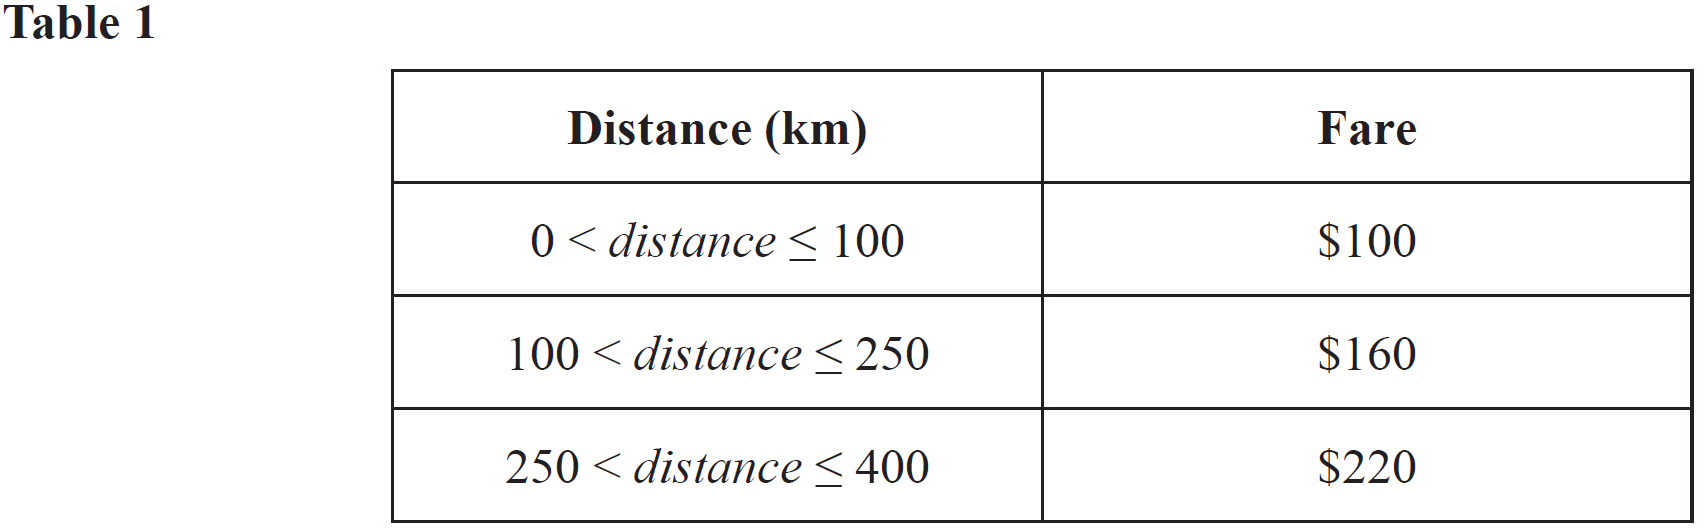
Table 1 shows the fares for some distances travelled.
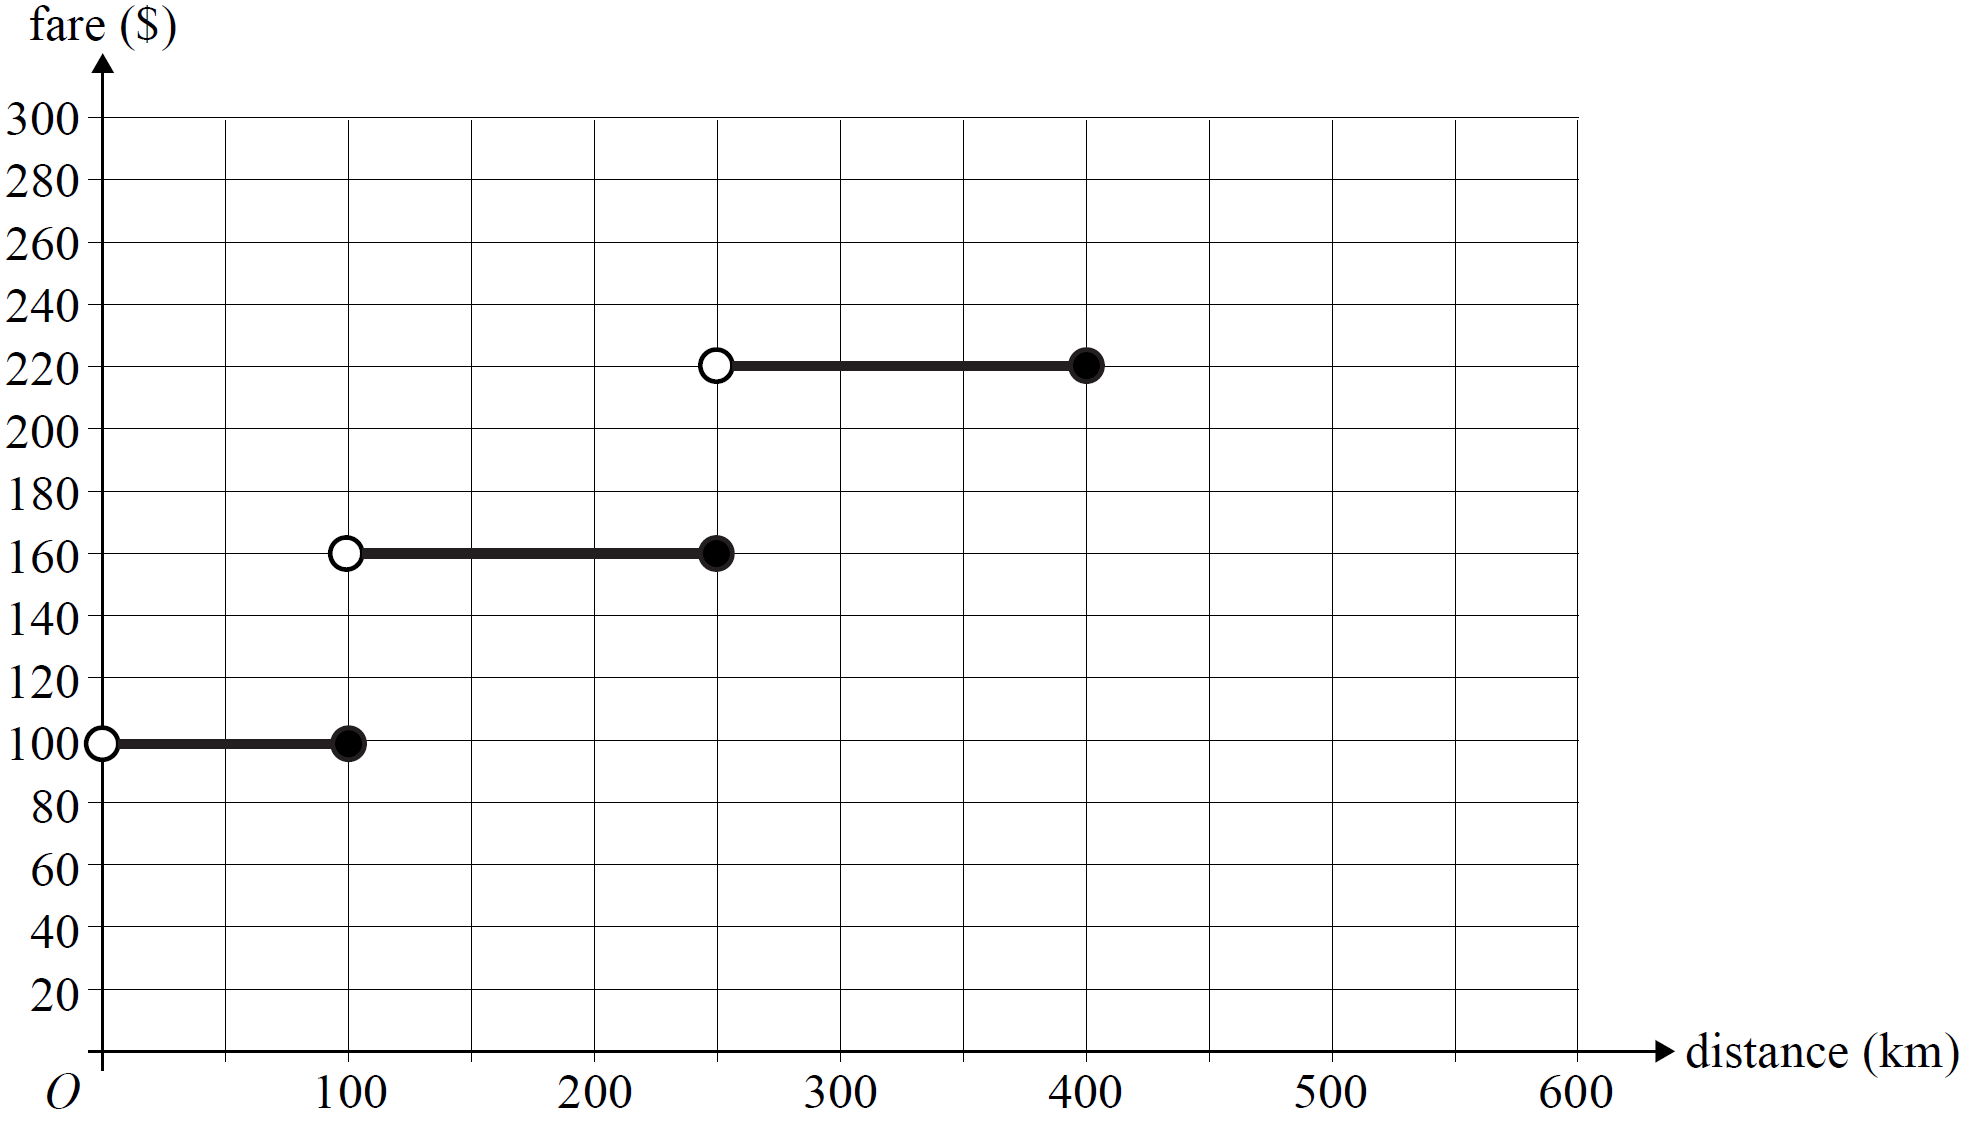
- What is the maximum distance a passenger could travel for $160? (1 mark)
The fares for the distances travelled in Table 1 are graphed below.
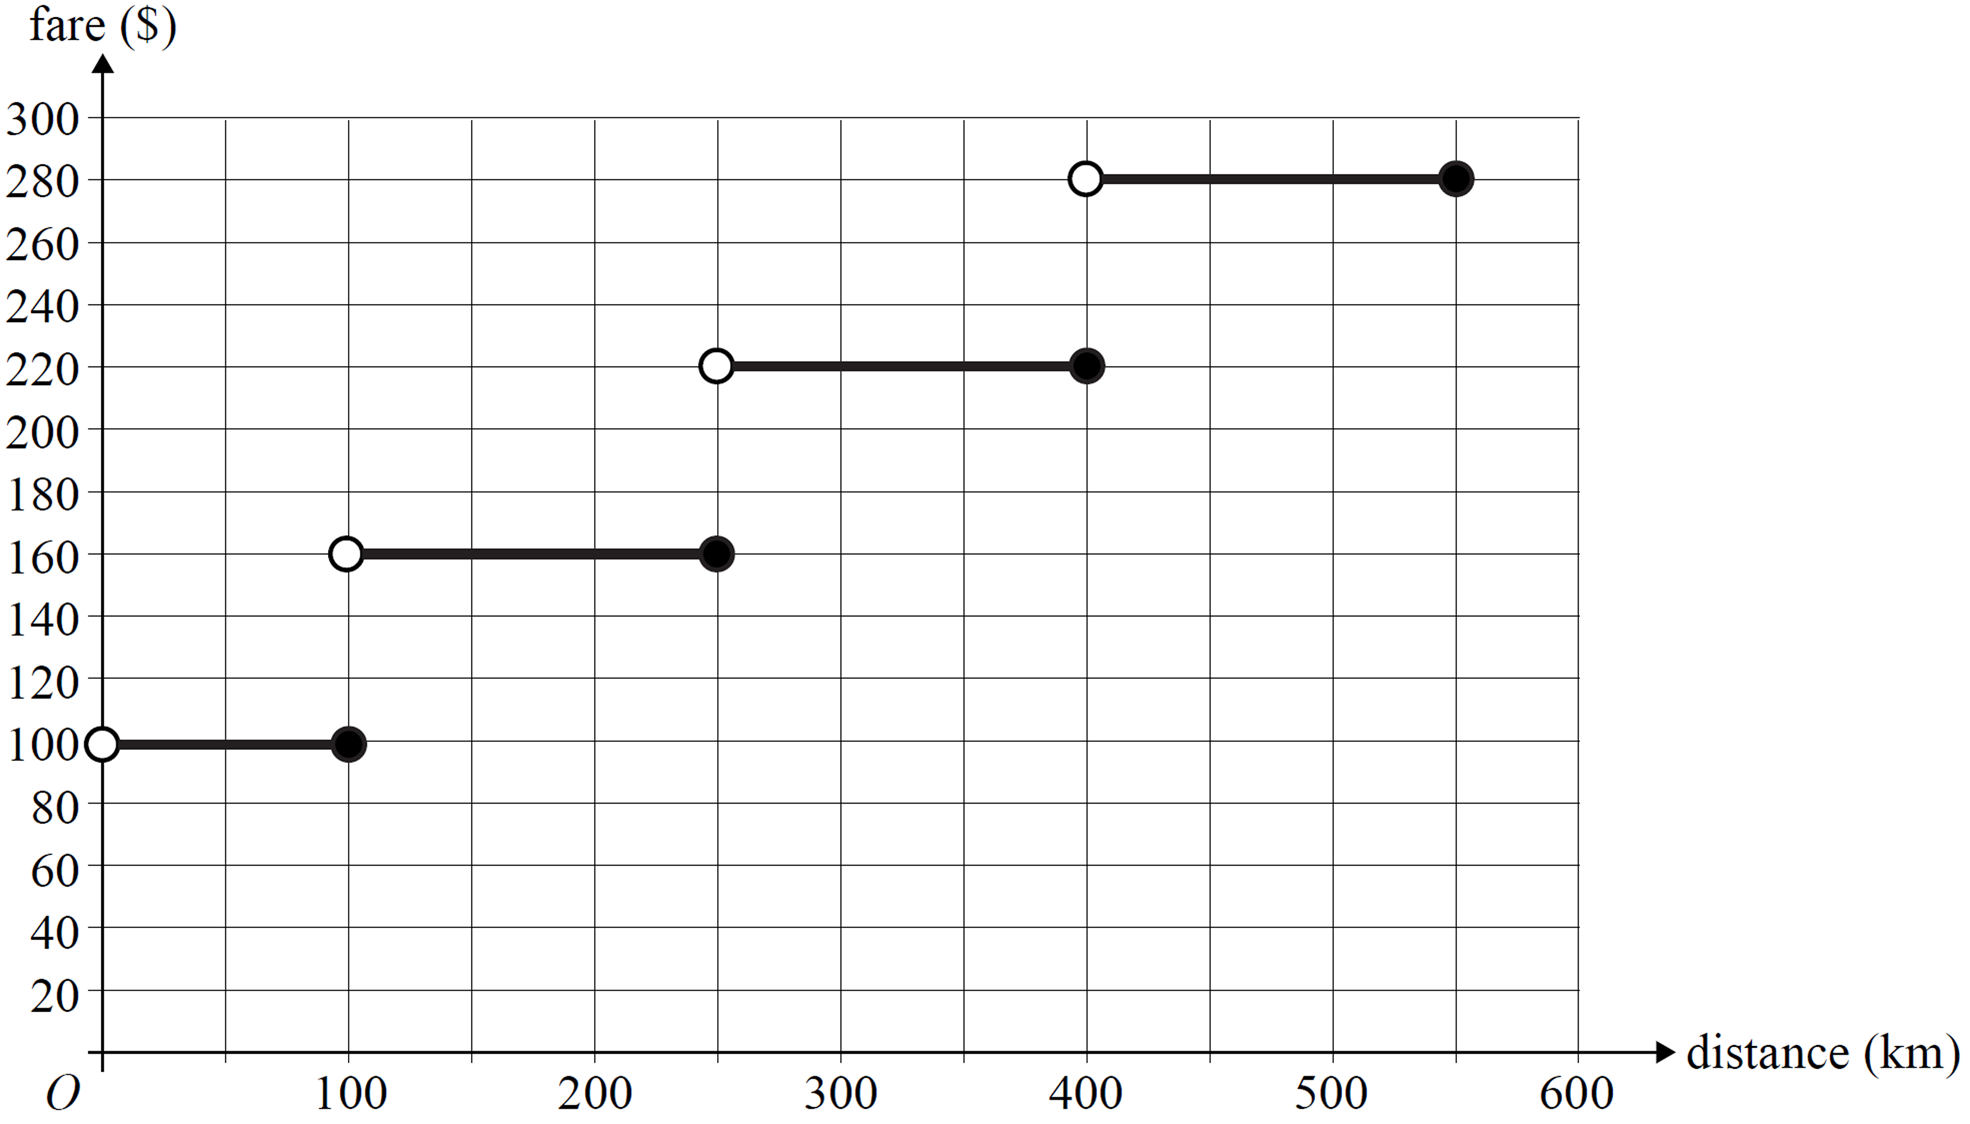
- The fare for a distance longer than 400 km, but not longer than 550 km, is $280.
Draw this information on the graph above. (1 mark)
Fair Go Airlines is planning to change its fares.
A new fare will include a service fee of $40, plus 50 cents per kilometre travelled.
An equation used to determine this new fare is given by
fare = `40 + 0.5` × distance.
- A passenger travels 300 km.
How much will this passenger save on the fare calculated using the equation above compared to the fare shown in Table 1? (1 mark)
- At a certain distance between 250 km and 400 km, the fare, when calculated using either the new equation or Table 1, is the same.
What is this distance? (2 marks)
- An equation connecting the maximum distance that may be travelled for each fare in Table 1 on page 16 can be written as
fare = `a` + `b` × maximum distance.
Determine `a` and `b`. (2 marks)
GEOMETRY, FUR2 2010 VCAA 1
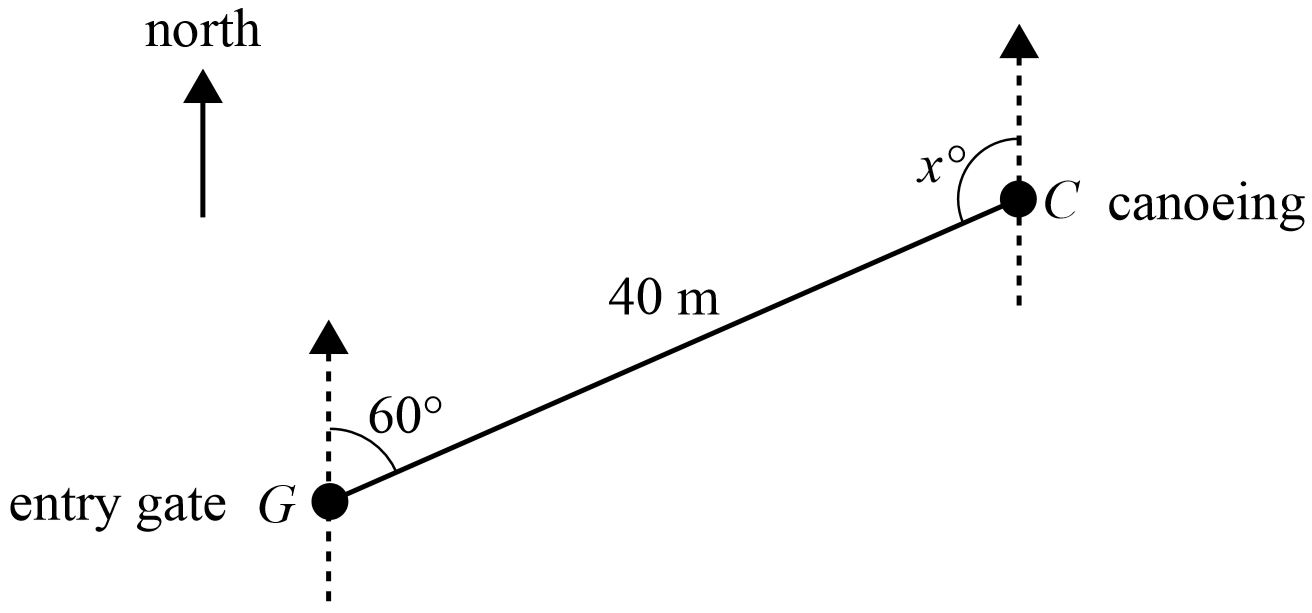
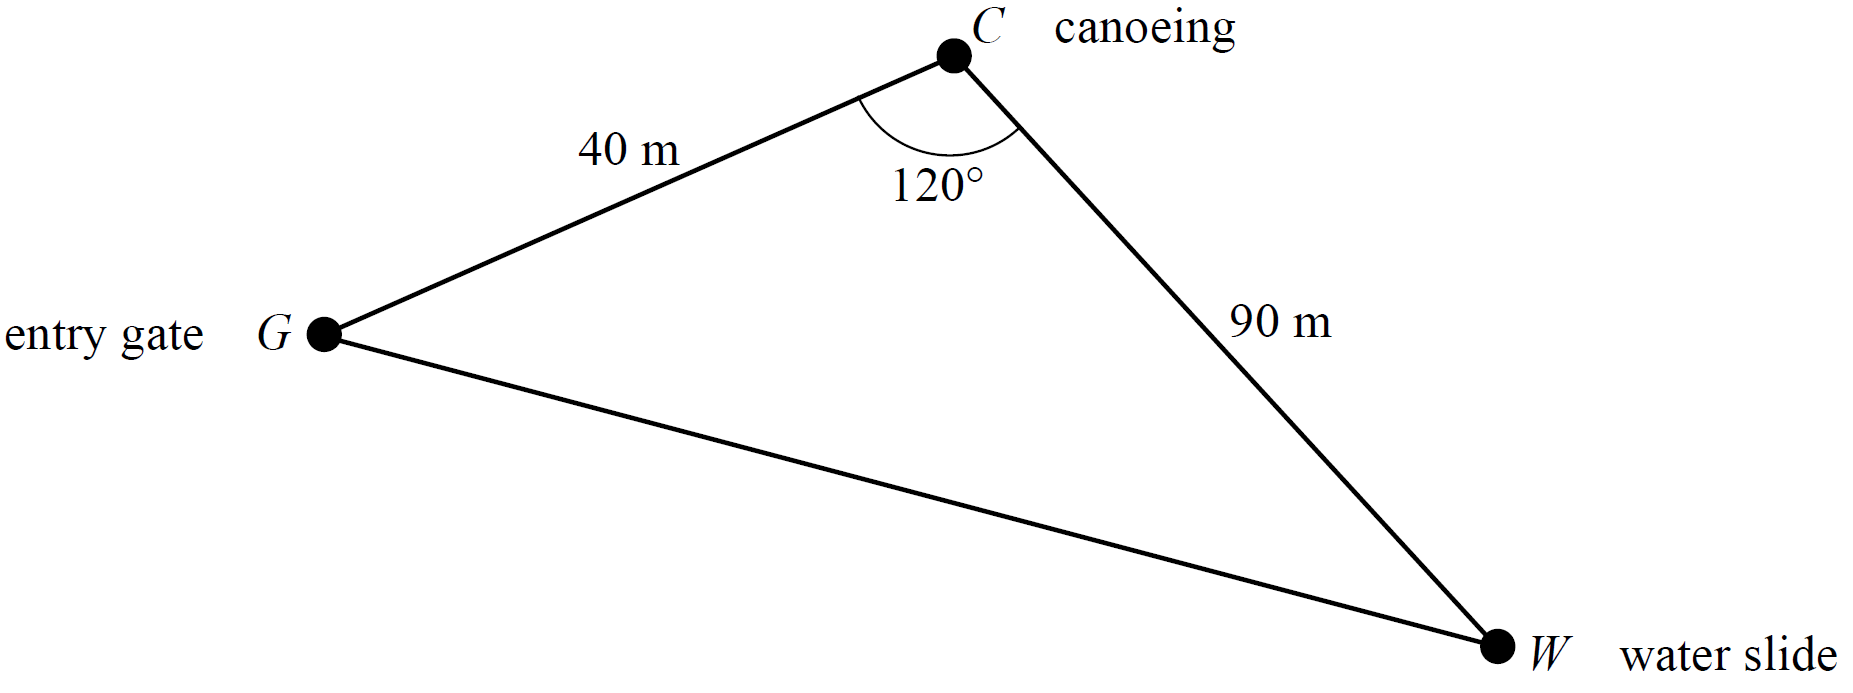
In the plan below, the entry gate of an adventure park is located at point `G`.
A canoeing activity is located at point `C`.
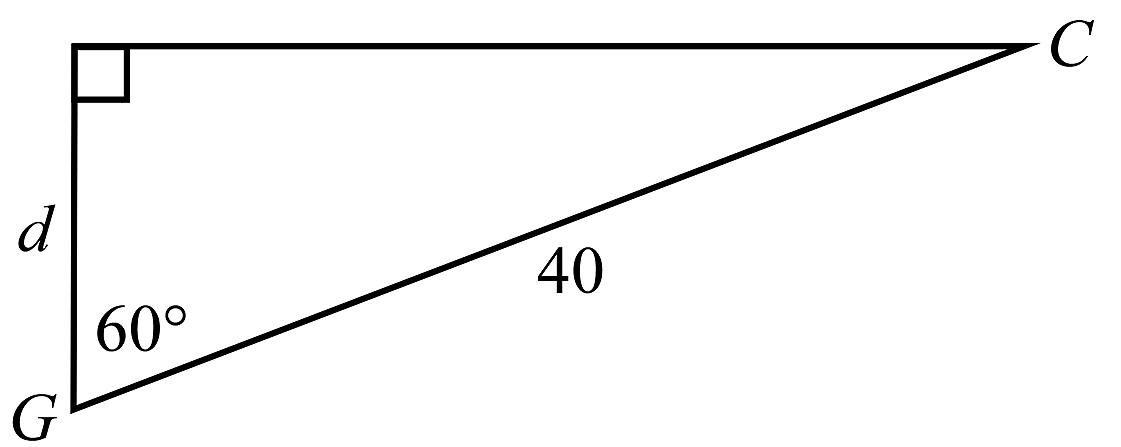
The straight path `GC` is 40 metres long.
The bearing of `C` from `G` is 060°.
- Write down the size of the angle that is marked `x^@` in the plan above. (1 mark)
- What is the bearing of the entry gate from the canoeing activity? (1 mark)
- How many metres north of the entry gate is the canoeing activity? (1 mark)
`CW` is a 90 metre straight path between the canoeing activity and a water slide located at point `W`.
`GW` is a straight path between the entry gate and the water slide.
The angle `GCW` is 120°.
-
- Find the area that is enclosed by the three paths, `GC`, `CW` and `GW`.
Write your answer in square metres, correct to one decimal place. (1 mark)
- Show that the length of path `GW` is 115.3 metres, correct to one decimal place. (1 mark)
- Find the area that is enclosed by the three paths, `GC`, `CW` and `GW`.
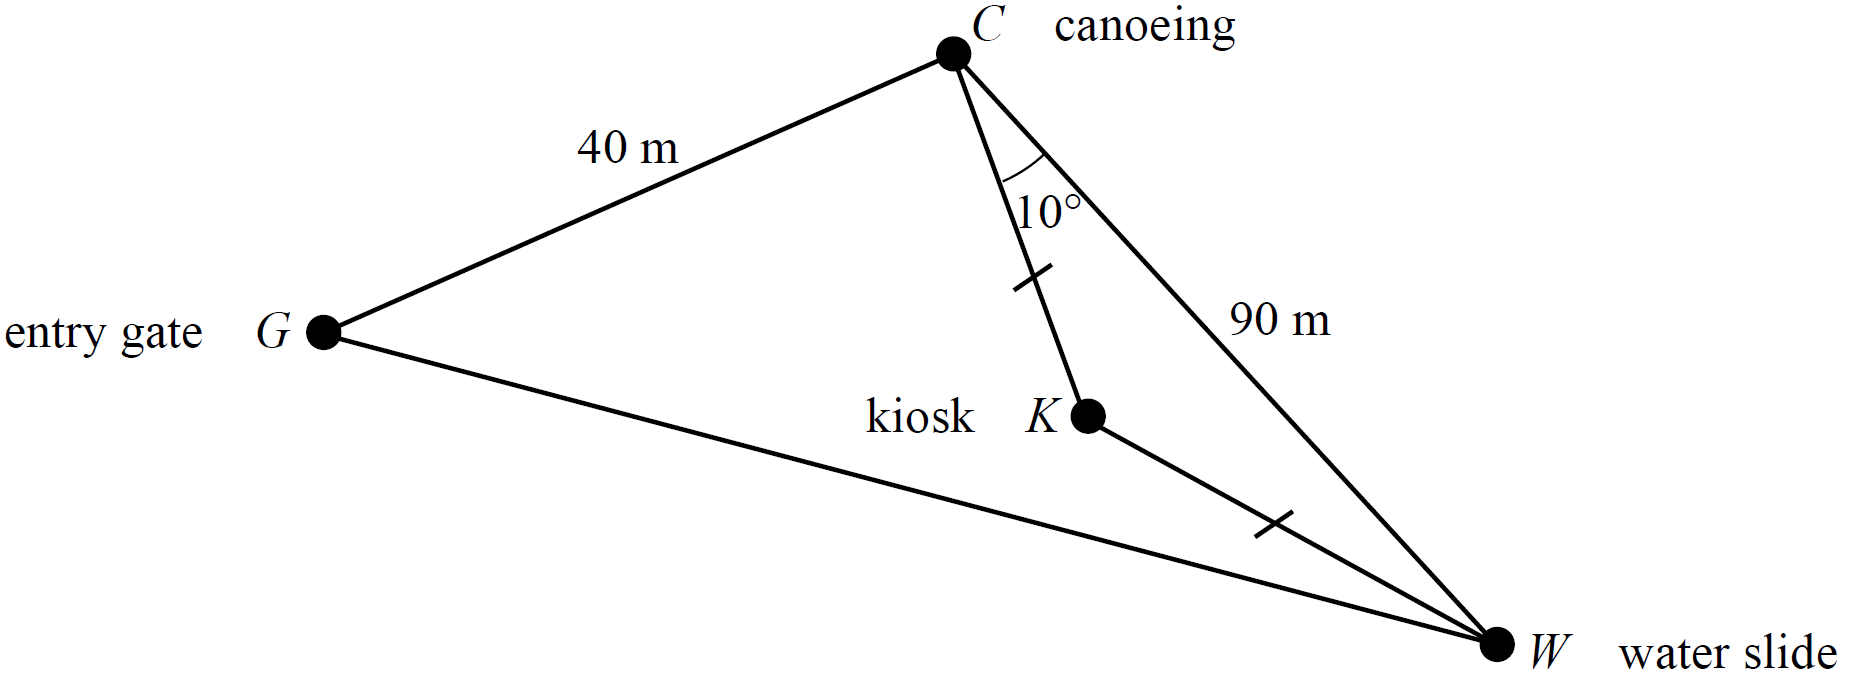
Straight paths `CK` and `WK` lead to the kiosk located at point `K`.
These two paths are of equal length.
The angle `KCW` is 10°.
-
- Find the size of the angle `CKW`. (1 mark)
- Find the length of path `CK`, in metres, correct to one decimal place. (1 mark)
CORE*, FUR2 2011 VCAA 1
Tony plans to take his family on a holiday.
The total cost of $3630 includes a 10% Goods and Services Tax (GST).
- Determine the amount of GST that is included in the total cost. (1 mark)
During the holiday, the family plans to visit some theme parks.
The prices of family tickets for three theme parks are shown in the table below.
- What is the total cost for the family if it visits all three theme parks? (1 mark)
If Tony purchases the Movie Journey family ticket online, the cost is discounted to $202.40
- Determine the percentage discount. (1 mark)
CORE*, FUR2 2012 VCAA 1
A club purchased new equipment priced at $8360. A 15% deposit was paid. --- 2 WORK AREA LINES (style=lined) --- --- 2 WORK AREA LINES (style=lined) --- --- 3 WORK AREA LINES (style=lined) ---
NETWORKS, FUR1 2007 VCAA 3 MC
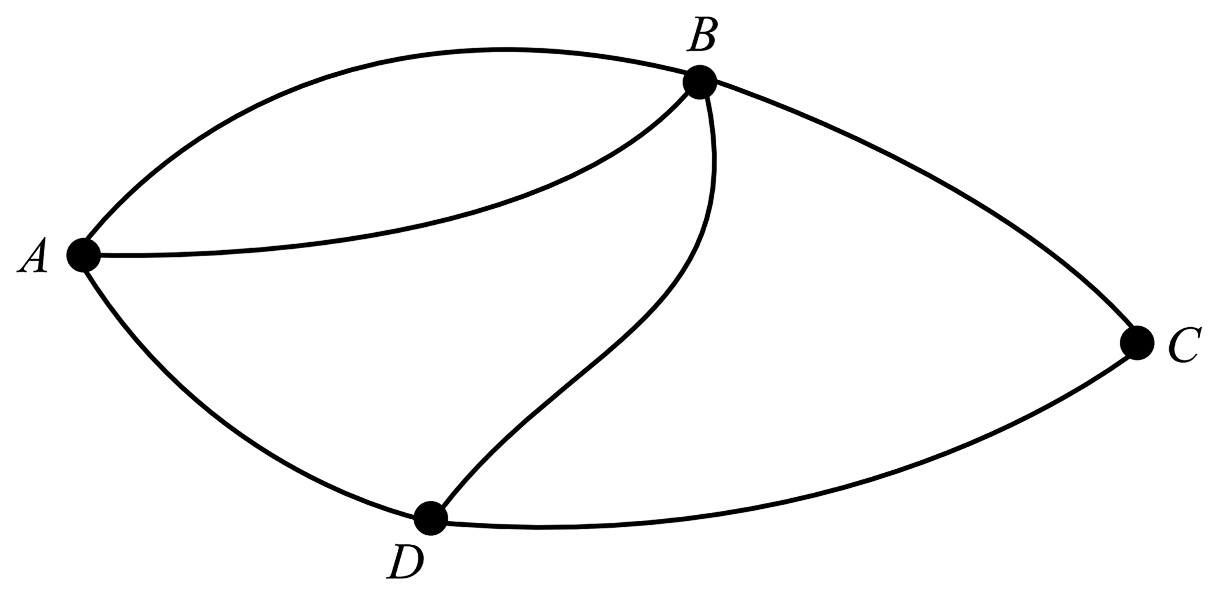
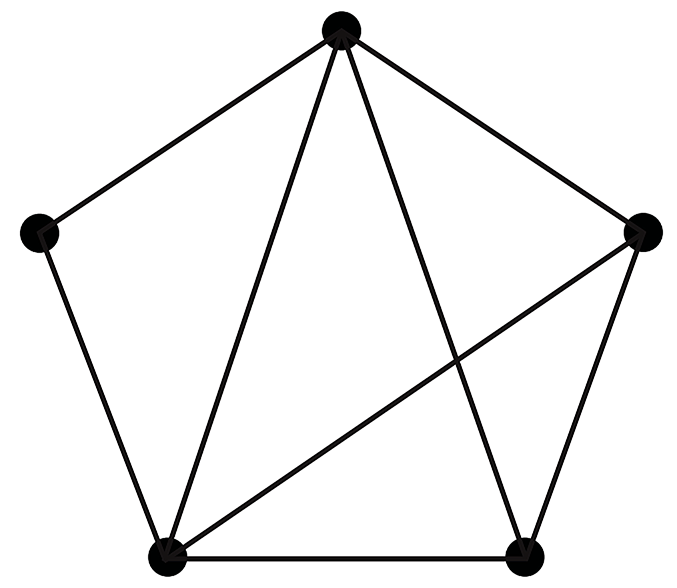
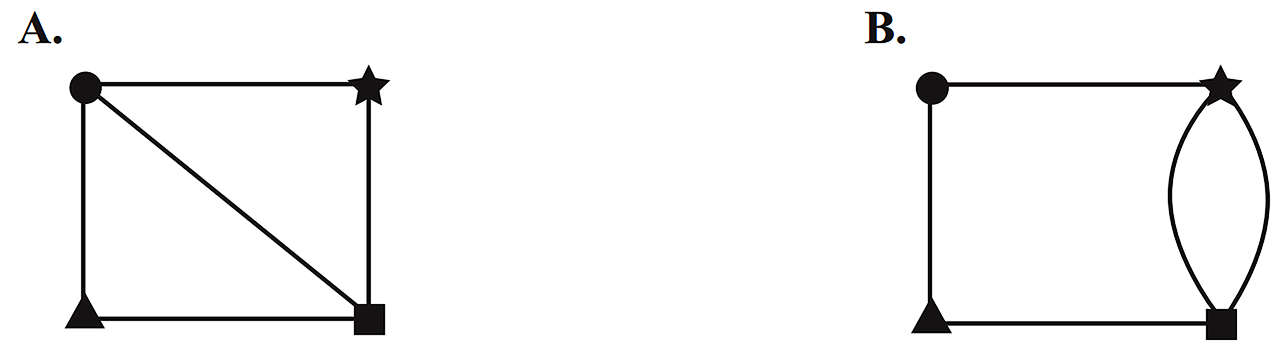
Consider the following graph.
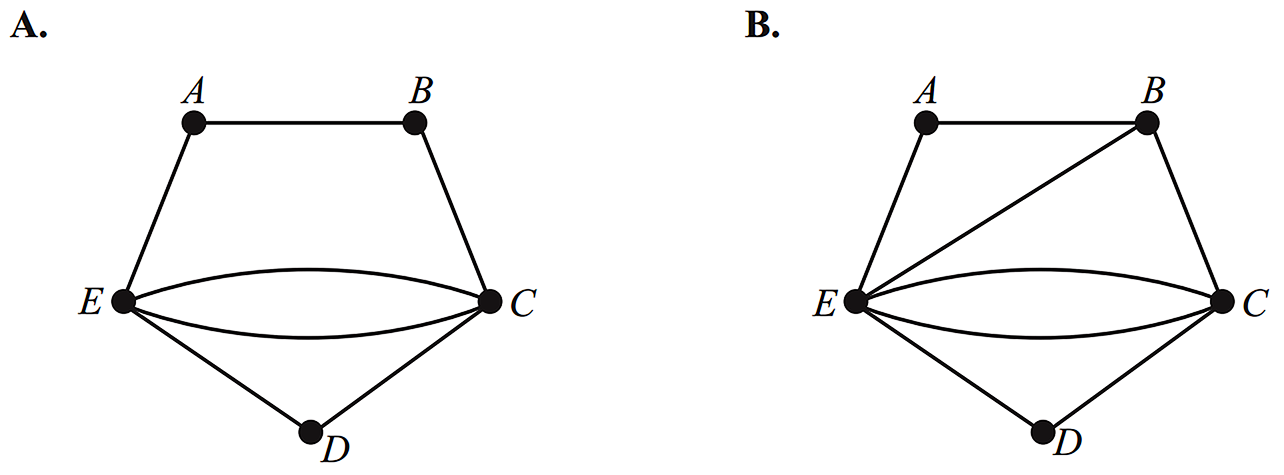
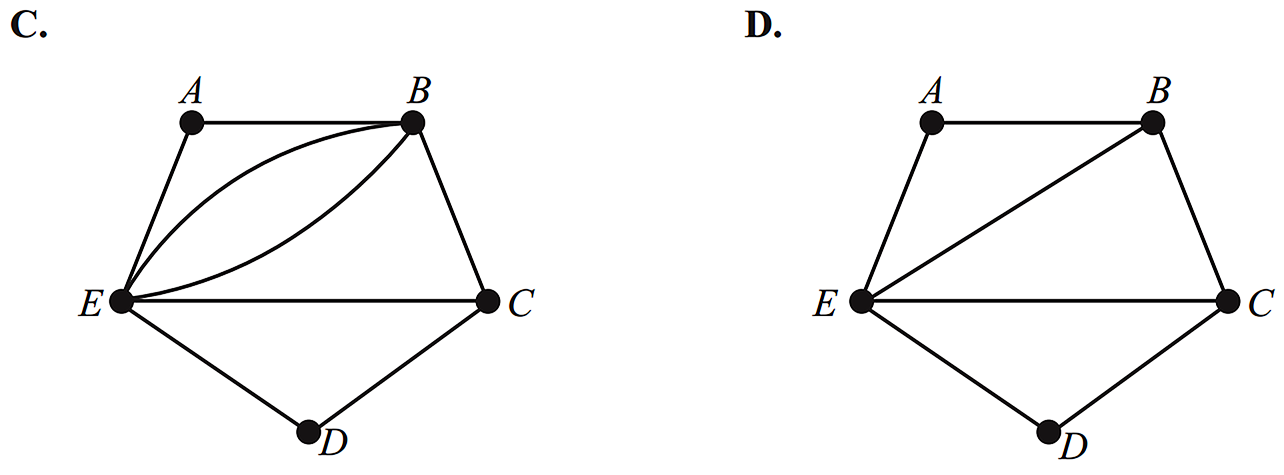
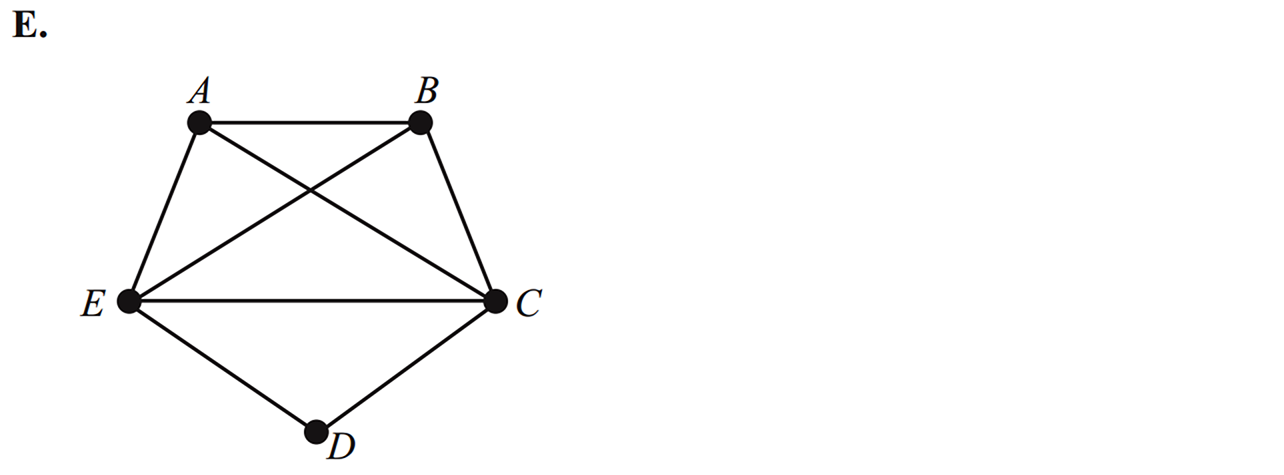
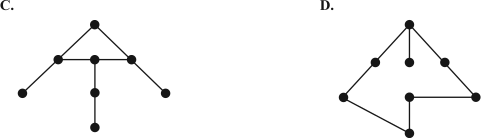
An adjacency matrix that could be used to represent this graph is
| A. | `[(0,2,0,1), (2,0,1,1), (0,1,0,1), (1,1,1,0)]` | B. | `[(0,2,0,1), (0,0,1,1), (0,0,0,1), (0,0,0,0)]` |
| C. | `[(0,1,0,1), (2,0,0,1), (0,1,0,1), (1,1,1,0)]` | D. | `[(0,2,0,1), (0,1,1,1), (0,1,1,1), (0,1,1,1)]` |
| E. | `[(1,2,0,1), (2,1,0,1), (0,1,1,0), (0,0,1,1)]` |
NETWORKS, FUR1 2010 VCAA 3 MC
NETWORKS, FUR1 2010 VCAA 2 MC
NETWORKS, FUR1 2010 VCAA 1 MC
NETWORKS, FUR1 2006 VCAA 2 MC
NETWORKS, FUR1 2009 VCAA 2 MC
NETWORKS, FUR1 2013 VCAA 1 MC
NETWORKS, FUR2 2006 VCAA 1
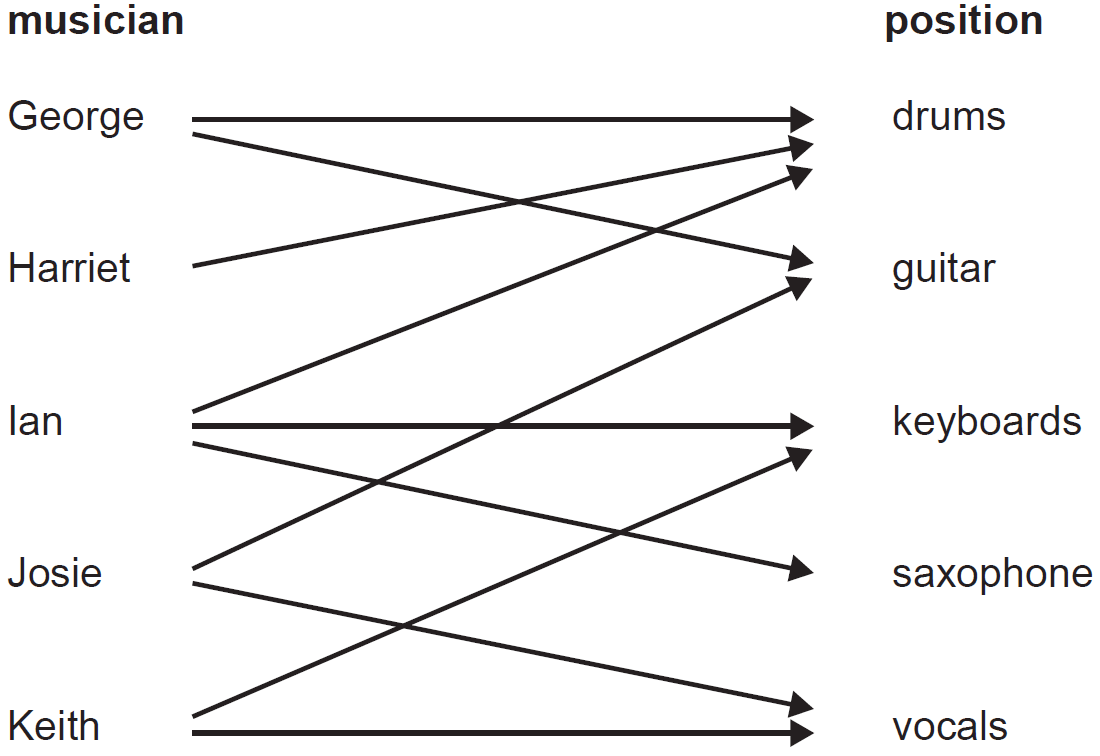
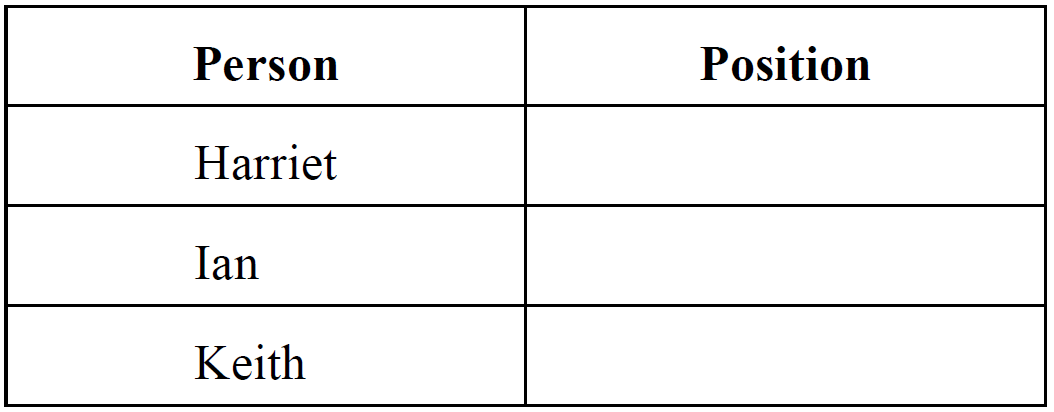
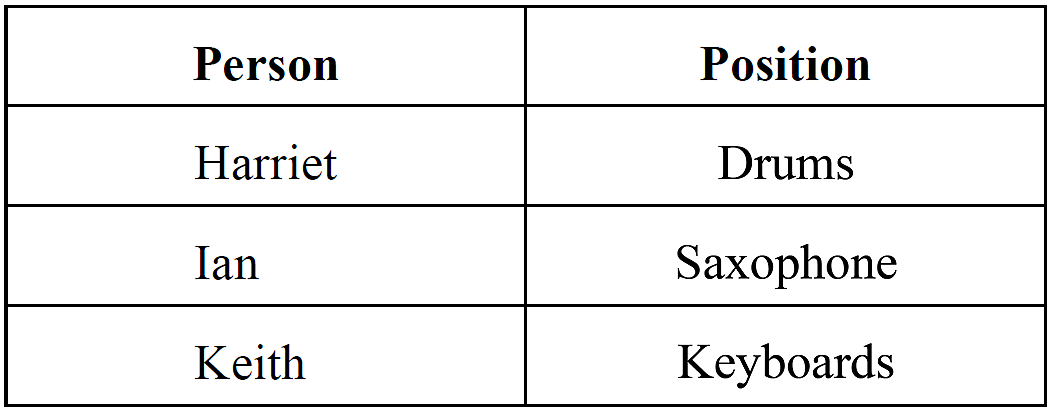
George, Harriet, Ian, Josie and Keith are a group of five musicians.
They are forming a band where each musician will fill one position only.
The following bipartite graph illustrates the positions that each is able to fill.
NETWORKS, FUR1 2015 VCAA 5 MC
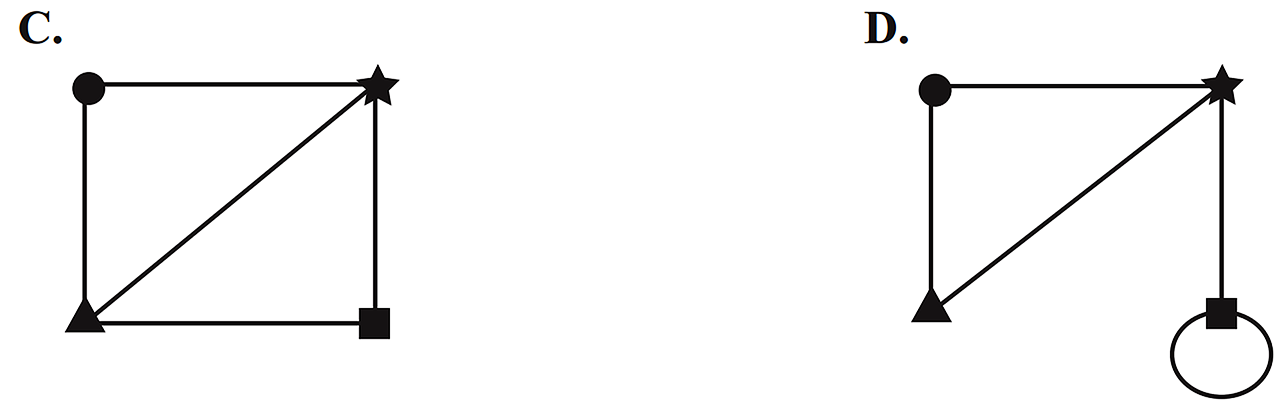
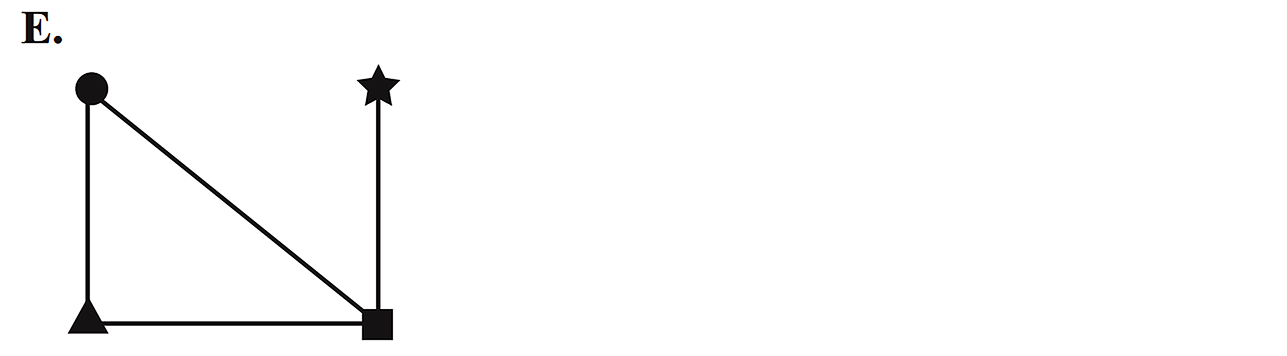
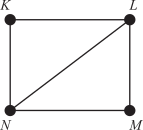
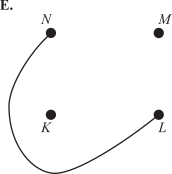
The graph below represents a friendship network. The vertices represent the four people in the friendship network: Kwan (`K`), Louise (`L`), Milly (`M`) and Narelle (`N`).
An edge represents the presence of a friendship between a pair of these people. For example, the edge connecting `K` and `L` shows that Kwan and Louise are friends.
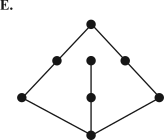
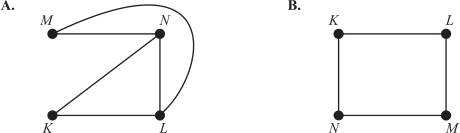
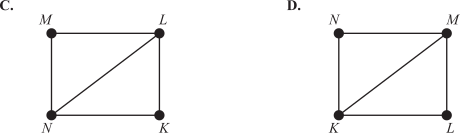
Which one of the following graphs does not contain the same information?
NETWORKS, FUR2 2009 VCAA 3
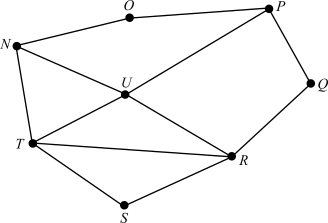
The city of Robville contains eight landmarks denoted as vertices `N` to `U` on the network diagram below. The edges on this network represent the roads that link the eight landmarks. --- 1 WORK AREA LINES (style=lined) --- --- 1 WORK AREA LINES (style=lined) --- --- 1 WORK AREA LINES (style=lined) --- --- 2 WORK AREA LINES (style=lined) --- --- 2 WORK AREA LINES (style=lined) ---
NETWORKS, FUR2 2011 VCAA 1
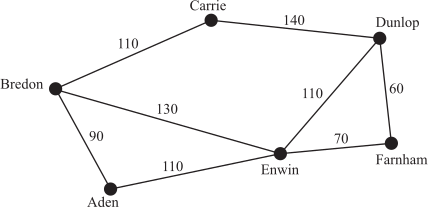
Aden, Bredon, Carrie, Dunlop, Enwin and Farnham are six towns.
The network shows the road connections and distances between these towns in kilometres.
- In kilometres, what is the shortest distance between Farnham and Carrie? (1 mark)
--- 2 WORK AREA LINES (style=lined) ---
- How many different ways are there to travel from Farnham to Carrie without passing through any town more than once? (1 mark)
--- 4 WORK AREA LINES (style=lined) ---
An engineer plans to inspect all of the roads in this network.
He will start at Dunlop and inspect each road only once.
- At which town will the inspection finish? (1 mark)
--- 1 WORK AREA LINES (style=lined) ---
Another engineer decides to start and finish her road inspection at Dunlop.
If an assistant inspects two of the roads, this engineer can inspect the remaining six roads and visit each of the other five towns only once.
- How many kilometres of road will the assistant need to inspect? (1 mark)
--- 3 WORK AREA LINES (style=lined) ---
NETWORKS, FUR2 2013 VCAA 1
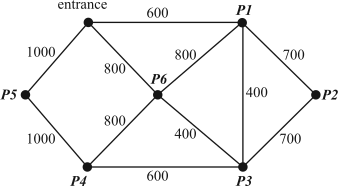
The vertices in the network diagram below show the entrance to a wildlife park and six picnic areas in the park: `P1`, `P2`, `P3`, `P4`, `P5` and `P6`.
The numbers on the edges represent the lengths, in metres, of the roads joining these locations.
- In this graph, what is the degree of the vertex at the entrance to the wildlife park? (1 mark)
--- 1 WORK AREA LINES (style=lined) ---
- What is the shortest distance, in metres, from the entrance to picnic area `P3`? (1 mark)
--- 3 WORK AREA LINES (style=lined) ---
- A park ranger starts at the entrance and drives along every road in the park once.
- i. At which picnic area will the park ranger finish? (1 mark)
--- 3 WORK AREA LINES (style=lined) ---
- ii. What mathematical term is used to describe the route the park ranger takes? (1 mark)
--- 1 WORK AREA LINES (style=lined) ---
- A park cleaner follows a route that starts at the entrance and passes through each picnic area once, ending at picnic area `P1`.
Write down the order in which the park cleaner will visit the six picnic areas. (1 mark)
--- 1 WORK AREA LINES (style=lined) ---
MATRICES, FUR2 2006 VCAA 1
A manufacturer sells three products, `A`, `B` and `C`, through outlets at two shopping centres, Eastown (`E`) and Noxland (`N`).
The number of units of each product sold per month through each shop is given by the matrix `Q`, where
`{:((qquadqquadqquad\ A,qquadquadB,qquad\ C)),(Q=[(2500,3400,1890),(1765,4588,2456)]{:(E),(N):}):}`
- Write down the order of matrix `Q`. (1 mark)
--- 1 WORK AREA LINES (style=lined) ---
The matrix `P`, shown below, gives the selling price, in dollars, of products `A`, `B`, `C`.
`P = [(14.50),(21.60),(19.20)]{:(A),(B),(C):}`
- i. Evaluate the matrix `M`, where `M = QP`. (1 mark)
--- 3 WORK AREA LINES (style=lined) ---
- ii. What information does the elements of matrix `M` provide? (1 mark)
--- 2 WORK AREA LINES (style=lined) ---
- Explain why the matrix `PQ` is not defined. (1 mark)
--- 2 WORK AREA LINES (style=lined) ---
NETWORKS, FUR2 2010 VCAA 1
The members of one team are Kristy (`K`), Lyn (`L`), Mike (`M`) and Neil (`N`).
In one of the challenges, these four team members are only allowed to communicate directly with each other as indicated by the edges of the following network.
The adjacency matrix below also shows the allowed lines of communication.
`{:(quadKquadLquadMquadN),([(0,1,0,0),(1,0,1,0),(0,f,0,1),(0,g,1,0)]{:(K),(L),(M),(N):}):}`
- Explain the meaning of a zero in the adjacency matrix. (1 mark)
--- 1 WORK AREA LINES (style=lined) ---
- Write down the values of `f` and `g` in the adjacency matrix. (1 mark)
--- 1 WORK AREA LINES (style=lined) ---
MATRICES, FUR2 2009 VCAA 1
Three types of cheese, Cheddar (`C`), Gouda (`G`) and Blue (`B`), will be bought for a school function. The cost matrix `P` lists the prices of these cheeses, in dollars, at two stores, Foodway and Safeworth. `P = [(6.80, 5.30, 6.20),(7.30, 4.90, 6.15)]{:(text(Foodway)),(text(Safeworth)):}` --- 1 WORK AREA LINES (style=lined) --- The number of packets of each type of cheese needed is listed in the quantity matrix `Q`. `Q = [(8),(11),(3)]{:(C),(G),(B):}` --- 3 WORK AREA LINES (style=lined) --- --- 1 WORK AREA LINES (style=lined) ---
MATRICES, FUR2 2010 VCAA 1
In a game of basketball, a successful shot for goal scores one point, two points, or three points, depending on the position from which the shot is thrown.
`G` is a column matrix that lists the number of points scored for each type of successful shot.
`G = [(1),(2),(3)]`
In one game, Oscar was successful with
-
- 4 one-point shots for goal
- 8 two-point shots for goal
- 2 three-point shots for goal.
- Write a row matrix, `N`, that shows the number of each type of successful shot for goal that Oscar had in that game. (1 mark)
--- 1 WORK AREA LINES (style=lined) ---
- Matrix `P` is found by multiplying matrix `N` with matrix `G` so that `P = N xx G`
- Evaluate matrix `P`. (1 mark)
--- 3 WORK AREA LINES (style=lined) ---
- In this context, what does the information in matrix `P` provide? (1 mark)
--- 2 WORK AREA LINES (style=lined) ---
MATRICES, FUR2 2011 VCAA 1
The diagram below shows the feeding paths for insects (`I`), birds (`B`) and lizards (`L`). The matrix `E` has been constructed to represent the information in this diagram. In matrix `E`, a 1 is read as "eat" and a 0 is read as "do not eat".
- Referring to insects, birds or lizards
- i. what does the 1 in column `B`, row `L`, of matrix `E` indicate? (1 mark)
--- 1 WORK AREA LINES (style=lined) ---
- ii. what does the row of zeros in matrix `E` indicate? (1 mark)
--- 1 WORK AREA LINES (style=lined) ---
The diagram below shows the feeding paths for insects (`I`), birds (`B`), lizards (`L`) and frogs (`F`).
The matrix `Z` has been set up to represent the information in this diagram.
Matrix `Z` has not been completed.
- Complete the matrix `Z` above by writing in the seven missing elements. (1 mark)
--- 0 WORK AREA LINES (style=lined) ---
MATRICES, FUR2 2013 VCAA 1
Five trout-breeding ponds, `P`, `Q`, `R`, `X` and `V`, are connected by pipes, as shown in the diagram below.
The matrix `W` is used to represent the information in this diagram.
`{:({:\ qquadqquadqquadPquadQquad\ Rquad\ Xquad\ V:}),(W = [(0,1,1,1,0), (1,0,0,1,0),(1,0,0,1,0),(1,1,1,0,1),(0,0,0,1,0)]):}{:(),(P),(Q),(R),(X),(V):}`
In matrix `W`
• the 1 in column 1, row 2, for example, indicates that a pipe directly connects pond `P` and pond `Q`
• the 0 in column 1, row 5, for example, indicates that pond `P` and pond `V` are not directly connected by a pipe.
- Find the sum of the elements in row 3 of matrix `W`. (1 mark)
--- 1 WORK AREA LINES (style=lined) ---
- In terms of the breeding ponds described, what does the sum of the elements in row 3 of matrix `W` represent? (1 mark)
--- 2 WORK AREA LINES (style=lined) ---
The pipes connecting pond `P` to pond `R` and pond `P` to pond `X` are removed.
Matrix `N` will be used to show this situation. However, it has missing elements.
MATRICES, FUR1 2009 VCAA 1 MC
`3[[2,1],[0,3]] + 2[[−1,0],[2,−7]]` equals
A. `[[4,3],[4,−5]]`
B. `6[[1,1],[2,−4]]`
C. `[[4,3],[4,2]]`
D. `5[[1,1],[2,−4]]`
E. `[[3,6],[7,4]]`
MATRICES, FUR1 2010 VCAA 1 MC
The order of the matrix `[(2, 2), (2, 2), (2, 2)]` is
A. `2 xx 2`
B. `2 xx 3`
C. `3 xx 2`
D. `4`
E. `6`
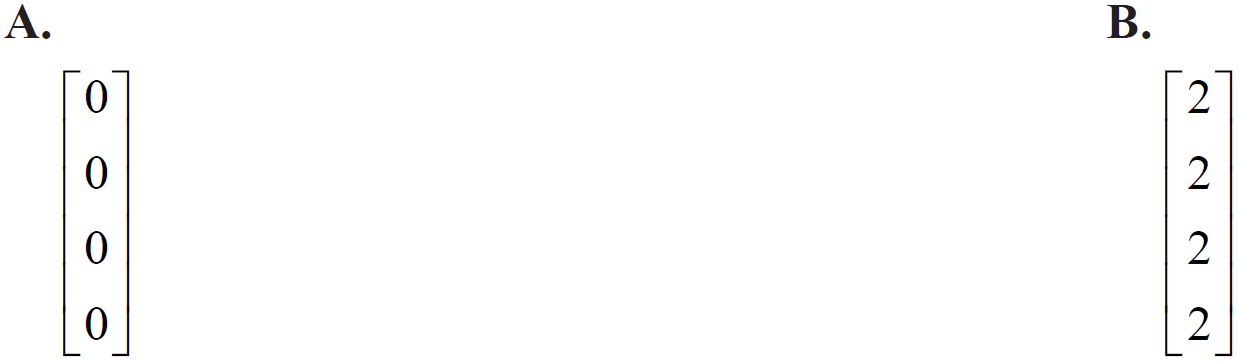
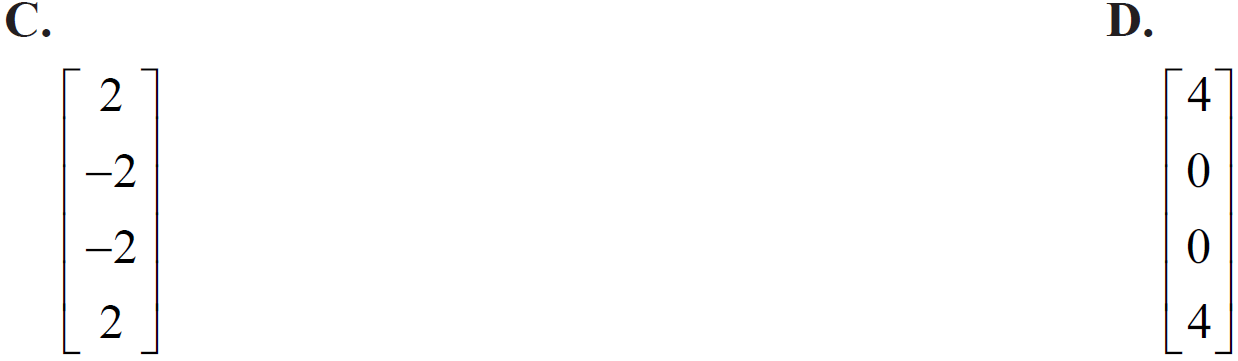
MATRICES, FUR1 2013 VCAA 1 MC
MATRICES, FUR1 2007 VCAA 2 MC
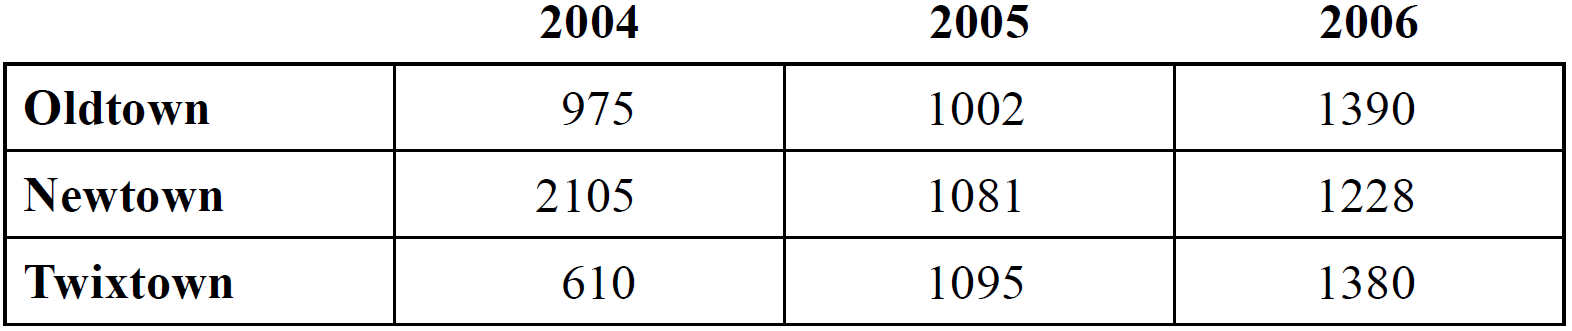
The number of tourists visiting three towns, Oldtown, Newtown and Twixtown, was recorded for three years.
The data is summarised in the table below.
The `3 xx 1` matrix that could be used to show the number of tourists visiting the three towns in the year 2005 is
| A. `[(975, 1002, 1390)]` | B. `[(1002, 1081, 1095)]` |
| C. `[(975), (1002), (1390)]` | D. `[(1002), (1081), (1095)]` |
| E. `[(975, 1002, 1390), (2105, 1081, 1228), (610, 1095, 1380)]` |
MATRICES, FUR1 2011 VCAA 2 MC
If `A=[(0,1),(1,0)],\ B=[(1),(0)]` and `C= [(0),(1)]`, then `AB + 2C` equals
A. `[(0),(3)]`
B. `[(3),(0)]`
C. `[(1),(2)]`
D. `[(2),(0)]`
E. `[(2),(3)]`
MATRICES, FUR1 2011 VCAA 1 MC
The matrix below shows the airfares (in dollars) that are charged by Zeniff Airlines to fly between Adelaide (`A`), Melbourne (`M`) and Sydney (`S`).
`{:(qquadqquadquadtext(from)),({:(qquadA,\ M,\ S):}),([(0,85,89),(85,0,99),(97,101,0)]):}{:(),(),(A),(M),(S):}{:(),(),(),(qquadtext(to)),():}`
The cost to fly from Melbourne to Sydney with Zeniff Airlines is
A. `$85`
B. `$89`
C. `$97`
D. `$99`
E. `$101`
MATRICES, FUR1 2014 VCAA 1 MC
GRAPHS, FUR2 2012 VCAA 1
The cost, `C`, in dollars, of making `n` phones, is shown by the line in the graph below.
-
- Calculate the gradient of the line, `C`, drawn above. (1 mark)
- Write an equation for the cost, `C`, in dollars, of making `n` phones. (1 mark)
- The revenue, `R`, in dollars, obtained from selling `n` phones is given by `R = 150n`.
- Draw this line on the graph above. (1 mark)
- How many phones would need to be sold to obtain $54 000 in revenue? (1 mark)
- Determine the number of phones that would need to be made and sold to break even. (1 mark)
CORE*, FUR2 2013 VCAA 1
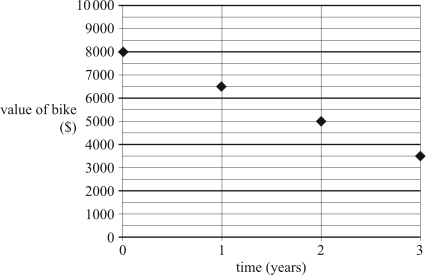
Hugo is a professional bike rider. The value of his bike will be depreciated over time using the flat rate method of depreciation. The graph below shows his bike’s initial purchase price and its value at the end of each year for a period of three years. --- 1 WORK AREA LINES (style=lined) --- --- 3 WORK AREA LINES (style=lined) --- --- 4 WORK AREA LINES (style=lined) --- The unit cost method of depreciation can also be used to depreciate the value of the bike. In a two-year period, the total depreciation calculated at $0.25 per kilometre travelled will equal the depreciation calculated using the flat rate method of depreciation as described above. --- 5 WORK AREA LINES (style=lined) ---
GRAPHS, FUR2 2013 VCAA 2
Students at the camp can participate in two different watersport activities: canoeing and surfing.
The cost of canoeing is $30 per hour and the cost of surfing is $20 per hour.
The budget allows each student to spend up to $200, in total, on watersport activities.
The way in which a student decides to spend the $200 is described by the following inequality.
30 × hours canoeing + 20 × hours surfing ≤ 200
- Hillary wants to spend exactly two hours canoeing during the camp.
Calculate the maximum number of hours she could spend surfing. (1 mark)
- Dennis would like to spend an equal amount of time canoeing and surfing.
If he spent a total of $200 on these activities, determine the maximum number of hours he could spend on each activity. (1 mark)
GRAPHS, FUR2 2013 VCAA 1
The distance-time graph below shows the first two stages of a bus journey from a school to a camp.
- At what constant speed, in kilometres per hour, did the bus travel during stage 1 of the journey? (1 mark)
- For how many minutes did the bus stop during stage 2 of the journey? (1 mark)
The third stage of the journey is missing from the graph.
During stage 3, the bus continued its journey to the camp and travelled at a constant speed of 60 km/h for one hour.
- Draw a line segment on the graph above to represent stage 3 of the journey. (1 mark)
- Find the average speed of the bus over the three hours.
Write your answer in kilometres per hour. (1 mark)
The distance, `D` km, of the bus from the school, `t` hours after departure is given by
`D = {(100t 0 ≤ t ≤ 1.5), (150 1.5 ≤ t ≤ 2), (60t + k 2≤ t ≤ 3):}`
- Determine the value of `k`. (1 mark)
GRAPHS, FUR2 2015 VCAA 1
Ben is flying to Japan for a school cultural exchange program.
The graph below shows the cost of a particular flight to Japan, in dollars, on each day in February.
- What is the cost, in dollars, of this flight to Japan on 19 February? (1 mark)
- On how many days in February is the cost of this flight to Japan more than $1000? (1 mark)
Algebra, MET2 2014 VCAA 1
The population of wombats in a particular location varies according to the rule `n(t) = 1200 + 400 cos ((pi t)/3)`, where `n` is the number of wombats and `t` is the number of months after 1 March 2013.
- Find the period and amplitude of the function `n`. (2 marks)
--- 3 WORK AREA LINES (style=lined) ---
- Find the maximum and minimum populations of wombats in this location. (2 marks)
--- 2 WORK AREA LINES (style=lined) ---
- Find `n(10)`. (1 mark)
--- 1 WORK AREA LINES (style=lined) ---
- Over the 12 months from 1 March 2013, find the fraction of time when the population of wombats in this location was less than `n(10)`. (2 marks)
--- 6 WORK AREA LINES (style=lined) ---
GRAPHS, FUR2 2006 VCAA 1
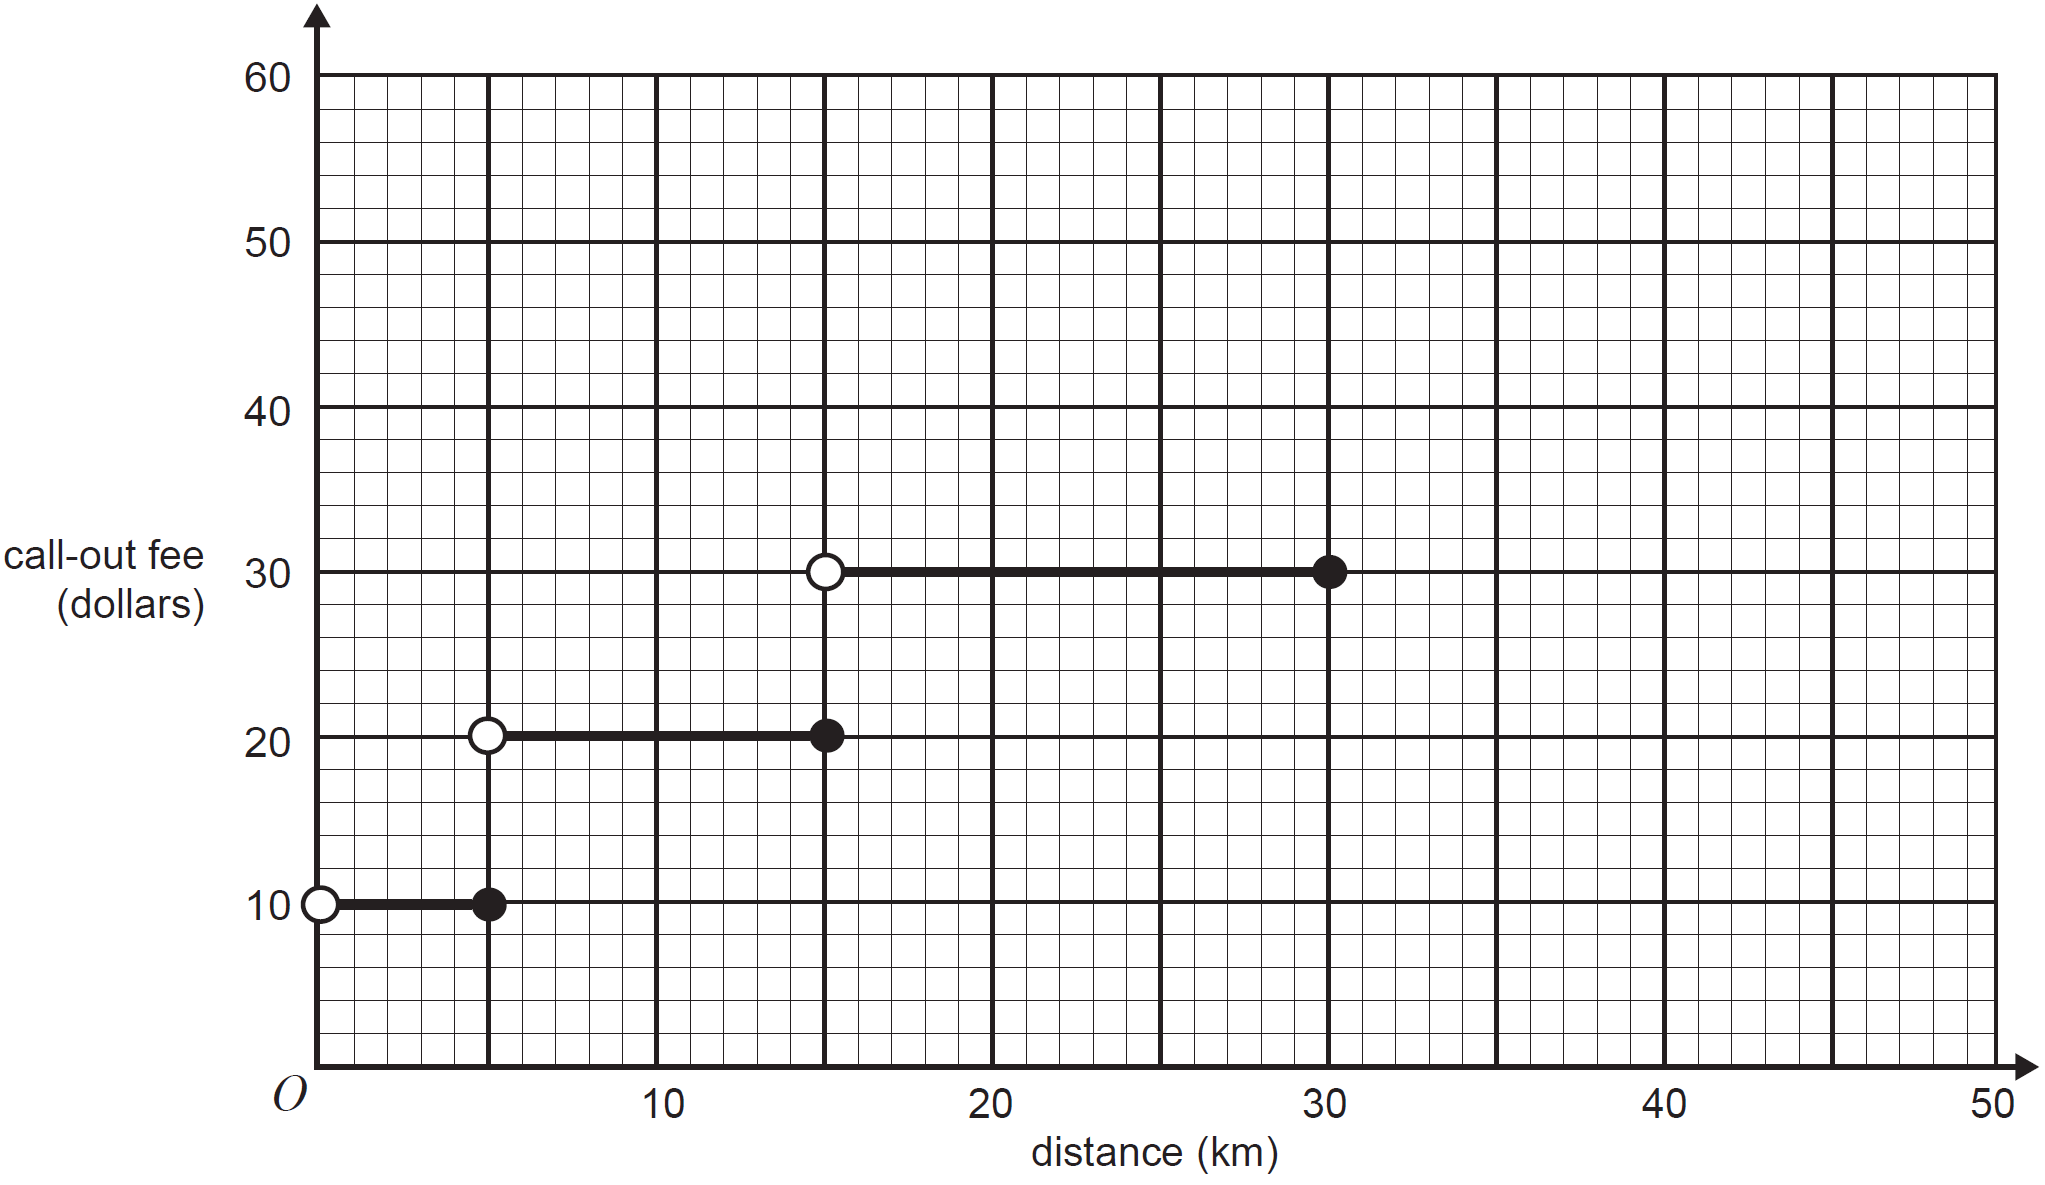
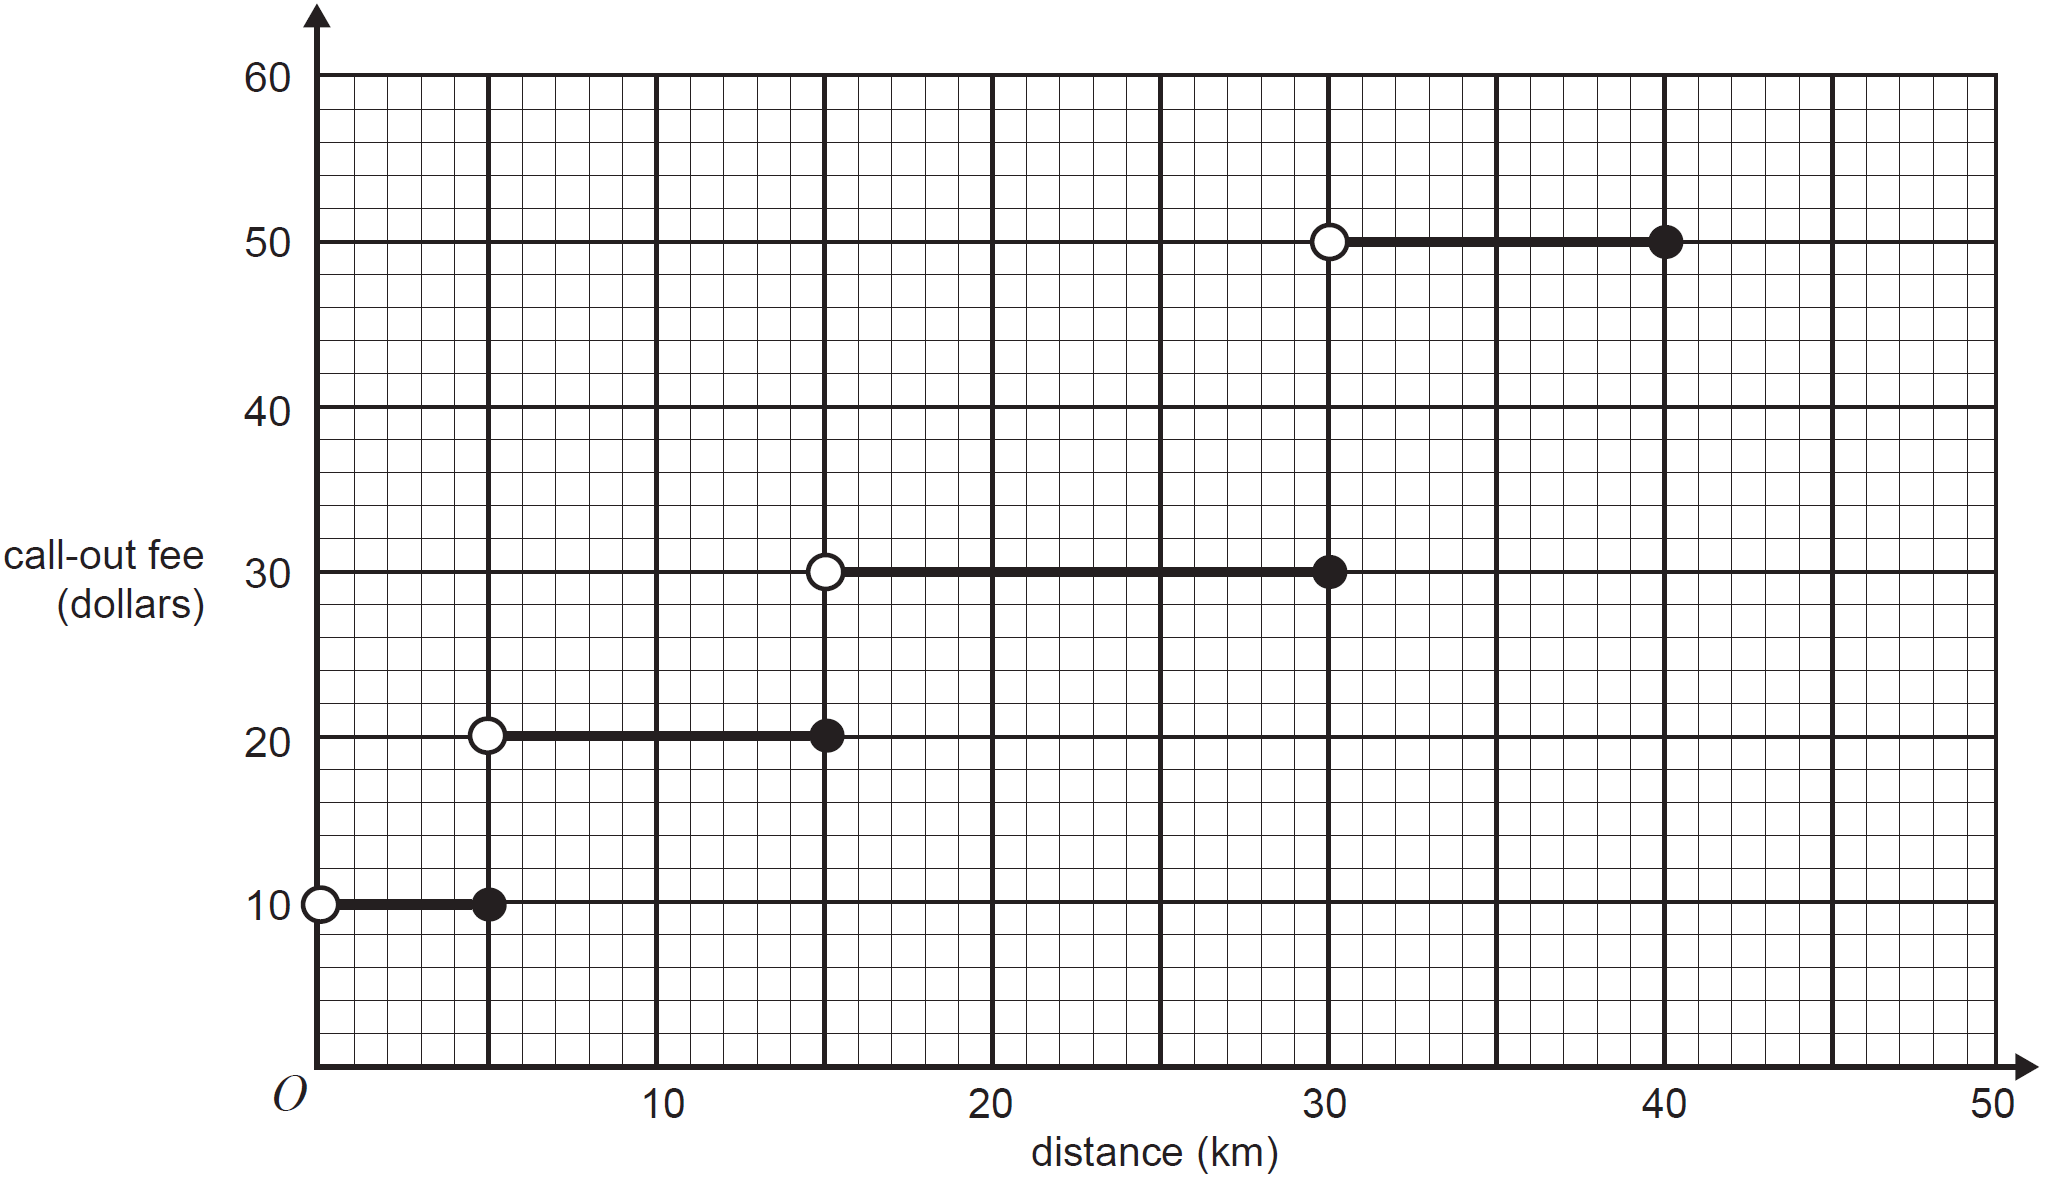
Harry operates a mobile pet care service. The call-out fee charged depends on the distance he has to travel to tend to a pet. The call-out fees for distances up to 30 km are shown on the graph below.
- According to this graph
- what is the call-out fee to travel a distance of 20 km? (1 mark)
- what is the maximum distance travelled for a call-out fee of $10? (1 mark)
A call-out fee of $50 is charged to travel distances of more than 30 km but less than or equal to 40 km.
- Draw this information on the graph above. (1 mark)
Calculus, MET2 2015 VCAA 1
Let `f: R -> R,\ \ f(x) = 1/5 (x-2)^2 (5-x)`. The point `P(1, 4/5)` is on the graph of `f`, as shown below.
The tangent at `P` cuts the y-axis at `S` and the x-axis at `Q.`
- Write down the derivative `f^{prime} (x)` of `f (x)`. (1 mark)
--- 3 WORK AREA LINES (style=lined) ---
- i. Find the equation of the tangent to the graph of `f` at the point `P(1, 4/5)`. (1 mark)
--- 5 WORK AREA LINES (style=lined) ---
ii. Find the coordinates of points `Q` and `S`. (2 marks)
--- 6 WORK AREA LINES (style=lined) ---
- Find the distance `PS` and express it in the form `sqrt b/c`, where `b` and `c` are positive integers. (2 marks)
--- 4 WORK AREA LINES (style=lined) ---
- Find the area of the shaded region in the graph above. (3 marks)
--- 4 WORK AREA LINES (style=lined) ---
GEOMETRY, FUR2 2007 VCAA 1-3
Question 1
Tessa is a student in a woodwork class.
The class will construct geometrical solids from a block of wood.
Tessa has a piece of wood in the shape of a rectangular prism.
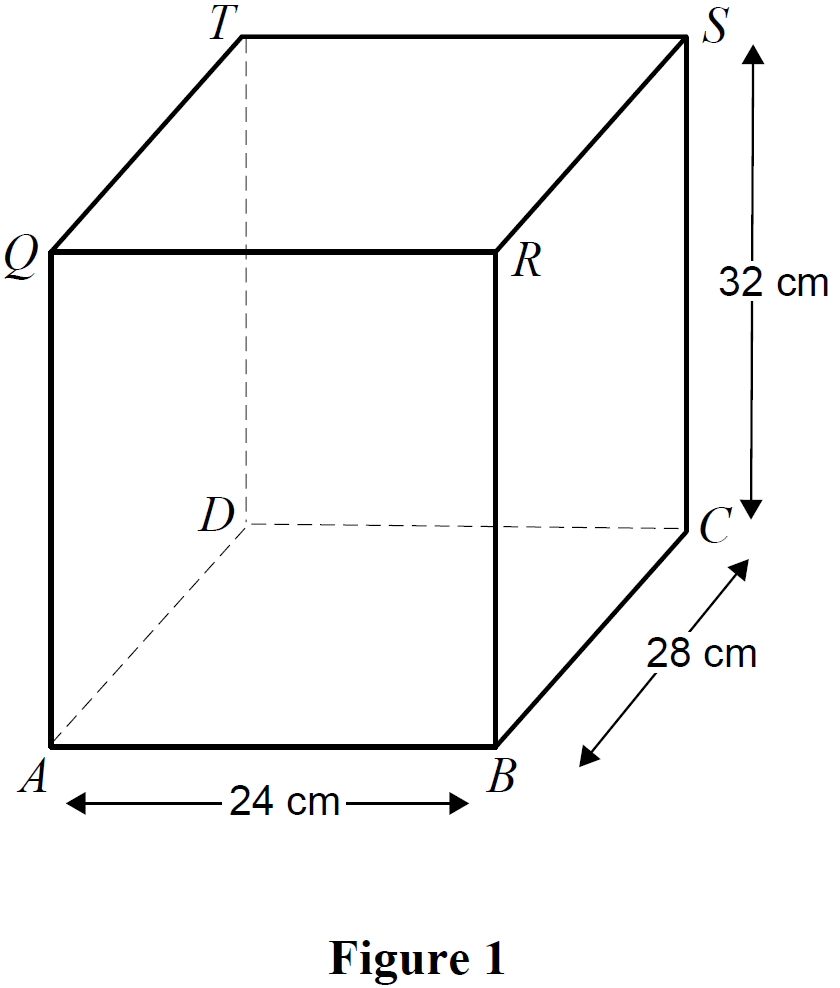
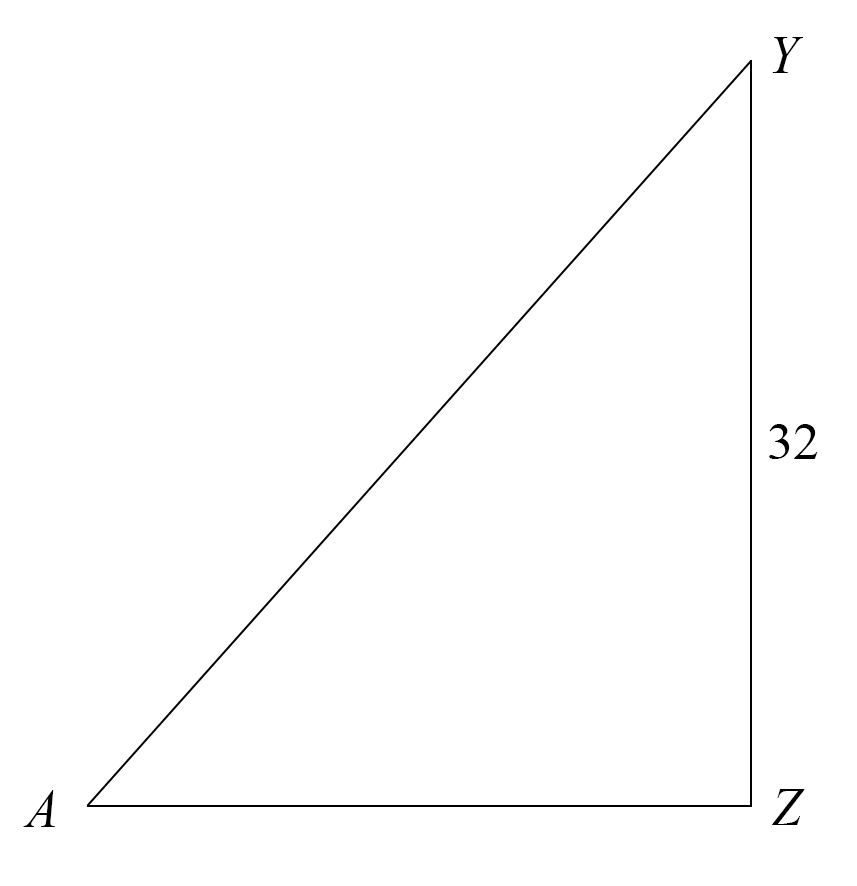
This prism, `ABCDQRST`, shown in Figure 1, has base length 24 cm, base width 28 cm and height 32 cm.
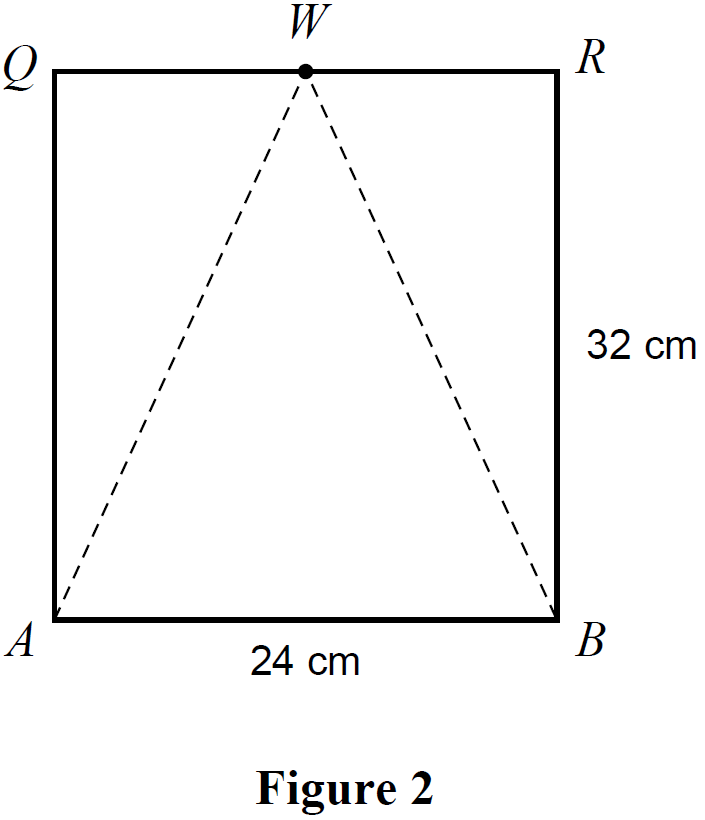
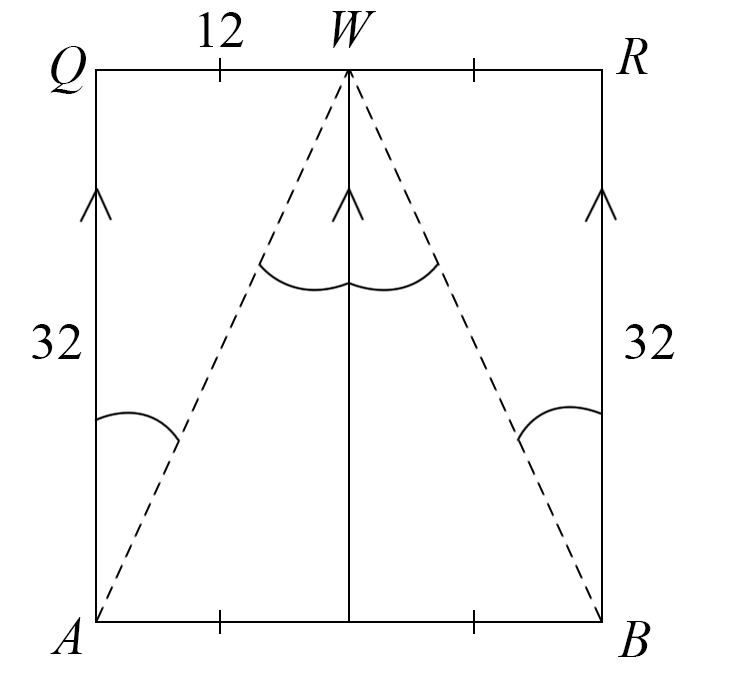
On the front face of Figure 1, `ABRQ`, Tessa marks point `W` halfway between `Q` and `R` as shown in Figure 2 below. She then draws line segments `AW` and `BW` as shown.
- Determine the length, in cm, of `QW`. (1 mark)
- Calculate the angle `WAQ`. Write your answer in degrees, correct to one decimal place. (1 mark)
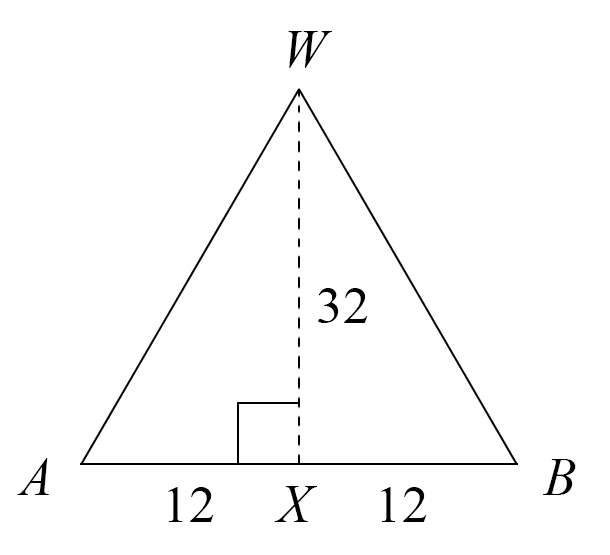
- Calculate the angle `AWB` correct to one decimal place. (1 mark)
- What fraction of the area of the rectangle `ABRQ` does the area of the triangle `AWB` represent? (1 mark)
Question 2
Tessa carves a triangular prism from her block of wood.
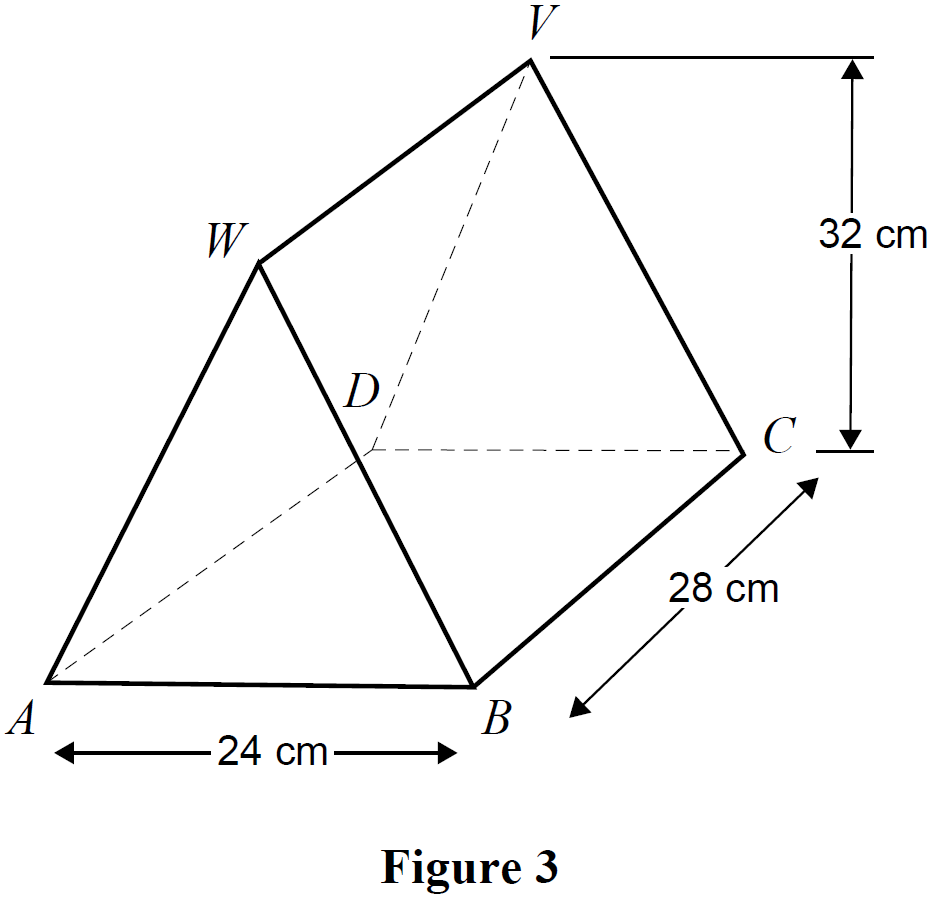
Using point `V`, halfway between `T` and `S` on the back face, `DCST`, of Figure 1, she constructs the triangular prism shown in Figure 3.
- Show that, correct to the nearest centimetre, length `AW` is 34 cm. (1 mark)
- Using length `AW` as 34 cm, find the total surface area, in cm², of the triangular prism `ABCDWV` in Figure 3. (2 marks)
Question 3
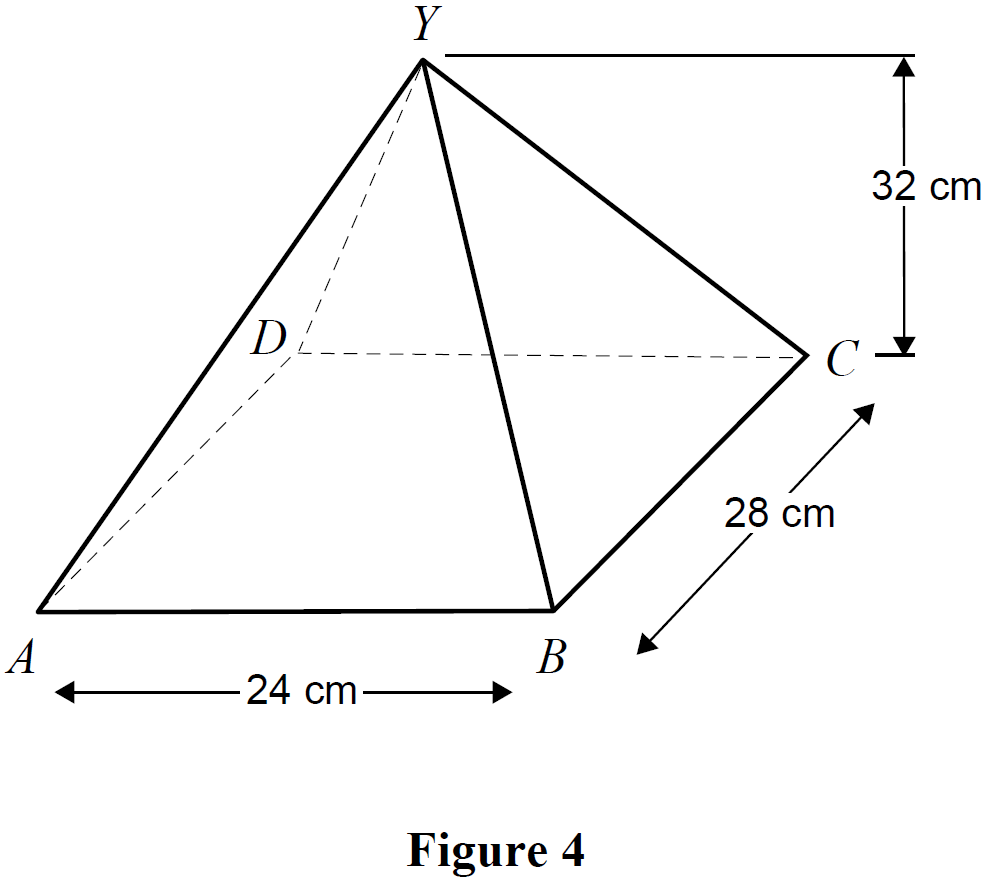
Tessa's next task is to carve the right rectangular pyramid `ABCDY` shown in Figure 4 below.
She marks a new point, `Y`, halfway between points `W` and `V` in Figure 3. She uses point `Y` to construct this pyramid.
- Calculate the volume, in cm³, of the pyramid `ABCDY` in Figure 4. (1 mark)
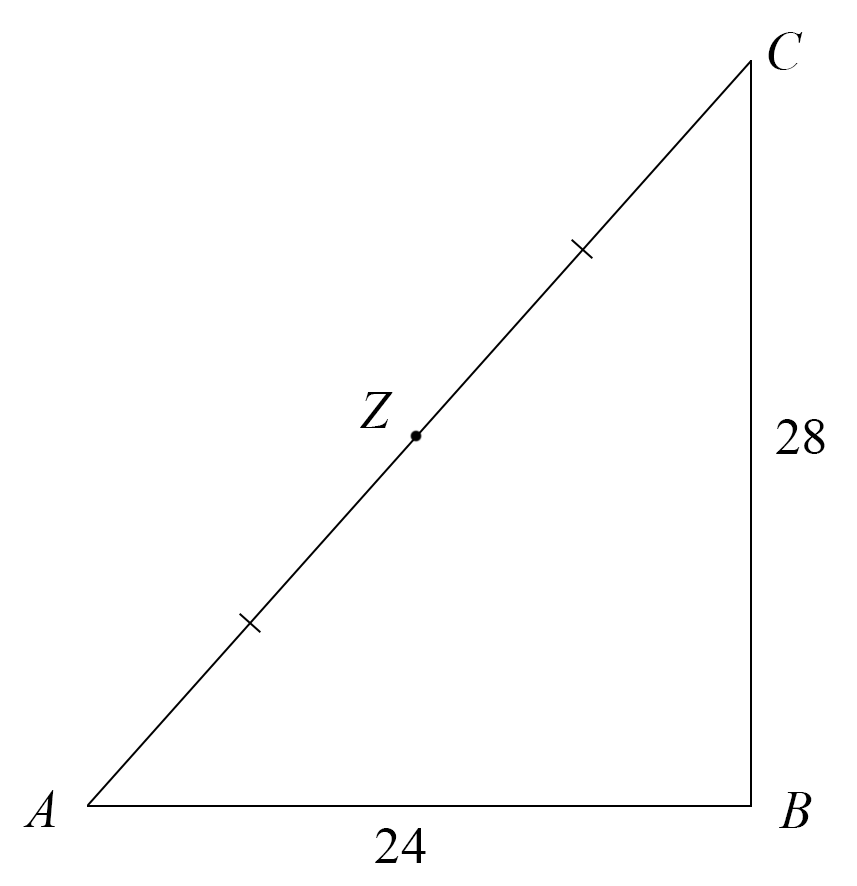
- Show that, correct to the nearest cm, length `AY` is 37 cm. (2 marks)
- Using `AY` as 37 cm, demonstrate the use of Heron's formula to calculate the area, in cm², of the triangular face `YAB`. (2 marks)
MATRICES, FUR2 2008 VCAA 1
Two subjects, Biology and Chemistry, are offered in the first year of a university science course.
The matrix `N` lists the number of students enrolled in each subject.
`N = [(460),(360)]{:(text(Biology)),(text(Chemistry)):}`
The matrix `P` lists the proportion of these students expected to be awarded an `A`, `B`, `C`, `D` or `E` grade in each subject.
`{:((qquadqquadqquadA,qquad\ B,qquadquadC,qquad\ D,qquadE)),(P = [(0.05,0.125,0.175,0.45,0.20)]):}`
- Write down the order of matrix `P`. (1 mark)
--- 1 WORK AREA LINES (style=lined) ---
- Let the matrix `R = NP`.
- i. Evaluate the matrix `R`. (1 mark)
--- 3 WORK AREA LINES (style=lined) ---
- ii. Explain what the matrix element `R_24` represents. (1 mark)
--- 2 WORK AREA LINES (style=lined) ---
- Students enrolled in Biology have to pay a laboratory fee of $110, while students enrolled in Chemistry pay a laboratory fee of $95.
- i. Write down a clearly labelled row matrix, called `F`, that lists these fees. (1 mark)
--- 2 WORK AREA LINES (style=lined) ---
- ii. Show a matrix calculation that will give the total laboratory fees, `L`, paid in dollars by the students enrolled in Biology and Chemistry. Find this amount. (1 mark)
--- 3 WORK AREA LINES (style=lined) ---
MATRICES, FUR2 2012 VCAA 1
Matrix `F` below shows the flight connections for an airline that serves four cities, Anvil (`A`), Berga (`B`), Cantor (`C`) and Dantel (`D`).
`{:(qquad qquad qquad qquad quad text(from)),((qquad qquad quad\ A,B,C,D)),(F = [(0\ ,1\ ,0\ ,0),(1,0,1,0),(0,0,0,1),(0,1,0,0)]):}{:(),(),(A),(B),(C),(D):}{:(),(qquad text(to)):}`
In this matrix, the `1` in column `C` row `B`, for example, indicates that, using this airline, you can fly directly from Cantor to Berga. The `0` in column `C` row `D`, for example, indicates that you cannot fly directly from Cantor to Dantel.
- Complete the following sentence.
- On this airline, you can fly directly from Berga to ________ and ________. (1 mark)
--- 0 WORK AREA LINES (style=lined) ---
- List the route that you must follow to fly from Anvil to Cantor. (1 mark)
--- 1 WORK AREA LINES (style=lined) ---
- Evaluate the matrix product `G = KF`, where `K = [1,1,1,1]`. (1 mark)
--- 3 WORK AREA LINES (style=lined) ---
- In the context of the problem, what information does matrix `G` contain? (1 mark)
--- 3 WORK AREA LINES (style=lined) ---
CORE, FUR2 2008 VCAA 1
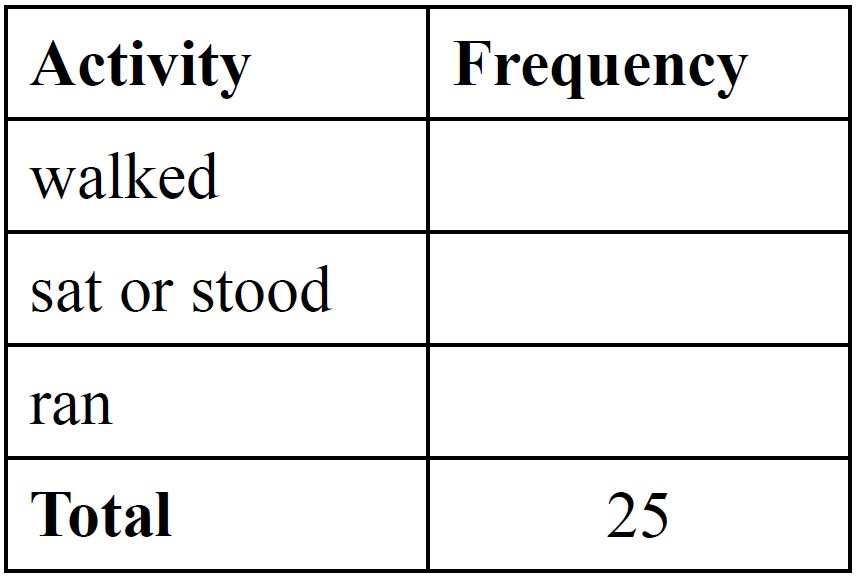
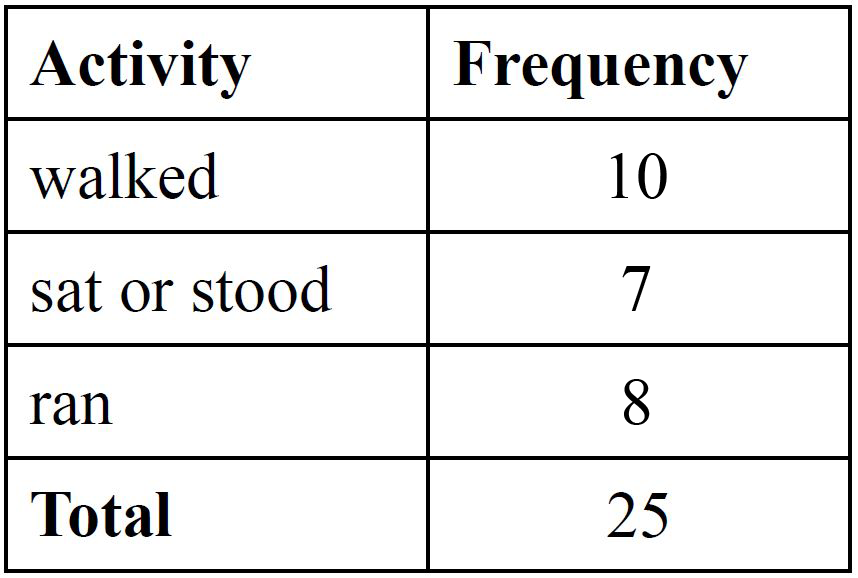
In a small survey, twenty-five Year 8 girls were asked what they did (walked, sat, stood, ran) for most of the time during a typical school lunch time.
Their responses are recorded below.
`{:(text(sat),text(stood),text(sat),text(ran),text(sat)),(text(walked ),text(walked ),text(sat),text(walked ),text(ran)),(text(sat),text(walked),text(walked ),text(walked),text(ran)),(text(walked),text(ran),text(walked),text(ran),text(walked)),(text(ran),text(sat),text(ran),text(ran),text(walked)):}`
Use the data to
MATRICES, FUR2 2015 VCAA 1
Students in a music school are classified according to three ability levels: beginner (`B`), intermediate (`I`) or advanced (`A`).
Matrix `S_0`, shown below, lists the number of students at each level in the school for a particular week.
`S_0 = [(20), (60), (40)] {:(B), (I), (A):}`
- How many students in total are in the music school that week? (1 mark)
--- 1 WORK AREA LINES (style=lined) ---
The music school has four teachers, David (`D`), Edith (`E`), Flavio (`F`) and Geoff (`G`).
Each teacher will teach a proportion of the students from each level, as shown in matrix `P` below.
`{:(qquadqquadqquad{:(Dquad,Eqquad,Fqquad,G):}),(P = [(0.25,0.5,0.15,0.1)]):}`
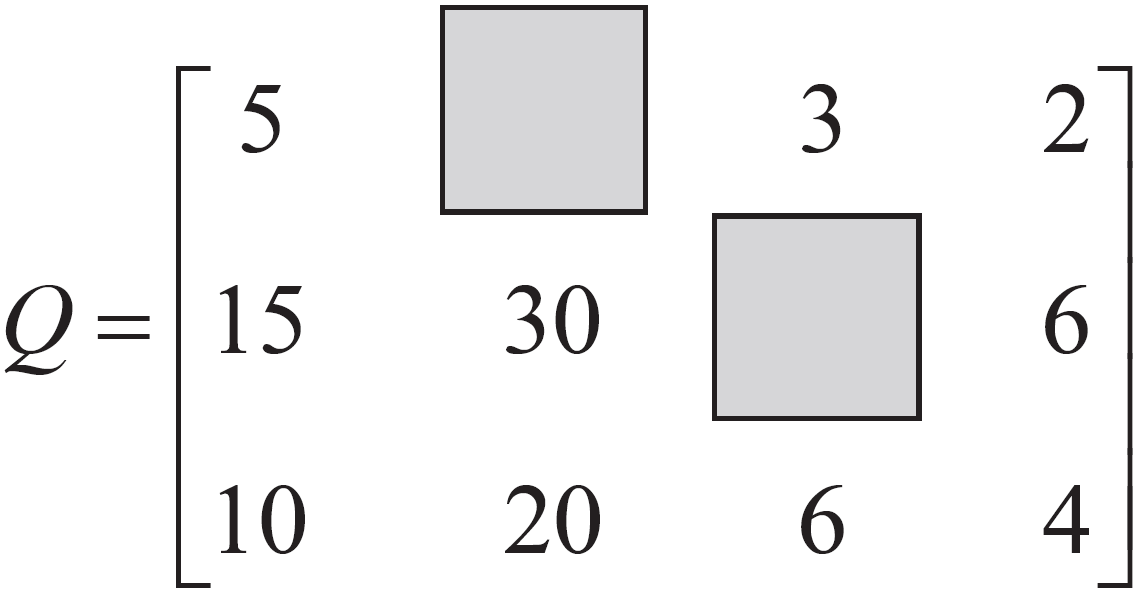
The matrix product, `Q = S_0P`, can be used to find the number of students from each level taught by each teacher.
- i. Complete matrix `Q`, shown below, by writing the missing elements in the shaded boxes. (1 mark)
--- 0 WORK AREA LINES (style=lined) ---
- ii. How many intermediate students does Edith teach? (1 mark)
--- 1 WORK AREA LINES (style=lined) ---
The music school pays the teachers $15 per week for each beginner student, $25 per week for each intermediate student and $40 per week for each advanced student.
These amounts are shown in matrix `C` below.
`{:(qquad qquad quad{:(B quad, I quad,A):}),(C = [(15, 25, 40)]):}`
The amount paid to each teacher each week can be found using a matrix calculation.
- i. Write down a matrix calculation in terms of `Q` and `C` that results in a matrix that lists the amount paid to each teacher each week. (1 mark)
--- 1 WORK AREA LINES (style=lined) ---
- ii. How much is paid to Geoff each week? (1 mark)
--- 3 WORK AREA LINES (style=lined) ---
CORE, FUR2 2009 VCAA 1
Table 1 shows the number of rainy days recorded in a high rainfall area for each month during 2008.
The dot plot below displays the distribution of the number of rainy days for the 12 months of 2008.
- Circle the dot on the dot plot that represents the number of rainy days in April 2008. (1 mark)
--- 0 WORK AREA LINES (style=lined) ---
- For the year 2008, determine
- i. the median number of rainy days per month. (1 mark)
--- 2 WORK AREA LINES (style=lined) ---
- ii. the percentage of months that have more than 10 rainy days. Write your answer correct to the nearest per cent. (1 mark)
--- 3 WORK AREA LINES (style=lined) ---
- « Previous Page
- 1
- …
- 6
- 7
- 8
- 9
- 10
- 11
- Next Page »