SmarterEd

Aussie Maths & Science Teachers: Save your time with SmarterEd

  • Login
  • Get Help
  • About

GEOMETRY, FUR1 2007 VCAA 1 MC

GEOMETRY, FUR1 2007 VCAA 1 MC

For the triangle shown, the value of  `cos theta^@`  is equal to

A.   `6/10`

B.    `6/8`

C.   `8/10`

D.   `10/8`

E.    `8/6`

Show Answers Only

`A`

Show Worked Solution
`cos theta` `= text(adj)/text(hyp)`
  `= 6/10`

 
`=>  A`

Filed Under: Right-Angled Trig and Angle Properties Tagged With: Band 3, smc-273-10-SOHCAHTOA

FS Comm, 2UG SM-Bank 02

Calculate the cost of a call of duration  `6`  minutes and  `20`  seconds, given that there is a connection fee of  `35`  cents and a call rate of  `37`  cents per  `30`  second block or part thereof.   (2 marks)


Show Answers Only

`$5.16`

Show Worked Solution

`text(Connection fee) = 35\ text(cents)`

`text(30 second blocks in 6m 20s)=13`

`=> text(Call rate total)` `= 13 xx 37`
  `= 481\ text(cents)`
`:.\ text(Total cost of call)` `= 35 + 481`
  `= 516\ text(cents)`
  `= $5.16`


Filed Under: FS Communication Tagged With: Band 3

FS Comm, 2UG SM-Bank 04

Murray is a photographer and has recently purchased an external hard drive with a  `500 text(GB)`  capacity.

If the average size of his photographic files is  `4.0 text(MB)`, how many should he expect to fit on the hard drive?   (2 marks)


Show Answers Only

`text(128 000 files)`

Show Worked Solution

`text(Hard drive capacity) = 500 xx 2^30\ text(bytes)`

`text(Average file size) = 4.0 xx 2^20\ text(bytes)`

`:.\ text(# Files)` `= (500 xx 2^30)/(4.0 xx 2^20)`
  `= 128\ 000`


`:.\ text(Murray should expect to fit 128 000 files.)`

Filed Under: FS Communication Tagged With: Band 3

Algebra, 2UG AM3 SM-Bank 04

Solve these simultaneous equations to find the values of  `x`  and  `y`.  

 `y = 3x - 2`

`x + 2y + 18 = 0`   (3 marks)

Show Answers Only

`x = -2 ,\ y = -8`

Show Worked Solution

`text(Solution 1 – Substitution)`

`y = 3x – 2\ \ \ \ \ …\ text{(i)}`

`x + 2y + 18 = 0\ \ \ \ \ …\ text{(ii)}`

`text(Substitute)\ \ y = 3x – 2\ \ text{into (ii)}`

`x + 2(3x – 2) + 18` `= 0`
`x + 6x – 4 + 18` `= 0`
`7x` `= -14`
`x` `= -2`

`text(Substitute)\ \ x = -2\ \ text{into (i)}`

`y` `= 3(-2) – 2`
  `= -8`

`:.\ text(Solution is)\ x = -2,\ y = -8`


`text(Alternative Solution – Elimination)`

`y = 3x – 2\ \ \ \ \ …\ text{(i)}`

`x + 2y + 18 = 0\ \ \ \ \ …\ text{(ii)}`

`text{Multiply (i)} xx 2`

`2y` `= 6x – 4`
`6x – 2y – 4` `= 0\ …\ text{(iii)}`

`text{(ii) + (iii)}`

`7x + 14` `= 0`
`x` `= -2`
`y` `= -8\ \ text{(see Solution 1)}`


Filed Under: Linear and Other Equations Tagged With: Band 3

Algebra, 2UG AM3 SM-Bank 03

Simplify  `(a(b^2)^3)/(a^2b)`   (2 marks)

Show Answers Only

`b^5/a`

Show Worked Solution
`(a(b^2)^3)/(a^2b)` `= (ab^6)/(a^2b)`
  `= b^5/a`


Filed Under: Index and Log Laws Tagged With: Band 3

Algebra, 2UG AM3 SM-Bank 02

Solve for  `w`  given

`w/3 - w/7 = -1`   (2 marks)


Show Answers Only

`w = -5.25`

Show Worked Solution
`21 (w/3) – 21 (w/7)` `= 21 xx -1`
`7w – 3w` `= -21`
`4w` `= -21`
`w` `= -5.25`


Filed Under: Linear and Other Equations Tagged With: Band 3

Algebra, 2UG AM3 SM-Bank 01

Solve for  `x`  given

`x/6 + x/4 = 5`   (2 marks)


Show Answers Only

`x = 12`

Show Worked Solution
`x/6 + x/4` `= 5`
`24 (x/6) + 24 (x/4)` `= 24 xx 5`
`4x + 6x` `= 120`
`10x` `= 120`
`x` `= 12`


Filed Under: Linear and Other Equations Tagged With: Band 3

Algebra, STD2 A4 2007 HSC 27a

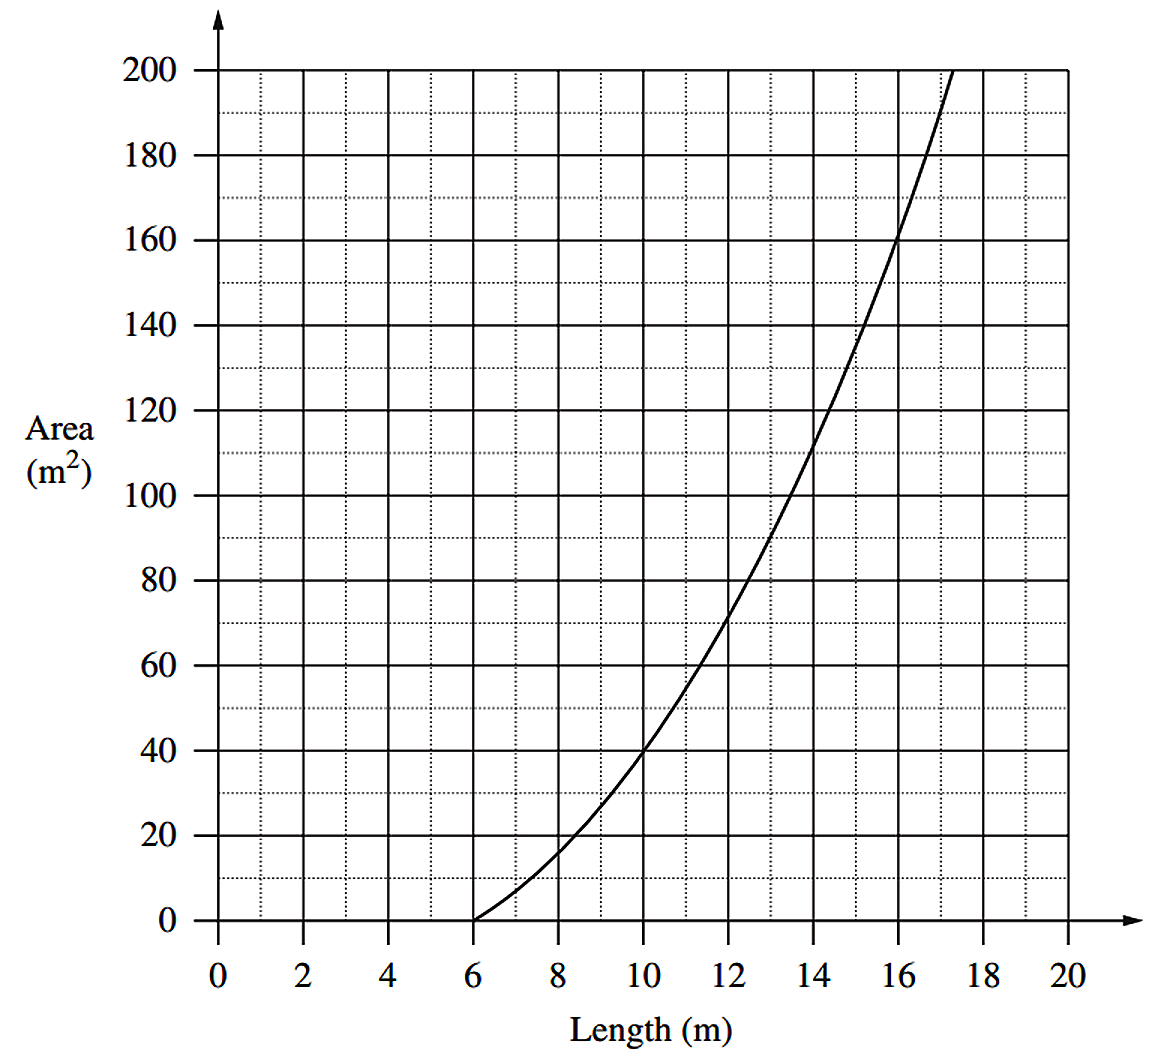
   A rectangular playing surface is to be constructed so that the length is 6 metres more than the width.

  1. Give an example of a length and width that would be possible for this playing surface.   (1 mark)

    --- 2 WORK AREA LINES (style=lined) ---

  2. Write an equation for the area (`A`) of the playing surface in terms of its length (`l`).   (1 mark)

    --- 1 WORK AREA LINES (style=lined) ---


    A graph comparing the area of the playing surface to its length is shown.


  3. Why are lengths of 0 metres to 6 metres impossible?   (1 mark)

    --- 2 WORK AREA LINES (style=lined) ---

  4. What would be the dimensions of the playing surface if it had an area of 135 m²?  (2 marks)

    --- 4 WORK AREA LINES (style=lined) ---


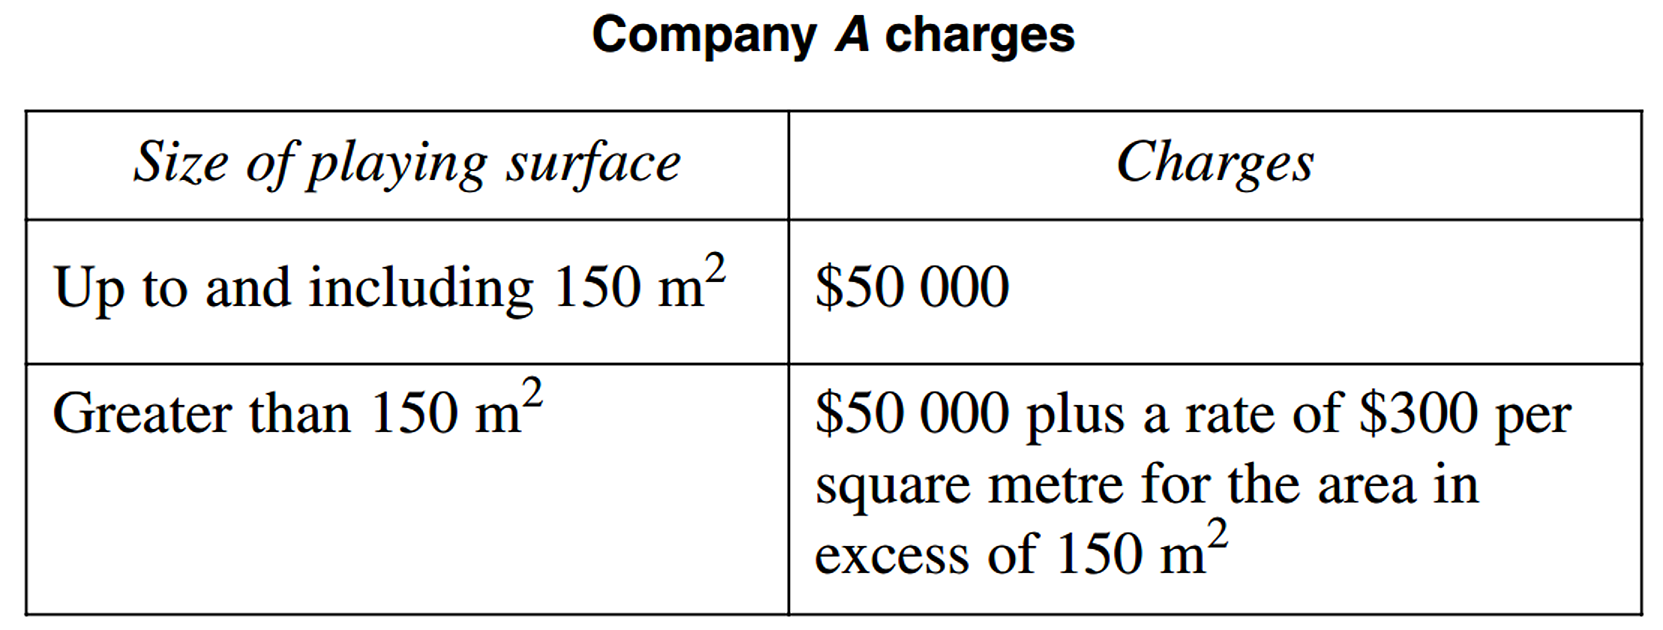
    Company `A` constructs playing surfaces.


  5. Draw a graph to represent the cost of using Company `A` to construct all playing surface sizes up to and including 200 m².


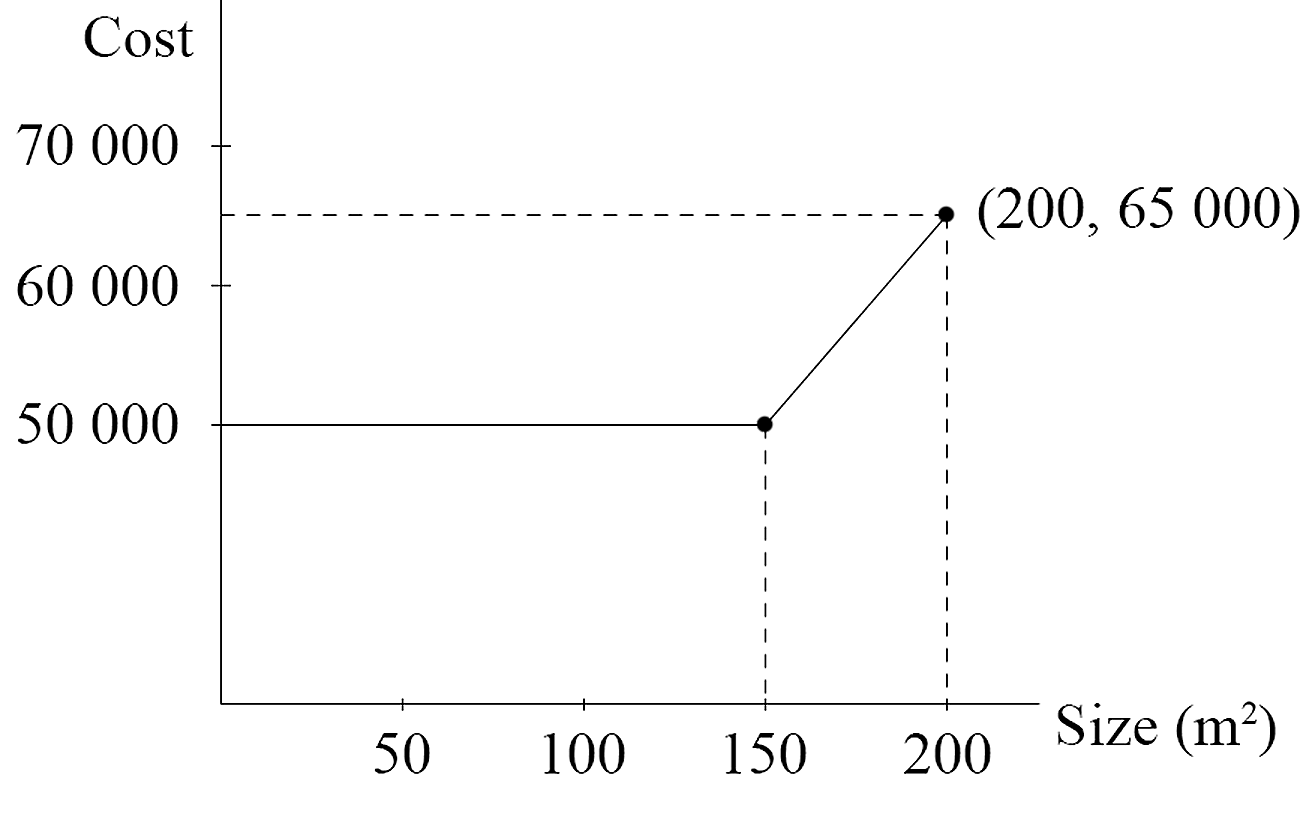
    Use the horizontal axis to represent the area and the vertical axis to represent the cost.   (2 marks)

    --- 8 WORK AREA LINES (style=lined) ---

  6. Company `B` charges a rate of $360 per square metre regardless of size. 
  7. Which company would charge less to construct a playing surface with an area of 135 m²


    Justify your answer with suitable calculations.   (1 mark)

    --- 2 WORK AREA LINES (style=lined) ---

Show Answers Only
  1. `text(One possibility is a length of 10 m, and a width)`


    `text{of 4 m (among many possibilities).}`

  2. `A =  l (l – 6)\ \ text(m²)`
  3. `text(Given the length must be 6 m more than)`


    `text(the width, it follows that the length)`


    `text(must be greater than 6 m.)`

  4. `text(15 m × 9 m)`
  5.   
       
     
  6. `text(Proof)\ \ text{(See worked solutions)}`
Show Worked Solution

i.   `text(One possibility is a length of 10 m, and a width)`

`text{of 4 m (among many possibilities).}`


ii.  `text(Length) = l\ text(m)`

`text(Width) = (l – 6)\ text(m)`

`:.\ A` `= l (l – 6)`


iii.  `text(Given the length must be 6m more than the width,)`

 `text(it follows that the length must be greater than 6 m)`

`text(so that the width is positive.)`


iv.  `text(From the graph, an area of 135 m² corresponds to)`

`text(a length of 15 m.)`

`:.\ text(The dimensions would be 15 m × 9 m.)`


v.   


vi.  `text(Company)\ A\ text(cost) = $50\ 000`

`text(Company)\ B\ text(cost)` `= 135 xx 360`
  `= $48\ 600`


`:.\ text(Company)\ B\ text(would charge $1400 less)`

`text(than Company)\ A.`

Filed Under: Breakeven and Financial modelling, Non-Linear: Inverse and Other Problems (Std 2), Perimeter/Area problem Tagged With: Band 3, Band 4, Band 5, page-break-before-question, smc-795-20-Other Relationship, smc-795-30-Limitations

GEOMETRY, FUR1 2011 VCAA 4 MC

In triangle  `ACB`,  `/_ CAB = 60^@`  and  `/_ ABC = 80^@` 

The length of side  `AB = 50\text(m.)`


The length of side  `AC`  is closest to

A.    `57\ text(m)`

B.    `67\ text(m)`

C.    `77\ text(m)`

D.    `81\ text(m)`

E.   `100\ text(m)`

Show Answers Only

`C`

Show Worked Solution
`/_  ACB` ` = 180 – (60 + 80) \ \ text{(angle sum of}\ Delta ABC text{)}`
  ` = 40 ^@`


`text(Using sine rule:)`

`(AC) / (sin 80^@)` `= 50/(sin 40^@)`
`:. AC`  `= (50 xx sin 80^@) / (sin 40^@)`
  `= 76.60…\ \ text(m)`

 
`=> C`

Filed Under: Non-Right-Angled Trig Tagged With: Band 3, smc-3589-10-Sine rule

GEOMETRY, FUR1 2013 VCAA 2 MC

The distances from a kiosk to points `A` and `B` on opposite sides of a pond are found to be 12.6 m and 19.2 m respectively.

The angle between the lines joining these points to the kiosk is 63°.
 

 The distance, in m, across the pond between points `A` and `B` can be found by evaluating

A.  `1/2 xx 12.6 xx 19.2 xx sin(63°)`

B.  `{19.2 xx sin(63°)}/12.6`

C.  `sqrt(12.6^2 + 19.2^2)`

D.  `sqrt(12.6^2 + 19.2^2 - 2 xx 12.6 xx 19.2 xx cos(63°)`

E.  `sqrt{s(s - 12.6)(s - 19.2)(s - 63)} , text(where)\ s = 1/2 (12.6 + 10.2 + 63)` 

Show Answers Only

`D`

Show Worked Solution

`text(Using the cosine rule:)`

`(AB)^2` `= 12.6^2 xx 19.2^2 – 2 xx 12.6 xx 19.2 xx cos(63°)`
`:. AB` `= sqrt{12.6^2 xx 19.2^2 – 2 xx 12.6 xx 19.2 xx cos(63°)}`

 
`=>D`

Filed Under: Non-Right-Angled Trig Tagged With: Band 3, smc-3589-20-Cosine rule, smc-3589-30-Heron's formula

GEOMETRY, FUR1 2013 VCAA 1 MC

The perimeter of a regular pentagon is 100 cm.

The side length of this pentagon, in cm, is

A.      `5`

B.    `10`

C.    `20`

D.    `25`

E.    `50`

Show Answers Only

`C`

Show Worked Solution

`text(A pentagon has 5 sides)`

`∴ text(Side length) = 100/5 = 20\ \ text(cm)`

`=>C`

Filed Under: Perimeter, Area and Volume Tagged With: Band 3

Probability, STD2 S2 2007 HSC 25c

In a stack of 10 DVDs, there are 5 rated PG, 3 rated G and 2 rated M.

  1. A DVD is selected at random. What is the probability that it is rated M?   (1 mark)

    --- 2 WORK AREA LINES (style=lined) ---

Grant chooses two DVDs at random from the stack. Copy or trace the tree diagram into your writing booklet.
 

  1. Complete the tree diagram by writing the correct probability on each branch.   (2 marks)

    --- 0 WORK AREA LINES (style=lined) ---

  2. Calculate the probability that Grant chooses two DVDs with the same rating.   (2 marks)

    --- 4 WORK AREA LINES (style=lined) ---

Show Answers Only
  1. `1/5`
  2.  
  3. `14/45`
Show Worked Solution

i.    `text(5 PG, 3 G, 2 M)`

`P text{(M)} = 2/10 = 1/5` 


ii.   


iii.  `P text{(same rating)}`

`= P text{(PG, PG)} + P text{(G, G)} + P text{(M, M)}`

`= (1/2 xx 4/9) + (3/10 xx 2/9) + (1/5 xx 1/9)`

`= 2/9 + 1/15 + 1/45`

`= 14/45`

Filed Under: Multi-Stage Events, Multi-stage Events, Multi-Stage Events (Std 2), Single and Multi-Stage Events (Std 1) Tagged With: Band 3, Band 5, num-title-ct-corea, num-title-qs-hsc, smc-1135-10-Probability Trees, smc-4238-10-Dependent events, smc-4238-50-Probability trees, smc-829-10-Probability Trees

Statistics, STD2 S1 2007 HSC 24d

Barry constructed a back-to-back stem-and-leaf plot to compare the ages of his students.


  1. Write a brief statement that compares the distribution of the ages of males and females from this set of data.   (1 mark)

    --- 2 WORK AREA LINES (style=lined) ---

  2. What is the mode of this set of data?   (1 mark)

    --- 1 WORK AREA LINES (style=lined) ---

  3. Liam decided to use a grouped frequency distribution table to calculate the mean age of the students at Barry’s Ballroom Dancing Studio. 


    For the age group 30 - 39 years, what is the value of the product of the class centre and the frequency?   (2 marks)

    --- 3 WORK AREA LINES (style=lined) ---

  4. Liam correctly calculated the mean from the grouped frequency distribution table to be 39.5.


    Caitlyn correctly used the original data in the back-to-back stem-and-leaf plot and calculated the mean to be 38.2. 


    What is the reason for the difference in the two answers?   (1 mark)

    --- 2 WORK AREA LINES (style=lined) ---

Show Answers Only
  1. `text(More males attend than females and a higher proportion)`
    `text(of those are younger males, with the distribution being)`
    `text(positively skewed. Female attendees are generally older)`
    `text(and have a negatively skewed distribution.)`
  2. `text(Mode) = 64\ \ \ text{(4 times)}`
  3. `172.5`
  4. `text(The difference in the answers is due to the class)`
  5. `text(centres used in group frequency tables distorting)`
  6. `text(the mean value from the exact data.)`
Show Worked Solution
i. `text(More males attend than females and a higher proportion)`
  `text(of those are younger males, with the distribution being)`
  `text(positively skewed. Female attendees are generally older)`
  `text(and have a negatively skewed distribution.)`


ii. `text(Mode) = 64\ \ \ text{(4 times)}`


iii. `text(Class centre)` `= (30 + 39)/2`
    `= 34.5`
  `text(Frequency) = 5`

 
`:.\ text(Class centre) xx text(frequency)`

`= 34.5 xx 5`

`= 172.5`
 

iv. `text(The difference in the answers is due to the class)`
  `text(centres used in group frequency tables distorting)`
  `text(the mean value from the exact data.)`

Filed Under: Bar Charts, Histograms and Other Graphs (Std 1), Other Chart Types (Y12), Other Charts (Std 2), Other Charts (Std2-2027), Stem & Leaf, Box & Whisker Tagged With: Band 3, Band 4, Band 5, common-content, smc-1128-26-Back-to-back Stem and Leaf, smc-6311-20-Back-to-Back Stem-and-Leaf, smc-822-30-Back-to-Back Stem and Leaf, smc-998-30-Back-to-Back Stem and Leaf

Algebra, STD2 A1 2007 HSC 24b

The distance in kilometres (`D`) of an observer from the centre of a thunderstorm can be estimated by counting the number of seconds (`t`) between seeing the lightning and first hearing the thunder.

Use the formula  `D = t/3`  to estimate the number of seconds between seeing the lightning and hearing the thunder if the storm is 1.2 km away.   (1 mark)

--- 2 WORK AREA LINES (style=lined) ---

Show Answers Only

`3.6\ text(seconds)`

Show Worked Solution

`D = t/3`

`text(When)\ \ D = 1.2,`

`t/3` `= 1.2`
`t` `= 3.6\ text(seconds)`

Filed Under: AM1 - Algebra (Prelim), Linear, Substitution and Other Equations (Std 1), Substitution and Other Equations (Std 2), Substitution and Other Equations (Std2-2027) Tagged With: Band 3, num-title-ct-corea, num-title-qs-hsc, smc-1116-20-Rearrange and Substitute, smc-4362-30-Rearrange and substitute, smc-6234-20-Rearrange and Substitute, smc-789-20-Rearrange and Substitute

Statistics, STD2 S1 2007 HSC 24a

Consider the following set of scores:

`3, \ 5, \ 5, \ 6, \ 8, \ 8, \ 9, \ 10, \ 10, \ 50.` 

  1. Calculate the mean of the set of scores.   (1 mark)

    --- 1 WORK AREA LINES (style=lined) ---

  2. What is the effect on the mean and on the median of removing the outlier?   (2 marks)

    --- 5 WORK AREA LINES (style=lined) ---

Show Answers Only
  1. `11.4`
  2. `text{If the outlier (50) is removed, the mean}`


    `text(would become lower.)`

  3.  

    `text(Median will NOT change.)`

Show Worked Solution

i.  `text(Total of scores)`

`= 3 + 5 + 5 + 6 + 8 + 8 + 9 + 10 + 10 +50`

`= 114`
 

`:.\ text(Mean) = 114/10 = 11.4`


ii.  `text(Mean)`

`text{If the outlier (50) is removed, the mean}`

`text(would become lower.)`
 

`text(Median)`

`text(The current median (10 data points))`

`= text(5th + 6th)/2 = (8 + 8)/2 = 8`

`text(The new median (9 data points))`

`=\ text(5th value)`

`= 8`
 

`:.\ text(Median will NOT change.)`

Filed Under: Data Analysis, Measures of Centre and Spread (Std2-2027), Summary Statistics - No Graph (Std 2), Summary Statistics - No graph (Y12), Summary Statistics (no graph), Summary Statistics (Std 1) Tagged With: Band 3, Band 4, common-content, num-title-ct-core, num-title-qs-hsc, smc-1131-10-Mean, smc-1131-20-Median and Mode, smc-4224-25-Mean, smc-4224-30-Outliers, smc-4224-50-Add/remove data, smc-6312-10-Mean, smc-6312-20-Median and Mode, smc-824-10-Mean, smc-824-20-Median and Mode, smc-999-10-Mean, smc-999-20-Median and Mode

Measurement, STD2 M1 2007 HSC 23b

A cylindrical water tank, of height 2 m, is placed in the ground at a school.

The radius of the tank is 3.78 metres. The hole is 2 metres deep. When the tank is placed in the hole there is a gap of 1 metre all the way around the side of the tank.


  1. When digging the hole for the water tank, what volume of soil was removed? Give your answer to the nearest cubic metre.  (3 marks)

    --- 6 WORK AREA LINES (style=lined) ---

  2. Sprinklers are used to water the school oval at a rate of 7500 litres per hour.   


    The water tank holds 90 000 litres when full. 


    For how many hours can the sprinklers be used before a full tank is emptied?   (1 mark)

    --- 2 WORK AREA LINES (style=lined) ---

  3. Water is to be collected in the tank from the roof of the school hall, which has an area of 400 m².


    During a storm, 20 mm of rain falls on the roof and is collected in the tank. 


    How many litres of water were collected?   (2 marks)

    --- 4 WORK AREA LINES (style=lined) ---

Show Answers Only
  1. `144\ text(m³)\ \ text{(nearest m³)}`
  2. `text(12 hours)`
  3. `8000\ text(litres)`
Show Worked Solution

i.  `V = pi r^2 h\ \ \ \ text(where)`

`h = 2\ text(and)\ r = 4.78\ text(m)`

`:.\ V` `= pi xx 4.78^2 xx 2`
  `= 143.56…`
  `= 144\ text(m³)\ \ text{(nearest m³)}`


ii.  `text(Total water) = 90\ 000\ text(litres)`

`text(Usage) = 7500\ \ text(litres/hr)`

`:.\ text(Hours before it is empty)`

`= (90\ 000)/7500`

`= 12\ text(hours)`


iii. `text(Water collected)`

`= 400 xx 0.020`

`= 8\ text(m²)`

`= 8000\ text(litres)`

Filed Under: Areas and Volumes (Harder), FS Resources, Perimeter, Area and Volume (Std 2), Perimeter, Area and Volume (Std2-2027) Tagged With: Band 3, Band 4, smc-6304-50-Volume (Circular Measure), smc-798-50-Volume (Circular Measure)

GEOMETRY, FUR1 2009 VCAA 2 MC

GEOMETRY, FUR1 2009 VCAA 2 MC

The area (in m2) of triangle `XYZ` can be found using Heron’s formula  `A = sqrt(s(s−a)(s−b)(s−c))`, with  `a = 1.92`,  `b = 8.24`,  `c = 9.20`  and  `s =`

A.     `4.40`

B.     `6.45`

C.     `9.20`

D.     `9.68`

E.   `19.36`

Show Answers Only

`D`

Show Worked Solution
`s` `= (a + b + c) / 2`
  `= (1.92 + 8.24 + 9.20) /2`
  `= 9.68`

 
`=>  D`

Filed Under: Non-Right-Angled Trig Tagged With: Band 3, smc-3589-30-Heron's formula

Financial Maths, STD2 F1 2007 HSC 23a

Lilly and Rose each have money to invest and choose different investment accounts.

The graph shows the values of their investments over time.


  1. How much was Rose’s original investment?  (1 mark)

    --- 1 WORK AREA LINES (style=lined) ---

  2. At the end of  6 years, which investment will be worth the most and by how much?  (2 marks)

    --- 4 WORK AREA LINES (style=lined) ---

  3. Lilly’s investment will reach a value of  $20 000  first.
  4. How much longer will it take Rose’s investment to reach a value of  $20 000?   (1 mark)

    --- 2 WORK AREA LINES (style=lined) ---

Show Answers Only
  1. `$5000`
  2. `text(Rose’s is worth $2000 more.)`
  3. `text(It takes Lilly 14 years to reach $20 000 and it takes)`


    `text{Rose 1 year longer (15 years) to reach the same value}`

Show Worked Solution

i.  `$5000\ text{(} y text(-intercept) text{)}`
 

ii.  `text(After 6 years,)`

`text(Lilly’s investment)` `= $9000`
`text(Rose’s investment)` `= $11\ 000`
`:.\ text(Rose’s is worth $2000 more.)`


iii.  `text(It takes Lilly 14 years to reach $20 000 and it)`

`text{takes Rose 1 year longer (15 years) to reach the}`

`text(same value.)`

Filed Under: Compound Interest and Shares (Std2), F2 Investment (Y12), FM2 - Investing, Simple Interest and S/L Depreciation (Std 1), Simple Interest and S/L Depreciation (Std 2) Tagged With: Band 2, Band 3, Band 4, smc-1108-30-i/r comparisons (incl. graphs), smc-1124-10-Simple Interest, smc-808-10-Simple Interest, smc-817-30-i/r comparisons (incl. graphs)

PATTERNS, FUR1 2009 VCAA 4 MC

The sum of the infinite geometric sequence  96, – 48, 24, –12, 6 . . .  is equal to

A.     `64` 

B.     `66`

C.     `68`

D.   `144`

E.   `192`

Show Answers Only

`A`

Show Worked Solution

`text(Sequence is)\ \ \ 96, –48, 24, –12, 6, …`

`text(GP where)\ \ \ a` `=96, and`
`r` `=t_2/t_1 = (–48)/96 = –1 /2`

`text(S)text(ince)\ \ |\ r\ | < 1`

`S_∞` `=a/(1-r)`
  `=96/(1-(-1 /2))`
  `=64`

`=>  A`

Filed Under: APs and GPs - MC Tagged With: Band 3

PATTERNS, FUR1 2009 VCAA 3 MC

The first four terms of a geometric sequence are  6400, `t_2` , 8100, – 9112.5

The value of  `t_2` is

A.   `– 7250` 

B.   `– 7200`

C.   `–1700`

D.      `7200`

E.      `7250`

Show Answers Only

`B`

Show Worked Solution

`text(GP is )6400,  t_2,  8100,  –9112.5`

`r` `=t_2/t_1 = t_3/t_2`
`:. t_2 / 6400` `= (–9112.5) / 8100`
`t_2` `= (–9112.5 × 6400) / 8100`
  `= – 7200`

`=>  B`

Filed Under: APs and GPs - MC Tagged With: Band 3

Measurement, STD2 M6 2007 HSC 8 MC

What is the length of the side  `MN`  in the following triangle, correct to two decimal places?


  1.   9.19 cm
  2. 10.07 cm
  3. 15.66 cm
  4. 18.67 cm
Show Answers Only

`C`

Show Worked Solution
`sin 50^@` `= 12/(MN)`
`MN` `= 12/sin50^@` 
  `= 15.66…`

`=>  C`

Filed Under: M3 Right-Angled Triangles (Y12), Pythagoras and basic trigonometry, Pythagoras and Right-Angled Trig (Std2) Tagged With: Band 3, smc-1103-20-Right-angled Trig, smc-802-20-Right-Angled Trig

Probability, STD2 S2 2007 HSC 2 MC

Each student in a class is given a packet of lollies. The teacher records the number of red lollies in each packet using a frequency table.
 

What is the relative frequency of a packet of lollies containing more than three red lollies?

  1.    `4/19`
  2.    `4/15`
  3.    `11/19`
  4.    `11/15`
Show Answers Only

`A`

Show Worked Solution

`text(# Packets with more than 3)`

`= 3 + 1 = 4`

`text(Total packets) = 19`

`:.\ text(Relative Frequency) = 4/19`

`=>  A`

Filed Under: Probability, Relative Frequency, Relative Frequency (Std 1), Relative Frequency (Std 2), Relative Frequency (Y11) Tagged With: Band 3, common-content, num-title-ct-core, num-title-qs-hsc, smc-1133-10-Surveys/Two-Way Tables, smc-4225-35-Relative frequency, smc-827-10-Surveys/Two-Way Tables, smc-990-10-Surveys/Two-Way Tables

Measurement, STD2 M1 2007 HSC 1 MC

What is  `0.000\ 000\ 326`  mm expressed in scientific notation?

  1. `0.326 xx 10^-6\ \ text(mm)`
  2. `3.26 xx 10^-7\ \ text(mm)`
  3. `0.326 xx 10^6\ \ text(mm)`
  4. `3.26 xx 10^7\ \ text(mm)`
Show Answers Only

`B`

Show Worked Solution

`0.000\ 000\ 326\ text(mm)`

`= 3.26 xx 10^-7\ \ text(mm)`

`=> B`

Filed Under: Identify and Convert Between Units (Std2-2027), MM1 - Units of Measurement, Units and Measurement Error (Std 1), Units and Measurement Error (Std 2) Tagged With: Band 3, smc-1120-20-Scientific Notation, smc-6303-40-Scientific Notation, smc-797-20-Scientific Notation

GEOMETRY, FUR1 2014 VCAA 3 MC

The diagram below shows the location of three boats, `A`, `B` and `C`.

Boat `B` is on a bearing of 110° from boat `A`.

Boat `B` is also on a bearing of 035° from boat `C`.

Boat `A` is due north of boat `C`.

The angle `ABC` is

A.    `35°`

B.    `65°`

C.    `70°`

D.    `75°`

E.  `110°` 

Show Answers Only

`D`

Show Worked Solution

`/_CAB` `= 180 – 110\ \ \ text{(straight angle at A)}`
  `= 70°`


`:./_ABC` `= 180 – (70 + 35)\ \ text{(Angle sum of}\ Delta ABC text{)}`
  `= 75°`

 
`=> D`

Filed Under: Trig - Bearings Tagged With: Band 3

GEOMETRY, FUR1 2014 VCAA 1 MC

The top of a ladder that is 4.50 m long rests 3.25 m up a wall, as shown in the diagram below.
 

The angle, `theta`, that the ladder makes with the wall is closest to

A.   `36°`

B.   `44°`

C.   `46°`

D.   `50°`

E.   `54°`

Show Answers Only

`B`

Show Worked Solution
`cos theta` `=text(adj)/text(hyp)`
  `=3.25/4.50`
  `=0.722…` 
`∴ theta` `= 43.76°` 

 
`=>B`

Filed Under: Right-Angled Trig and Angle Properties Tagged With: Band 3, smc-273-10-SOHCAHTOA

CORE*, FUR1 2014 VCAA 6 MC

Consider the following sequence.

`2,\ 1,\ 0.5\ …`

Which of the following difference equations could generate this sequence?

A. `t_(n + 1) = t_n - 1` `t_1 = 2`
B. `t_(n + 1) = 3 - t_n` `t_1 = 2`
C. `t_(n + 1) = 2 × 0.5^(n – 1)` `t_1 = 2`
D. `t_(n + 1) = - 0.5t_n + 2` `t_1 = 2`
E. `t_(n + 1) = 0.5t_n` `t_1 = 2`
Show Answers Only

`E`

Show Worked Solution

`text(Sequence is)\ \ 2, 1, 0.5, …`

NOTE: “GP” is used as an abbreviation of “geometric sequence”.

`=>\ text(Geometric sequence where common ratio = 0.5)`

`∴\ text(Difference equation is)`

`t_(n + 1) = 0.5t_n`

`=>  E`

Filed Under: Difference Equations - MC, Recursion - General Tagged With: Band 3, smc-714-20-RR (geometric), smc-714-60-Identify RR

CORE*, FUR1 2014 VCAA 4 MC

On day 1, Vikki spends 90 minutes on a training program.

On each following day, she spends 10 minutes less on the training program than she did the day before.

Let  `t_n`  be the number of minutes that Vikki spends on the training program on day  `n`.

A difference equation that can be used to model this situation for  `1 ≤ n ≤ 10`  is

A.   `t_(n + 1) = 0.90t_n` `t_1 = 90`
B.   `t_(n + 1) = 1.10 t_n` `t_1 = 90`
C.   `t_(n + 1) = t_n - 0.10` `t_1 = 90`
D.   `t_(n + 1) = 1 - 10 t_n` `t_1 = 90`
E.   `t_(n + 1) = t_n - 10` `t_1 = 90`


Show Answers Only

`E`

Show Worked Solution

`text(Difference equation where each term is 10 minutes)`

`text(less than the preceding term.)`

`∴\ text(Equation)\ \ \t_(n+1) = t_n-10, t_1 = 90`

`=>  E`

Filed Under: Difference Equations - MC, Recursion - General Tagged With: Band 3, smc-714-10-RR (arithmetic), smc-714-60-Identify RR

PATTERNS, FUR1 2014 VCAA 3 MC

A city has a population of 100 000 people in 2014.
Each year, the population of the city is expected to increase by 4%.
In 2018, the population is expected to be closest to

A.   `108\ 000` 

B.   `112\ 000` 

C.   `115\ 000`

D.   `117\ 000`

E.   `122\ 000`

Show Answers Only

`D`

Show Worked Solution

`text(Population is a geometric sequence with)`

`a = 100\ 000,\ \ \ \  r = 1.04`

`P_1 (2014)` `= a = text(100 000)`
`P_2 (2015)` `= ar^1 = text(100 000) (1.04) = text(104 000)`
`vdots`  
`P_5 (2018)` `= ar^4 = text(100 000) (1.04)^4 = text(116 985.8…)`


`∴\ text(In 2018, the population will be closest)`

`text(to)\ 117\ 000.`

`=> D`

Filed Under: APs and GPs - MC Tagged With: Band 3

CORE, FUR1 2014 VCAA 10-11 MC

The seasonal indices for the first 11 months of the year, for sales in a sporting equipment store, are shown in the table below.

Part 1

The seasonal index for December is

A.  `0.89`

B.  `0.97`

C.  `1.02`

D.  `1.23`

E.  `1.29`


Part 2

In May, the store sold $213 956 worth of sporting equipment.

The deseasonalised value of these sales was closest to

A.  `$165\ 857`

B.  `$190\ 420`

C.  `$209\ 677`

D.  `$218\ 322`

E.  `$240\ 400`

Show Answers Only

`text(Part 1:)\ E`

`text(Part 2:)\ E`

Show Worked Solution

`text(Part 1)`

`text(Sum of seasonal indices) = 12`

`:.\ text(December’s seasonal index)`

`=12 – text{(1.23 + 0.96 + 1.12 + 1.08 + 0.89}`
`text{+ 0.98 + 0.86 + 0.76 + 0.76 + 0.95 + 1.12)}`
`=1.29`

`=>E`


`text(Part 2)`

`text(May Index)` `=\ text(Actual Sales)/text{Deseasonalised Sales (D)}`
`0.89` `= (213\ 956)/(text{D})`
`:.\ text(D)` `= (213\ 956)/0.89`
  `= $240\ 400`

`=>  E`

Filed Under: Time Series Tagged With: Band 3, smc-266-10-Seasonal Index from a Table, smc-266-20-(De)Seasonalising Data

CORE, FUR1 2011 VCAA 9-10 MC

The length of a type of ant is approximately normally distributed with a mean of 4.8 mm and a standard deviation of 1.2 mm.

Part 1

From this information it can be concluded that around 95% of the lengths of these ants should lie between

A.   `text(2.4 mm and 6.0 mm)`

B.   `text(2.4 mm and 7.2 mm)`

C.   `text(3.6 mm and 6.0 mm)`

D.   `text(3.6 mm and 7.2 mm)`

E.   `text(4.8 mm and 7.2 mm)`


Part 2

A standardised ant length of  `z = text(−0.5)`  corresponds to an actual ant length of

A.   `text(2.4 mm)`

B.   `text(3.6 mm)`

C.   `text(4.2 mm)`

D.   `text(5.4 mm)`

E.   `text(7.0 mm)`

Show Answers Only

`text(Part 1:)\ B`

`text(Part 2:)\ C`

Show Worked Solution

`text(Part 1)`

`text(95% of scores lie between ±2 std dev)`

`bar x = 4.8, \ \ \ s = 1.2`

`text(Lower limit)` `= bar x – 2text(s)`
  `= 4.8 – 2(1.2)`
  `= 2.4\ text(mm)`
`text(Upper limit)` `= bar x + 2text(s)`
  `= 4.8 + 2(1.2)`
  `= 7.2\ text(mm)`

 
`=>B`
 

`text(Part 2)`

`z` `= \ \ (x – bar x)/s`
`-0.5` `= \ \ (x – 4.8)/1.2`
`-0.6` `= \ \ x – 4.8`
`x` `= \ \ 4.2\ text(mm)`

 
`=>C`


Filed Under: Normal Distribution Tagged With: Band 3, Band 4, smc-600-10-Single z-score, smc-600-20-z-score Intervals

CORE, FUR1 2009 VCAA 4-6 MC

The percentage histogram below shows the distribution of the fertility rates (in average births per woman) for 173 countries in 1975.

Part 1

In 1975, the percentage of these 173 countries with fertility rates of 4.5 or greater was closest to

A.   `12text(%)`  

B.   `35text(%)`  

C.   `47text(%)`  

D.   `53text(%)`  

E.   `65text(%)`  


Part 2

In 1975, for these 173 countries, fertility rates were most frequently

A.   less than 2.5

B.   between 1.5 and 2.5

C.   between 2.5 and 4.5 

D.   between 6.5 and 7.5 

E.   greater than 7.5 


Part 3

Which one of the boxplots below could best be used to represent the same fertility rate data as displayed in the percentage histogram?

Show Answers Only

`text(Part 1:)\ E`

`text(Part 2:)\ D`

`text(Part 3:)\ B`

Show Worked Solution

`text(Part  1)`

`text(Adding up the histogram bars from 4.5.)`

`%` `= 12 + 19  + 28 + 5 + 1`
  `= 65text(%)`

`=>  E`


`text(Part  2)`

`text(Fertility rates between 6.5 and 7.5 were 28%)`

`text(which is greater than any other range given.)`

`=>  D`


`text(Part  3)`

♦ Mean mark 43%.
MARKERS’ COMMENT: A systemic approach where students calculated the median, `Q_1` and `Q_3` was most successful.

`text(The boxplots have the same range, therefore)`

`text(consider the values of)\ Q_1,\ Q_3\ text(and median.)`

`text(By elimination,)`

`Q_1\ text{estimate is slightly below 3.5 (the first 2}`

`text{bars add up to 29%), therefore not A, D or E.}`

`Q_3\ text(estimate is around 7. Eliminate C.)`

`=>  B`

Filed Under: Graphs - Histograms and Other, Graphs - Stem/Leaf and Boxplots Tagged With: Band 2, Band 3, Band 5, smc-643-10-Single Box-Plots, smc-644-20-Histograms

CORE, FUR1 2008 VCAA 1-4 MC

The box plot below shows the distribution of the time, in seconds, that 79 customers spent moving along a particular aisle in a large supermarket.
 

     2008 1-4

Part 1

The longest time, in seconds, spent moving along this aisle is closest to

A.    `40`

B.    `60`

C.   `190`

D.   `450`

E.   `500`


Part 2

The shape of the distribution is best described as

A.   symmetric.

B.   negatively skewed.

C.   negatively skewed with outliers.

D.   positively skewed.

E.   positively skewed with outliers.


Part 3

The number of customers who spent more than 90 seconds moving along this aisle is closest to

A.    `7`

B.   `20`

C.   `26`

D.   `75`

E.   `79`


Part 4

From the box plot, it can be concluded that the median time spent moving along the supermarket aisle is

A.   less than the mean time.

B.   equal to the mean time.

C.   greater than the mean time

D.   half of the interquartile range.

E.   one quarter of the range.

Show Answers Only

`text(Part 1:)\ D`

`text(Part 2:)\ E`

`text(Part 3:)\ B`

`text(Part 4:)\ A`

Show Worked Solution

`text(Part 1)`

`text(Longest time is represented by the farthest right)`

`text(data point.)`

`=>D`


`text(Part 2)`

`text(Positively skewed as the tail of the distribution can)`

`text(clearly be seen to extend to the right.)`

`text(The data also clearly shows outliers.)`

`=>E`


`text(Part 3)`

♦ Mean mark 43%.
MARKERS’ COMMENT: Note that the outliers are already accounted for in the boxplot.

`text(From the box plot,)`

`text(Q)_3=90\ text{s}\ \ text{(i.e. 25% spend over 90 s)}`

`:.\ text(Customers that spend over 90 s)`

`= 25text(%) xx 79`

`=19.75`

`=>B`


`text(Part 4)`

`text(The mean is greater than the median for positively)`

`text(skewed data.)`

`=>A`

Filed Under: Graphs - Stem/Leaf and Boxplots Tagged With: Band 3, Band 4, Band 5, smc-643-10-Single Box-Plots, smc-643-70-Distribution Description

CORE*, FUR1 2010 VCAA 6 MC

`t_1=10`, `t_2=k`  and  `t_3=90`  are the first three terms of a difference equation with the rule  `t_n=t_(n - 1) + t_(n - 2)`.

The value of  `k`  is

A.  `30`

B.  `40`

C.  `50`

D.  `60`

E.  `80`

Show Answers Only

`E`

Show Worked Solution

`t_n=t_(n – 1) + t_(n – 2)\ \  … \ (1)`

`text(Given)\ \ t_1=10, \ t_2=k and t_3=90`

`text(Substituting into (1))`

`90` `=k + 10`
`k` `=80`

`=> E`

Filed Under: Difference Equations - MC, Recursion - General Tagged With: Band 3

PATTERNS, FUR1 2010 VCAA 5 MC

A team of swimmers was training.
Claire was the first swimmer for the team and she swam 100 metres.
Every other swimmer in the team swam 50 metres further than the previous swimmer.
Jane was the last swimmer for the team and she swam 800 metres.

The total number of swimmers in this team was

A.      `9`

B.    `13`

C.    `14`

D.    `15`

E.    `18`

Show Answers Only

`D`

Show Worked Solution

`text(Sequence is 100, 150, 200, … ,800)`

`text(AP where)\ \ \ a` `= 100`
`d` `=50`
`T_n` `=a + (n – 1)d`
`800` `=100 + (n – 1)50`
`700` `=50n – 50`
`50n` `=750`
`n` `=15`

`=> D`

Filed Under: APs and GPs - MC Tagged With: Band 3

PATTERNS, FUR1 2012 VCAA 3-4 MC

 Use the following information to answer Parts 1 and 2.

As part of a savings plan, Stacey saved $500 the first month and successively increased the amount that she saved each month by $50. That is, in the second month she saved $550, in the third month she saved $600, and so on.

Part 1

The amount Stacey will save in the 20th month is

A.  `$1450`

B.  `$1500`

C.  `$1650`

D.  `$1950`

E.  `$3050`


Part 2

The total amount Stacey will save in four years is

A.  `$13\ 400`

B.  `$37\ 200`

C.  `$58\ 800`

D.  `$80\ 400`

E.  `$81\ 600`

Show Answers Only

`text (Part 1:)\ A`

`text (Part 2:)\ D`

Show Worked Solution

`text (Part 1)`

`text (Sequence is 500, 550, 600,…)`

`text (AP where)\ \  a` `= 500, and` 
 `d` `= text (550 – 500 = 50)`
 `T_n` `= a + (n – 1) d` 
`T_20` `= 500 + (20 – 1)50`
  `= 1450`

`rArr A`


`text (Part 2)`

`n` `= 4 xx 12 = 48` 
 `S_n` `= n/2 [2a + (n-1)d]`
`S_4` `= 48/2 [2 xx 500 + (48-1)50]`
  `= 24 [1000 + 2350]`
  `= 80\ 400`

`rArr D`

Filed Under: APs and GPs - MC Tagged With: Band 3, Band 4

CORE*, FUR1 2012 VCAA 2 MC

A poultry farmer aims to increase the weight of a turkey by 10% each month.

The turkey’s weight, `T_n`, in kilograms, after `n` months, would be modelled by the rule

A.  `T_(n + 1) = T_n + 10`

B.  `T_(n + 1) = 1.1T_n + 10`

C.  `T_(n + 1) = 0.10T_n`

D.  `T_(n + 1) = 10T_n`

E.  `T_(n + 1) = 1.1T_n`


Show Answers Only

`E`

Show Worked Solution
`T_2` `=1.1T_1`  
`T_3` `= 1.1T_2` 
`vdots`   
`T_(n+1)` `= 1.1T_n`

 
`rArr E`

Filed Under: Difference Equations - MC, Recursion - General Tagged With: Band 3, smc-714-20-RR (geometric), smc-714-60-Identify RR

GEOMETRY, FUR1 2010 VCAA 1 MC

geometry 2010 VCAA 1mc

The value of `x` in the diagram above is

  1. `89`
  2. `90`
  3. `91`
  4. `101`
  5. `180`
Show Answers Only

`C`

Show Worked Solution

geometry 2010 VCAA 1mci

`y` `= 180 – 89\ \ text{(co-interior)}`
  `= 91°`
`:. x` `= 91°\ \ text{(vertically opposite)}`

 
`=> C`

Filed Under: Right-Angled Trig and Angle Properties Tagged With: Band 3, smc-273-60-Other angle properties

PATTERNS, FUR1 2010 VCAA 3 MC

The prizes in a lottery form the terms of a geometric sequence with a common ratio of 0.95.
If the first prize is $20 000, the value of the eighth prize will be closest to

A.     `$7000`

B.     `$8000`

C.     `$12\ 000`

D.     `$13\ 000`

E.     `$14\ 000`

Show Answers Only

`E`

Show Worked Solution

`text(GP has)\ \ r = 0.95`

`T_1` `=a=20000`
`T_2` `=ar=20000(0.95)=19\ 000`
`T_3` `=ar^2=20000(0.95)^2=18\ 050`
`vdots`  
`T_8`  `=ar^7=20000(0.95)^7=13\ 966.74`

`=> E`

Filed Under: APs and GPs - MC Tagged With: Band 3

PATTERNS, FUR1 2010 VCAA 2 MC

The first three terms of a geometric sequence are 

`0.125, 0.25, 0.5`

The fourth term in this sequence would be

A.    `0.625`

B.    `0.75`

C.    `0.875`

D.    `1`

E.    `1.25`

Show Answers Only

`D`

Show Worked Solution

`text(GP sequence is  0.125, 0.25, 0.5)`

`a` `=0.125`
`r` `=t_(2)/t_(1)=0.25/0.125=2`
`T_4` `=ar^3`
  `=0.125 xx 2^3`
  `=1`

`=> D`

Filed Under: APs and GPs - MC Tagged With: Band 3

CORE, FUR1 2010 VCAA 7-9 MC

The height (in cm) and foot length (in cm) for each of eight Year 12 students were recorded and displayed in the scatterplot below.
A least squares regression line has been fitted to the data as shown.
 

Part 1

By inspection, the value of the product-moment correlation coefficient `(r)` for this data is closest to

  1. `0.98`
  2. `0.78`
  3. `0.23`
  4. `– 0.44`
  5. `– 0.67`


Part 2

The explanatory variable is foot length.

The equation of the least squares regression line is closest to

  1. height = –110 + 0.78 × foot length.
  2. height = 141 + 1.3 × foot length.
  3. height = 167 + 1.3 × foot length.
  4. height = 167 + 0.67 × foot length.
  5. foot length = 167 + 1.3 × height.


Part 3

The plot of the residuals against foot length is closest to

CORE, FUR1 2010 VCAA 7-9 MCab

CORE, FUR1 2010 VCAA 7-9 MCcd

CORE, FUR1 2010 VCAA 7-9 MCe

Show Answers Only

`text(Part 1:)\ B`

`text(Part 2:)\ B`

`text(Part 3:)\ B`

Show Worked Solution

`text(Part 1)`

`text(The correlation is positive and strong.)`

`text(Eliminate)\ C, D\ text(and)\ E.`

`r= 0.98\  text(is too strong. Eliminate)\ A.`

`=> B`


`text(Part 2)`

♦♦ Mean mark 35%.
STRATEGY: An alternate but less efficient strategy could be to find 2 points and calculate the gradient and then use the point gradient formula.

`text(The intercept with the height axis)\ (ytext{-axis)}`

`text{is below 167 because that is the height when}`

`text{foot length = 20 cm.}`

`text(Eliminate)\ C, D\ text(and)\ E.`

`text(The gradient is approximately 1.3, by observing)`

`text(the increase in height values when the foot)`

`text(length increases from 20 to 22 cm.)`

`=>  B`


`text(Part 3)`

`text(First residual is positive. Eliminate)\ A, D, E.`

`text(The next 3 residuals are negative. Eliminate)\ C`

`=>  B`

Filed Under: Correlation and Regression Tagged With: Band 3, Band 4, Band 5, smc-265-10-r / r^2 and Association, smc-265-20-Find LSRL Equation/Gradient, smc-265-50-Residuals

CORE, FUR1 2011 VCAA 1-3 MC

The histogram below displays the distribution of the percentage of Internet users in 160 countries in 2007.
 

Part 1

The shape of the histogram is best described as

A.   approximately symmetric.

B.   bell shaped. 

C.   positively skewed.

D.   negatively skewed.

E.   bi-modal.


Part 2

The number of countries in which less than 10% of people are Internet users is closest to

A.   `10`

B.   `16`

C.   `22`

D.   `32`

E.   `54`


Part 3

From the histogram, the median percentage of Internet users is closest to

A.   `10text(%)`

B.   `15text(%)`

C.   `20text(%)`

D.   `30text(%)`

E.   `40text(%)`

Show Answers Only

`text(Part 1:)\ C`

`text(Part 2:)\ E`

`text(Part 3:)\ C`

Show Worked Solution

`text(Part 1)`

`text(The shape of the histogram has a definite tail)`

`text(on the right side which means it is positively)`

`text(skewed.)`

`=>  C`


`text(Part 2)`

`text(The histogram shows that 32% of countries fall)`

`text(between 0–5%, and 22% fall between 5–10%.)`

`:.\ text(Users below 10%)`

`= 32 + 22`

`= 54 text(%)`

`=>  E`


`text(Part 3)`

♦ Mean mark 45%.

`text(Total countries = 160)`

`text(Adding bars from the left hand side, there are)`

`text{80 countries in the first 4 bars (i.e. half of 160).}`

`:.\ text(Median is closest to 20%)`

`=>  C`

Filed Under: Graphs - Histograms and Other, Summary Statistics Tagged With: Band 3, Band 5, smc-468-40-Median Mode and Range, smc-644-20-Histograms, smc-644-60-Distribution Description

Trig Ratios, EXT1 2008 HSC 6a

From a point  `A`  due south of a tower, the angle of elevation of the top of the tower  `T`, is 23°. From another point  `B`, on a bearing of 120° from the tower, the angle of elevation of  `T`  is 32°. The distance  `AB`  is 200 metres.
 

Trig Ratios, EXT1 2008 HSC 6a 
 

  1. Copy or trace the diagram into your writing booklet, adding the given information to your diagram.  (1 mark)
  2. Hence find the height of the tower.   (3 marks)
Show Answers Only
  1. Trig Ratios, EXT1 2008 HSC 6a Answer

  2. `96\ text(m)`
Show Worked Solution

(i) 

Trig Ratios, EXT1 2008 HSC 6a Answer 


(ii)  `text(Find)\ \ OT = h`

`text(Using the cosine rule in)\ Delta AOB :`

`200^2 = OA^2 + OB^2 – 2 * OA * OB * cos 60\ …\ text{(*)}`

 `text(In)\ Delta OAT,\tan 23^@= h/(OA)`

`=> OA= h/(tan 23^@)\  …\ (1)`

 `text(In)\ Delta OBT,\ tan 32^@= h/(OB)`

`=> OB= h/(tan 32^@)\ \ \ …\ (2)`
 

`text(Substitute)\ (1)\ text(and)\ (2)\ text(into)\ text{(*)}`

`200^2` `= (h^2)/(tan^2 23^@) + (h^2)/(tan^2 32^@) – 2 * h/(tan 23^@) * h/(tan 32^@) * 1/2`
  `= h^2 (1/(tan^2 23^@) + 1/(tan^2 32^@) + 1/(tan23^@ * tan32^@) )`
  `= h^2 (4.340…)`
`h^2` `= (40\ 000)/(4.340…)`
  `= 9214.55…`
`:. h` `= 95.99…`
  `= 96\ text(m)\ \ \ text{(to nearest m)}`

Filed Under: 5. Trig Ratios EXT1 Tagged With: Band 3, Band 4

CORE, FUR1 2014 VCAA 7 MC

The parallel boxplots below summarise the distribution of population density, in people per square kilometre, for 27 inner suburbs and 23 outer suburbs of a large city.
 

Which one of the following statements is not true?

  1. More than 50% of the outer suburbs have population densities below 2000 people per square kilometre. 
  2. More than 75% of the inner suburbs have population densities below 6000 people per square kilometre. 
  3. Population densities are more variable in the outer suburbs than in the inner suburbs.
  4. The median population density of the inner suburbs is approximately 4400 people per square kilometre.
  5. Population densities are, on average, higher in the inner suburbs than in the outer suburbs.
Show Answers Only

`C`

Show Worked Solution

`text(The chart of the inner suburbs has both a higher IQR and)`

`text(range than the outer suburbs. This supports the argument)`

`text(that densities are NOT more variable in the outer suburbs,)`

`text(making C an untrue statement.)`


`text(All other statements can be shown to be true using)`

`text(quartile and median comparisons.)`

`=>  C`

Filed Under: Graphs - Stem/Leaf and Boxplots Tagged With: Band 3, smc-643-20-Parallel Box-Plots

CORE, FUR1 2014 VCAA 3-5 MC

The following table shows the data collected from a sample of seven drivers who entered a supermarket car park. The variables in the table are:

distance – the distance that each driver travelled to the supermarket from their home
 

    • sex – the sex of the driver (female, male)
    • number of children – the number of children in the car
    • type of car – the type of car (sedan, wagon, other)
    • postcode – the postcode of the driver’s home.
       

Part 1

The mean,  `barx`, and the standard deviation, `s_x`, of the variable, distance, are closest to

A.  `barx = 2.5\ \ \ \ \ \ \s_x = 3.3`

B.  `barx = 2.8\ \ \ \ \ \ \s_x = 1.7`

C.  `barx = 2.8\ \ \ \ \ \ \s_x = 1.8`

D.  `barx = 2.9\ \ \ \ \ \ \s_x = 1.7`

E.  `barx = 3.3\ \ \ \ \ \ \s_x = 2.5`


Part 2

The number of categorical variables in this data set is

A.  `0`

B.  `1`

C.  `2`

D.  `3`

E.  `4`


Part 3

The number of female drivers with three children in the car is

A.  `0`

B.  `1`

C.  `2`

D.  `3`

E.  `4`


Show Answers Only

`text(Part 1:) \ C`

`text(Part 2:)\ D`

`text(Part 3:)\ B`

Show Worked Solution

`text(Part 1)`

`text(By calculator)`

`text(Distance)\ \ barx` `=2.8`
`s_x` `≈1.822`

 
`=>C`


`text(Part 2)`

♦♦ Mean mark 29%.
MARKER’S NOTE: Postcodes here are categorical variables. Ask yourself “Does it make sense to calculate the mean of this variable?” If the answer is “No”, the variable is categorical.

`text(Categorical variables are sex, type)`

`text(of car, and post code.)`

`=>D`


`text(Part 3)`

`text(1 female driver has 3 children.)`

`=>B`

Filed Under: Summary Statistics Tagged With: Band 2, Band 3, Band 6, smc-468-10-Data Classification, smc-468-20-Mean, smc-468-30-Std Dev

CORE, FUR1 2014 VCAA 2 MC

The time spent by shoppers at a hardware store on a Saturday is approximately normally distributed with a mean of 31 minutes and a standard deviation of 6 minutes.

If 2850 shoppers are expected to visit the store on a Saturday, the number of shoppers who are expected to spend between 25 and 37 minutes in the store is closest to

A.   16

B.   68

C.   460

D.   1900

E.   2400

Show Answers Only

`D`

Show Worked Solution
`barx=31` `s=6`
`ztext{-score (25)}` `=(x-barx)/s`
  `=(25-31)/6`
  `=–1`


`z text{-score (37)}` `=(37-31)/6`
  `=1`


`∴\ text(# Shoppers)` `= text(68%) xx 2850`
  `=1938`

 
`=>  D`

Filed Under: Normal Distribution Tagged With: Band 3, smc-600-20-z-score Intervals

CORE, FUR1 2014 VCAA 1 MC

The following ordered stem plot shows the areas, in square kilometres, of 27 suburbs of a large city.


The median area of these suburbs, in square kilometres, is

A.   `3.0` 

B.   `3.1` 

C.   `3.5`

D.   `30.0`

E.   `30.5`

Show Answers Only

`B`

Show Worked Solution

`text(# Data points = 27)`

`text(Median is)\ \ \ (27+1)/2 = text(14th)`

`∴ text(Median)=3.1\ text(km²)`

`=>  B`

Filed Under: Graphs - Stem/Leaf and Boxplots Tagged With: Band 3, smc-643-40-Stem and Leaf

CORE, FUR1 2012 VCAA 6 MC

The table below shows the percentage of households with and without a computer at home for the years 2007, 2009 and 2011.


In the year 2009, a total of  `5\ 170\ 000` households were surveyed.

The number of households without a computer at home in 2009 was closest to

A.       `801\ 000`
B.    `1\ 153\ 000`
C.    `1\ 737\ 000`
D.    `3\ 433\ 000`
E.    `4\ 017\ 000`
Show Answers Only

`B`

Show Worked Solution

`text (In 2009, the percentage of households without)`

`text(a computer = 22.3%.)`

`:.\ text (# Households without a computer)`

`= 22.3 text (%) xx 5\ 170\ 000`

`= 1\ 152\ 910`

`rArr B`

Filed Under: Graphs - Histograms and Other Tagged With: Band 3, smc-644-50-Frequency Tables

CORE, FUR1 2010 VCAA 5-6 MC

The lengths of the left feet of a large sample of  Year 12 students were measured and recorded. These foot lengths are approximately normally distributed with a mean of 24.2 cm and a standard deviation of 4.2 cm.

Part 1

A Year 12 student has a foot length of 23 cm.
The student’s standardised foot length (standard `z` score) is closest to

A.   –1.2

B.   –0.9

C.   –0.3

D.    0.3

E.     1.2


Part 2

The percentage of students with foot lengths between 20.0 and 24.2 cm is closest to

A.   16%

B.   32%

C.   34%

D.   52%

E.   68%

Show Answers Only

`text(Part 1:)\ C`

`text(Part 2:)\ C`

Show Worked Solution

`text(Part 1)`

`bar(x) = 24.2,`    `s=4.2`
`z text{-score (23)}` `=(x – bar(x))/s`
  `= (23 – 24.2)/4.2`
  `= -0.285…`

`=>  C`


`text(Part 2)`

   `z text{-score (20)}` `=(20- 24.2)/4.2`
  `= -1`
 `z text{-score (24.2)}` `= 0`


`text(68% have a)\ z text(-score between  –1 and 1)`

`:.\ text(34% have a)\ z text(-score between  –1 and 0)`

`=>  C`

Filed Under: Normal Distribution Tagged With: Band 3, Band 4, smc-600-10-Single z-score, smc-600-20-z-score Intervals

CORE, FUR1 2010 VCAA 4 MC

The passengers on a train were asked why they travelled by train. Each reason, along with the percentage of passengers who gave that reason, is displayed in the segmented bar chart below.
 

CORE, FUR1 2010 VCAA 4 MC
 

The percentage of passengers who gave the reason ‘no car’ is closest to

A.   `text(14%)`

B.   `text(18%)`

C.   `text(26%)`

D.   `text(74%)`

E.   `text(88%)`

Show Answers Only

`A`

Show Worked Solution

`text(Percentage that stated “no car”)`

`=\ text(88% – 74%)`

`=\ text(14%)`

`=>  A`

Filed Under: Graphs - Histograms and Other Tagged With: Band 3, smc-644-40-Segmented Bar Charts

CORE, FUR1 2009 VCAA 8 MC

An animal study was conducted to investigate the relationship between exposure to danger during sleep (high, medium, low) and chance of attack (above average, average, below average). The results are summarised in the percentage segmented bar chart below.


The percentage of animals whose exposure to danger during sleep is high, and whose chance of attack is below average, is closest to

A.     `4text(%)`

B.   `12text(%)`

C.   `28text(%)`

D.   `72text(%)`

E.   `86text(%)`

Show Answers Only

`E`

Show Worked Solution

`text(The correct percentage is the black bar section)`

`text(above the “high” column heading.)`

`=>E`

Filed Under: Graphs - Histograms and Other Tagged With: Band 3, smc-644-40-Segmented Bar Charts

CORE, FUR1 2009 VCAA 1-3 MC

The back-to-back ordered stem plot below shows the female and male smoking rates, expressed as a percentage, in 18 countries.


Part 1

For these 18 countries, the lowest female smoking rate is

A.     `5text(%)`  

B.     `7text(%)`  

C.     `9text(%)`  

D.   `15text(%)`  

E.   `19text(%)`  


Part 2

For these 18 countries, the interquartile range (IQR) of the female smoking rates is

A.     `4` 

B.     `6`

C.   `19`

D.   `22`

E.   `23`


Part 3

For these 18 countries, the smoking rates for females are generally

A.   lower and less variable than the smoking rates for males.

B.   lower and more variable than the smoking rates for males.

C.   higher and less variable than the smoking rates for males.

D.   higher and more variable than the smoking rates for males.

E.   about the same as the smoking rates for males.

Show Answers Only

`text(Part  1:) \ D`

`text(Part  2:) \ B`

`text(Part  3:) \ A`

Show Worked Solution

`text(Part  1)`

`text(Lowest female smoking rate is 15%.)`

`=>  D`


`text(Part  2)`

`text(18 data points.)`

`text(Split in half and take the middle point of each group.)`

`Q_L` `=5 text(th value = 19%)`
`Q_U` `= 14 text(th value = 25%)`
 `∴ IQR` `= 25text(% – 19%) =6text(%)` 

 
`=>  B`


`text(Part  3)`

`text{Smoking rates are lower and less variable (range of}`

`text{females rates vs male rates is 13% vs 30%).}`

`=>  A`

Filed Under: Graphs - Stem/Leaf and Boxplots Tagged With: Band 2, Band 3, smc-643-50-Back-to-Back Stem and Leaf, smc-643-70-Distribution Description

PATTERNS, FUR1 2013 VCAA 3 MC

The first time a student played an online game, he played for 18 minutes.
Each time he played the game after that, he played for 12 minutes longer than the previous time.
After completing his 15th game, the total time he had spent playing these 15 games was

A.   `186` minutes 

B.   `691` minutes  

C. `1206` minutes 

D. `1395` minutes  

E. `1530` minutes

Show Answers Only

`E`

Show Worked Solution

`text(Series)\quad18, 18+12, 18+(2×12), …`

`text(AP with)\quad a=18 and d=12`

`S_n` `=n/2[2a+(n-1)d]`
`S_15` `=15/2[2(18)+(15-1)12]`
  `=15/2(36+168)`
  `=15/2(204)`
  `=1530`

`=> E`

Filed Under: APs and GPs - MC Tagged With: Band 3

CORE, FUR1 2013 VCAA 12-13 MC

The time series plot below displays the number of guests staying at a holiday resort during summer, autumn, winter and spring for the years 2007 to 2012 inclusive.
 

CORE, FUR1 2013 VCAA 12-13 MC_1
 

 Part 1

Which one of the following best describes the pattern in the time series?

A.  random variation only

B.  decreasing trend with seasonality

C.  seasonality only

D.  increasing trend only

E.  increasing trend with seasonality 


Part 2

The table below shows the data from the times series plot for the years 2007 and 2008. 
 

CORE, FUR1 2013 VCAA 12-13 MC_2
 

Using four-mean smoothing with centring, the smoothed number of guests for winter 2007 is closest to

A.  `85`

B.  `107`

C.  `183`

D.  `192`

E.  `200` 

Show Answers Only

`text(Part 1:)\ C`

`text(Part 2:)\ D`

Show Worked Solution

`text(Part 1)`

`text(The pattern in the time series is seasonal only,)`

`text(with peaks appearing in Summer. There is no)`

`text(apparent year-to-year trend.)`

`=> C`


`text(Part 2)`

`text{Mean of guests (Season 1-4)}`

`=(390+126+85+130)/4`
`=182.75`


`text{Mean of guests (Season 2-5)}`

`=(126+85+85+130+460)/4`
`=200.25`


`:.\ text(Four-mean smoothing with centring)`

`=(182.75+200.25)/2`
`=191.5`

`=> D`

Filed Under: Time Series Tagged With: Band 3, Band 4, smc-266-40-Time Series Trends, smc-266-60-MEAN Smoothing

CORE, FUR1 2013 VCAA 8 MC

The table below shows the hourly rate of pay earned by 10 employees in a company in 1990 and in 2010.
 

CORE, FUR1 2013 VCAA 8 MC
 

The value of the correlation coefficient, `r`, for this set of data is closest to

A.   `0.74`  

B.   `0.86`  

C.   `0.92`

D.   `0.93`

E.   `0.96`

Show Answers Only

`E`

Show Worked Solution

`text(By calculator)`

`r=0.962…`

`=> E`

Filed Under: Correlation and Regression Tagged With: Band 3, smc-265-10-r / r^2 and Association

CORE, FUR1 2013 VCAA 5-6 MC

The time, in hours, that each student spent sleeping on a school night was recorded for 1550 secondary-school students. The distribution of these times was found to be approximately normal with a mean of 7.4 hours and a standard deviation of 0.7 hours.
 

Part 1

The time that 95% of these students spent sleeping on a school night could be 

A.  less than 6.0 hours.   

B.  between 6.0 and 8.8 hours.

C.  between 6.7 and 8.8 hours.

D.  less than 6.0 hours or greater than 8.8 hours.

E.  less than 6.7 hours or greater than 9.5 hours.


Part 2

The number of these students who spent more than 8.1 hours sleeping on a school night was closest to

A.       16

B.     248

C.   1302

D.   1510

E.   1545

Show Answers Only

`text(Part 1:)\ B`

`text(Part 2:)\ B`

Show Worked Solution

`text(Part 1)`

`-2 < z text(-score) < 2,\ \ text(contains 95% of students.)`

`barx=7.4, \ \ \ s=0.7`

`z text(-score of +2)` `= 7.4+(2×0.7)`
  `= 8.8\ text(hours)`           
   
`z text(-score of –2)` `= 7.4−(2×0.7)`
  `= 6.0\ text(hours)`


`:. 95 text(% students sleep between 6 and 8.8 hours.`

 `=>B`
 

`text(Part 2)`

`text (Find)\ z text(-score of 8.1 hours)`

`ztext(-score)` `= (x-barx)/s` 
  `= (8.1-7.4)/0.7`
  `= 1`

 
`text(68% students have)\ \   –1 < z text(-score) < 1`

`:. 16 text(% have)\ z text(-score) > 1`

`:.\ text(# Students)` `= 16text(%) xx1550`
  `= 248`

 `=>B`

Filed Under: Normal Distribution Tagged With: Band 3, smc-600-10-Single z-score, smc-600-20-z-score Intervals

CORE, FUR1 2013 VCAA 3-4 MC

The heights of 82 mothers and their eldest daughters are classified as 'short', 'medium' or 'tall'. The results are displayed in the frequency table below.
 

CORE, FUR1 2013 VCAA 3-4 MC

 
 Part 1

The number of mothers whose height is classified as 'medium' is

 A.   `7` 

B.  `10` 

C.  `14`

D.  `31`

E.  `33`


Part 2

Of the mothers whose height is classified as 'tall', the percentage who have eldest daughters whose height is classified as 'short' is closest to

A.    `text(3%)`

B.    `text(4%)`

C.  `text(14%)`

D.  `text(17%)`

E.  `text(27%)`

Show Answers Only

`text(Part 1:)\ D`

`text(Part 2:)\ C`

Show Worked Solution

       `text(Part 1)`

`text(# Mothers classified as medium)`

`=10+14+7\ \ \ text{(from Table)}`
`=31`

`=>D` 


`text(Part 2)`

♦ Mean mark 45%.
MARKER’S COMMENT: Many students obtained the wrong base of 82 for this percentage calculation.
`text(# Tall Mothers)` `=3+11+8` 
  `=22`

`text{# Tall Mothers with short eldest = 3 (from Table)}`

`:.\ text(Percentage)` `=3/22×100`
  `=13.6363…%`

`=>  C`

Filed Under: Graphs - Histograms and Other Tagged With: Band 3, Band 5, smc-644-50-Frequency Tables

CORE, FUR1 2013 VCAA 1-2 MC

The following ordered stem plot shows the percentage of homes connected to broadband internet for 24 countries in 2007.
 

   CORE, FUR1 2013 VCAA 1-2 MC 
 

 Part 1

The number of these countries with more than 22% of homes connected to broadband internet in 2007 is

A.    `4`

B.    `5`

C.  `19`

D.  `20`

E.  `22`


Part 2

Which one of the following statements relating to the data in the ordered stem plot is not true?

A.  The minimum is 16%.

B.  The median is 30%.

C.  The first quartile is 23.5%

D.  The third quartile is 32%.

E.  The maximum is 38%.

Show Answers Only

`text(Part 1:)\ C`

`text(Part 2:)\ B`

Show Worked Solution

`text(Part 1)`

`text(There are 19 values greater than 22%)`

      `=>  C`


`text(Part 2)`

`text(24 data points.)` 

`text(Median)` `= text(12th + 13th)/2`
  `=(29+30)/2`
  `=29.5`


`:.\ text(B is incorrect and all other  statements can)`

`text(be verified as true.)`

`=>  B`

Filed Under: Graphs - Stem/Leaf and Boxplots Tagged With: Band 2, Band 3, smc-643-40-Stem and Leaf

Functions, EXT1 F1 2008 HSC 3a

  1.  Sketch the graph of  `y = |\ 2x - 1\ |`.   (1 mark)

    --- 8 WORK AREA LINES (style=lined) ---

  2.  Hence, or otherwise, solve  `|\ 2x - 1\ | <= |\ x - 3\ |`.    (3 marks)

    --- 5 WORK AREA LINES (style=lined) ---

Show Answers Only
  1.  
    Real Functions, EXT1 2008 HSC 3a Answer

  2. `-2 <= x <= 4/3`
Show Worked Solution
i.    Real Functions, EXT1 2008 HSC 3a Answer


ii.  `text(Solving for)\ \ |\ 2x – 1\ | <= |\ x – 3\ |`

`text(Graph shows the statement is TRUE)`

`text(between the points of intersection.)`
 

`=>\ text(Intersection occurs when)`

`(2x – 1)` `= (x – 3)\ \ \ text(or)\ \ \ ` `-(2x – 1)` `= x – 3`
`x` `= -2` `-2x + 1` `= x – 3`
    `-3x` `= -4`
    `x` `= 4/3`


`:.\ text(Solution is)\ \ {x: -2 <=  x <= 4/3}`

Filed Under: 1. Basic Arithmetic and Algebra EXT1, 4. Real Functions EXT1, Inequalities (Ext1) Tagged With: Band 3, Band 4, smc-1033-20-Absolute Value, smc-1072-30-y = | f(x) |; y = f( |x| )

Functions, EXT1 F2 2008 HSC 2c

The polynomial  `p(x)`  is given by  `p(x) = ax^3 + 16x^2 + cx - 120`, where  `a`  and  `c`  are constants.

The three zeros of  `p(x)`  are  `– 2`,  `3`  and  `beta`.

Find the value of  `beta`.   (3 marks) 

--- 6 WORK AREA LINES (style=lined) ---

Show Answers Only

`- 5`

Show Worked Solution

`p(x) = ax^3 + 16x^2 + cx – 120`

`text(Roots:)\ \ – 2, \ 3, \ beta`

`-2 + 3 + beta` `= -B/A`
`beta + 1` `= -16/a`
`beta` `= -16/a – 1\ \ \ \ \ …\ (1)`


`-2 xx 3 xx beta` `= -D/A`
`-6 beta` `= 120/a`
`beta` `= -20/a\ \ \ \ \ …\ (2)`


MARKER’S COMMENT: Many students displayed significant inefficiencies in solving simultaneous equations.
`- 16/a – 1` `= -20/beta`
`-16 – a` `= -20`
`a` `= 4`

 
`text(Substitute)\ \ a = 4\ \ text(into)\ (1)`

`:. beta` `= – 16/4 – 1`
  `= -5`

Filed Under: Roots, Remainders and Factors, Sum, Products and Multiplicity of Roots (Ext1) Tagged With: Band 3, Band 4, HSC, smc-1205-10-Sum and Product

Calculus, EXT1 C2 2008 HSC 1c

Evaluate  `int_-1^1 1/sqrt(4 - x^2)\ dx`.   (2 marks)

Show Answers Only

`pi/3`

Show Worked Solution

`int_-1^1 1/sqrt(4 – x^2)\ dx`

`= [sin^(-1) (x/2)]_(-1)^1`

`= sin^(-1) (1/2) – sin^(-1) (-1/2)`

`= pi/6 – (- pi/6)`

`= pi/3`

Filed Under: Inverse Functions Calculus (Ext1), Inverse Trig Functions EXT1 Tagged With: Band 3, smc-1037-30-Sin/Cos Integration

  • « Previous Page
  • 1
  • …
  • 51
  • 52
  • 53
  • 54
  • 55
  • …
  • 57
  • Next Page »

Copyright © 2014–2025 SmarterEd.com.au · Log in