SmarterEd

Aussie Maths & Science Teachers: Save your time with SmarterEd

  • Login
  • Get Help
  • About

PATTERNS, FUR1 2013 VCAA 4 MC

The vertical distance, in m, that a hot air balloon rises in each successive minute of its flight is given by the geometric sequence

`64.0,\ \ 60.8,\ \  57.76\ …`

The total vertical distance, in m, that the balloon rises in the first 10 minutes of its flight is closest to

A.   `38`   

B.   `40`  

C.  `473` 

D.  `514`  

E. `1280`  

Show Answers Only

`D`

Show Worked Solution

`text(Series 64.0, 60.8, 57.76 …)`

`text(GP where)\ \  a` `=64.0`
`r` `=60.8/64.0=0.95`
`S_n` `=(a(1-r^n))/(1−r)` 
`S_10` `=(64 (1−0.95^10))/(1−0.95)`  
  `=513.616…`

`=> D`

Filed Under: APs and GPs - MC Tagged With: Band 4

PATTERNS, FUR1 2013 VCAA 2 MC

The graph above shows the first six terms of a sequence.

This sequence could be

A.  an arithmetic sequence that sums to one.

B.  an arithmetic sequence with a common difference of one.

C.  a Fibonacci-related sequence whose first term is one.

D.  a geometric sequence with an infinite sum of one.

E.  a geometric sequence with a common ratio of one. 

Show Answers Only

`E`

Show Worked Solution

`text(Series is 1, 1, 1, …)`

♦ Mean mark 41%.

`text(The only possibility within the choices)`

`text(is a geometric sequence where)\ \  r=1.`

`=> E`

Filed Under: APs and GPs - MC Tagged With: Band 4

CORE, FUR1 2013 VCAA 12-13 MC

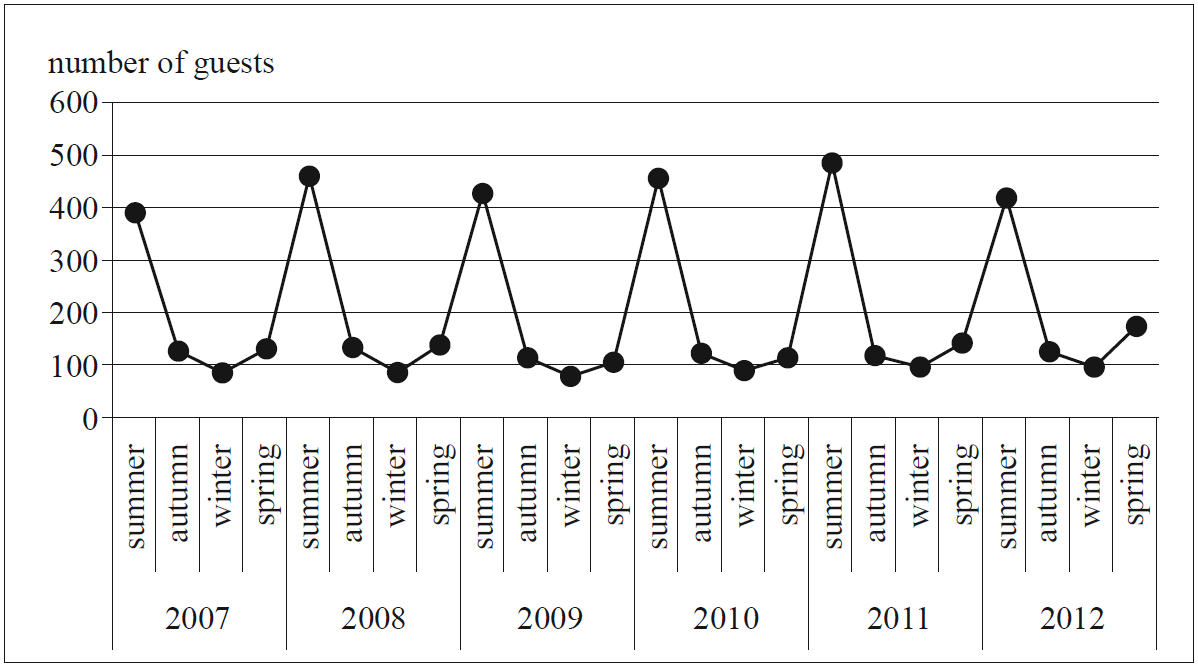
The time series plot below displays the number of guests staying at a holiday resort during summer, autumn, winter and spring for the years 2007 to 2012 inclusive.
 

CORE, FUR1 2013 VCAA 12-13 MC_1
 

 Part 1

Which one of the following best describes the pattern in the time series?

A.  random variation only

B.  decreasing trend with seasonality

C.  seasonality only

D.  increasing trend only

E.  increasing trend with seasonality 


Part 2

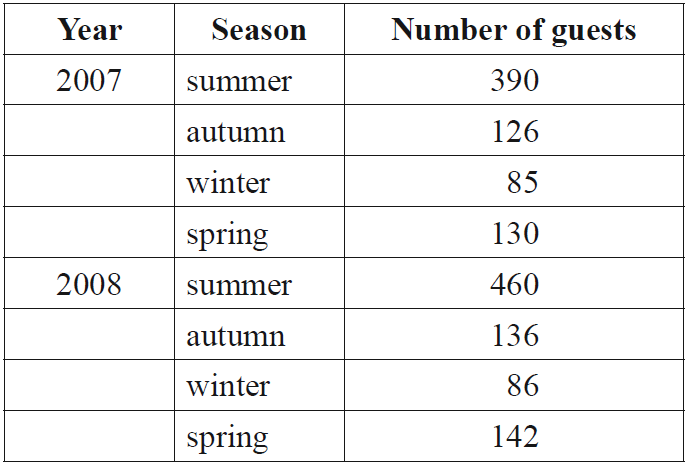
The table below shows the data from the times series plot for the years 2007 and 2008. 
 

CORE, FUR1 2013 VCAA 12-13 MC_2
 

Using four-mean smoothing with centring, the smoothed number of guests for winter 2007 is closest to

A.  `85`

B.  `107`

C.  `183`

D.  `192`

E.  `200` 

Show Answers Only

`text(Part 1:)\ C`

`text(Part 2:)\ D`

Show Worked Solution

`text(Part 1)`

`text(The pattern in the time series is seasonal only,)`

`text(with peaks appearing in Summer. There is no)`

`text(apparent year-to-year trend.)`

`=> C`


`text(Part 2)`

`text{Mean of guests (Season 1-4)}`

`=(390+126+85+130)/4`
`=182.75`


`text{Mean of guests (Season 2-5)}`

`=(126+85+85+130+460)/4`
`=200.25`


`:.\ text(Four-mean smoothing with centring)`

`=(182.75+200.25)/2`
`=191.5`

`=> D`

Filed Under: Time Series Tagged With: Band 3, Band 4, smc-266-40-Time Series Trends, smc-266-60-MEAN Smoothing

CORE, FUR1 2013 VCAA 11 MC

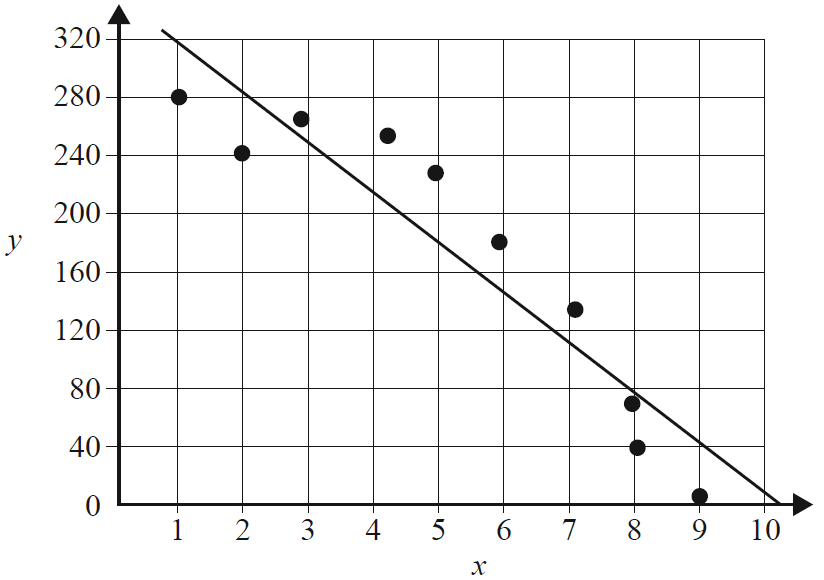
A least squares regression line is fitted to data in a scatterplot, as shown below.
  

CORE, FUR1 2013 VCAA 11 MC

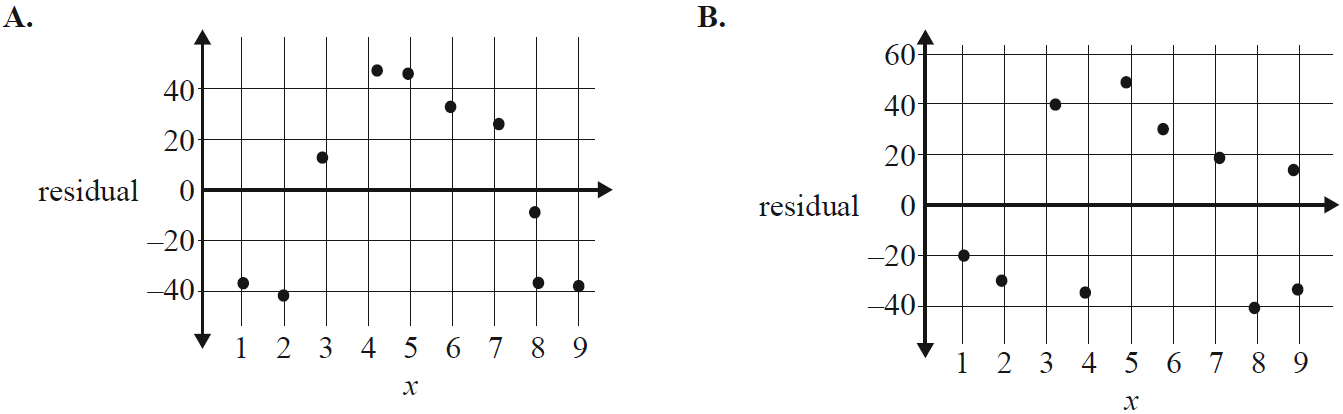
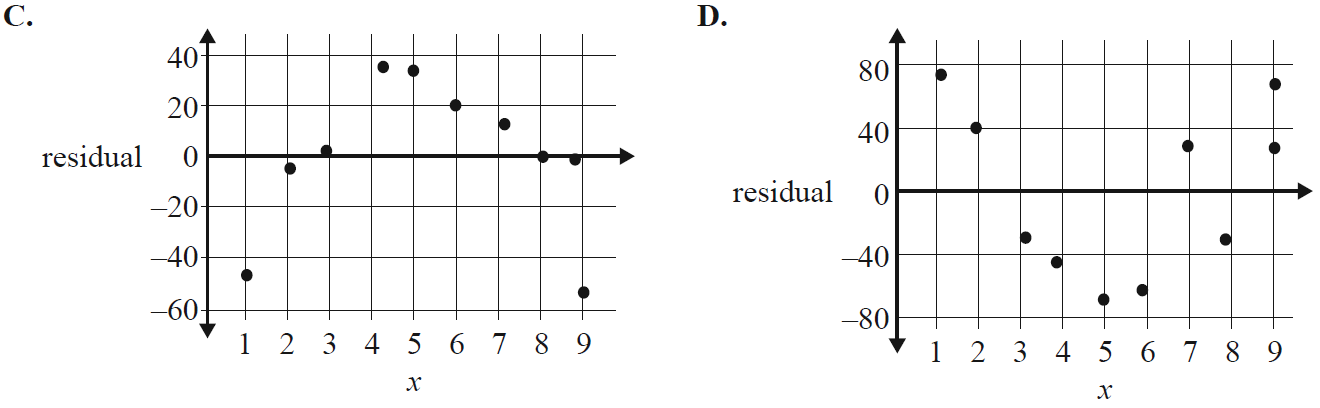
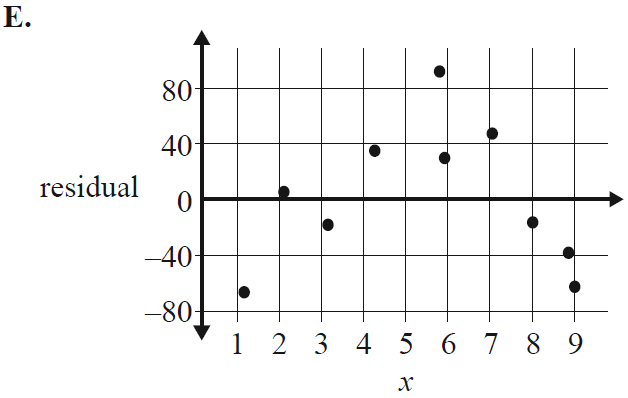
The corresponding residual plot is closest to

CORE, FUR1 2013 VCAA 11 MC_ab

CORE, FUR1 2013 VCAA 11 MC_cd

CORE, FUR1 2013 VCAA 11 MC_e


Show Answers Only

`A`

Show Worked Solution

`text(By Elimination)`

`text(The first 2 and last 3 data points are below regression line,)`

`text(and are therefore negative residuals.)`

`:.\ text(Cannot be)\ B, D\ text(or)\ E.`


`text(The first two data points will have similar negative)`

`text(residuals.)`

`:.\ text(Cannot be)\ C.`

`=> A`

Filed Under: Correlation and Regression Tagged With: Band 4, smc-265-50-Residuals

CORE, FUR1 2013 VCAA 10 MC

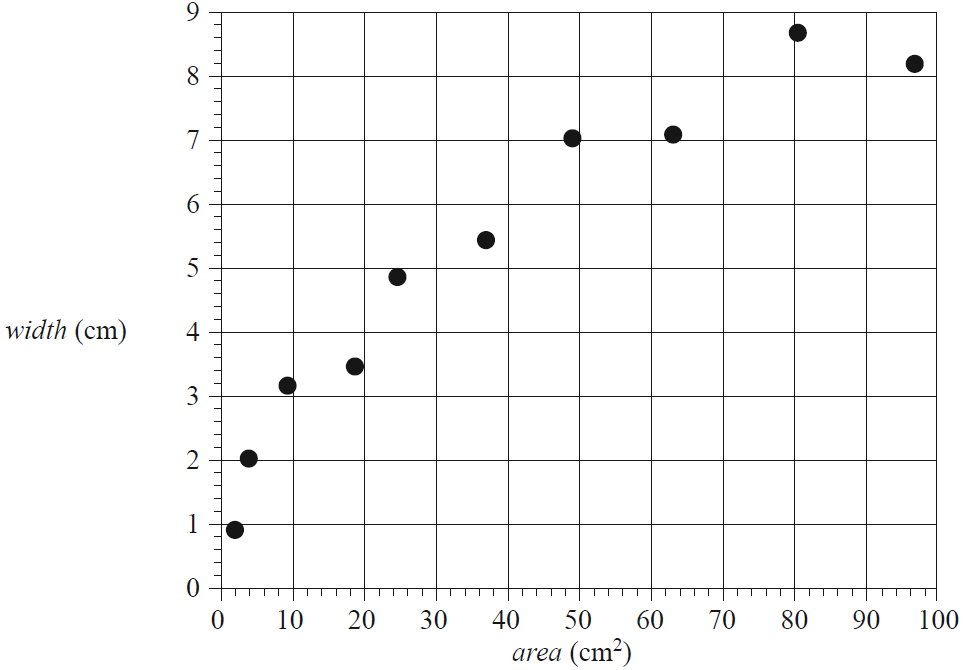
The data in the scatterplot below shows the width, in cm, and the surface area, in cm², of leaves sampled from 10 different trees. The scatterplot is non-linear.
 

CORE, FUR1 2013 VCAA 10 MC

To linearise the scatterplot, (width)2 is plotted against area and a least squares regression line is then fitted to the linearised plot.

The equation of this least squares regression line is

(width)2 = 1.8 + 0.8 × area

Using this equation, a leaf with a surface area of 120 cm² is predicted to have a width, in cm, closest to 

A.     9.2

B.     9.9

C.   10.6

D.   84.6

E.   97.8

Show Answers Only

`B`

Show Worked Solution

`text(Substituting)`

`text(Width)^2` `=1.8+0.8 xx area`                           
  `=1.8+(0.8×120)`
  `=97.8`
`:.\ text(Width)` `=\sqrt97.8`
  `=9.889…\ text(cm)`

`=> B`

Filed Under: Correlation and Regression Tagged With: Band 4, smc-265-71-Linearise - Squared/Inverse

CORE, FUR1 2013 VCAA 7 MC

For a city, the correlation coefficient between

  • population density and distance from the centre of the city is `r` = – 0.563
  • house size and distance from the centre of the city is `r` = 0.357.

Given this information, which one of the following statements is true?

  1. Around 31.7% of the variation observed in house size in the city can be explained by the variation in distance from the centre of the city.
  2. Population density tends to increase as the distance from the centre of the city increases.
  3. House sizes tend to be larger as the distance from the centre of the city decreases.
  4. The slope of a least squares regression line relating population density to distance from the centre of the city is positive.
  5. Population density is more strongly associated with distance from the centre of the city than is house size.
Show Answers Only

`E`

Show Worked Solution

`text(Population density)`

♦ Mean mark 49%.

`r^2=(-0.563)^2=0.3169…~~31.7%`

`text(House size)`

`r^2=(0.357)^2 = 0.1274…~~12.7%`


`text(In A, 12.7% of the variability is explained. Not true.)`

`text(In B,)\ r = –0.563. text(The negative correlation means population)`

`text(density increases as distance decreases. Not true.)`

`text(In C, statement assumes a negative correlation which is not the case)`

`text(given)\ r = 0.357.\ \ text(Not true.)`

`text(In D, negative correlation would have a negatively slope. Not true.)`

`text{In E, true since}\ \ | \ r^2\  |\ \ text{for house size is greater.}`

`=>\ E`

Filed Under: Correlation and Regression Tagged With: Band 4, smc-265-10-r / r^2 and Association

Quadratic, EXT1 2008 HSC 4c

2008 4c

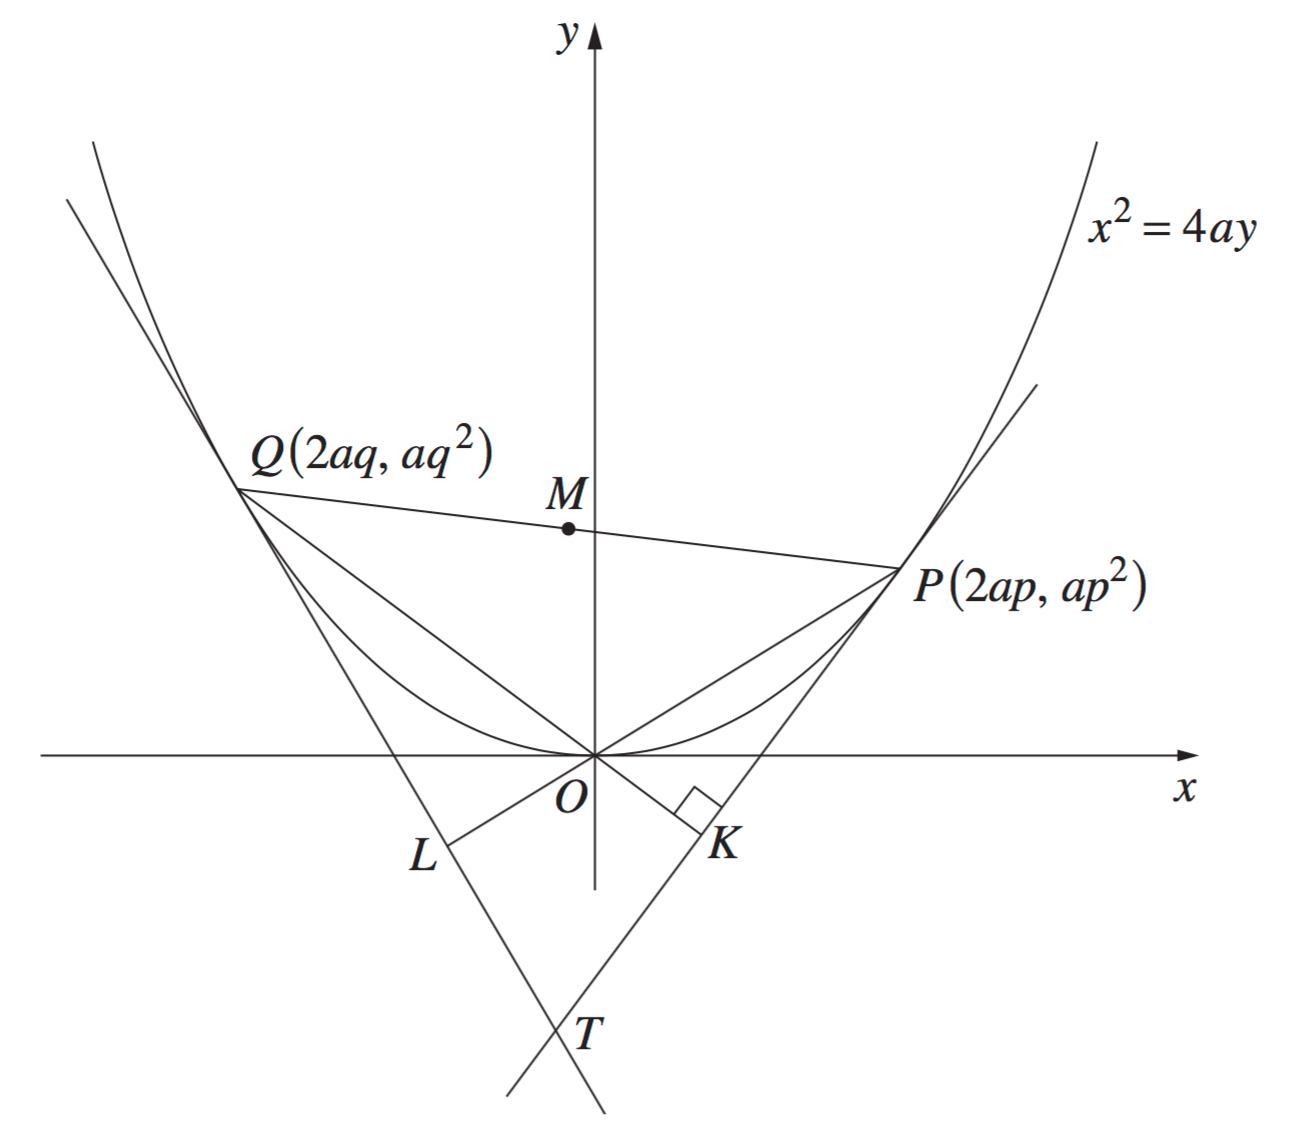
The points  `P(2ap, ap^2)`,  `Q(2aq, aq^2)`  lie on the parabola  `x^2 = 4ay`. The tangents to the parabola at  `P`  and  `Q`  intersect at  `T`. The chord  `QO`  produced meets  `PT`  at  `K`, and  `/_PKQ`  is a right angle.

  1. Find the gradient of  `QO`, and hence show that  `pq = –2`.   (2 marks)
  2. The chord  `PO`  produced meets  `QT`  at  `L`. Show that  `/_PLQ`  is a right angle.   (1 mark)
  3. Let  `M`  be the midpoint of the chord  `PQ`. By considering the quadrilateral  `PQLK`, or otherwise, show that  `MK = ML`.   (2 marks)


Show Answers Only
  1. `text(Proof)\ \ text{(See Worked Solutions)}`
  2. `text(Proof)\ \ text{(See Worked Solutions)}`
  3. `text(Proof)\ \ text{(See Worked Solutions)}`
Show Worked Solution

(i)  `Q(2aq, aq^2),\ \ \ \ O(0,0)`

`m_(QO)` `= (y_2 – y_1)/(x_2 – x_1)`
  `= (aq^2 – 0)/(2aq – 0)`
  `= q/2`

`text(Gradient of tangent at)\ P = p`


`text(We know the extension of chord)\ \ QO _|_ PT\ \ \ text{(given)}`

`m_(QO) xx m_(PT)` `= -1`
`q/2 xx p` `= -1`
`:. pq` `= -2\ \ \ text(… as required.)`


(ii)  `m_(PO) = (ap^2-0)/(2ap-0) = p/2`

`m\ text(of tangent)\ QT = q`

`m_(PO) xx m_(QT)` `= p/2 xx q`
  `= (pq)/2`
  `= (-2)/2\ \ \ text{(from (i))}`
  `= -1`


`:.\ /_PLQ\ text(is a right angle.)`


(iii)  `PQ\ text(subtends 2 right-angles at)\ L\ text(and)\ K`

`=>\ PQLK\ text(is a cyclic quad, with)\ \ PQ`

`text(a diameter.)`


`=> text(Midpoint of)\ PQ=M\ \ \ text{(centre of the circle)}`

`:.\ MK = ML\ \ text{(radii)}`

Filed Under: 9. Quadratics and the Parabola EXT1 Tagged With: Band 4, Band 5

Combinatorics, EXT1 A1 2008 HSC 4b

Barbara and John and six other people go through a doorway one at a time.

  1. In how many ways can the eight people go through the doorway if John goes through the doorway after Barbara with no-one in between?   (1 mark)

    --- 2 WORK AREA LINES (style=lined) ---

  2. Find the number of ways in which the eight people can go through the doorway if John goes through the doorway after Barbara.   (1 mark)

    --- 6 WORK AREA LINES (style=lined) ---

Show Answers Only

a.    `5040`

b.    `20\ 160`

Show Worked Solution

a.    `text(Barbara and John can be treated as one person)`

`:.\ text(#Combinations)= 7! = 5040`
 

b.    `text(Solution 1)`

`text(Total possible combinations)=8!`

`text(Barbara has an equal chance of being behind as)`

`text(being in front of John.)`
 

`:.\ text{#Combinations (John before Barbara)}`

`=(8!)/2 =20\ 160`
 

`text(Solution 2)`

`text(If)\ B\ text(goes first,)\ J\ text(has 7 options and the other)`

`text(6 people can go in any order.)`

`=> text(#Combinations) = 7 xx 6!`
 

`text(If)\ B\ text(goes second,)\ J\ text(has 6 options)`

`=> text(#Combinations) = 6 xx 6!`
 

`text(If)\ B\ text(goes third,)\ J\ text(has 5 options)`

`=> text(#Combinations) = 5 xx 6!`

`text(And so on…)`
 

`:.\ text(Total Combinations)`

`= 7 xx 6! + 6 xx 6! + … + 1 xx 6!`

`= 6! ( 7 + 6 + 5 + 4 + 3 + 2 + 1)`

`= 6! ( 28)`

`= 20\ 160`

Filed Under: Permutations and Combinations, Permutations and Combinations (Y11), Permutations and Combinations EXT1 Tagged With: Band 4, Band 5, smc-1082-10-Ordered Combinations, smc-6638-10-Ordered Combinations

Calculus, EXT1 C1 2008 HSC 3c

2008 3c
A race car is travelling on the `x`-axis from `P` to `Q` at a constant velocity, `v`.

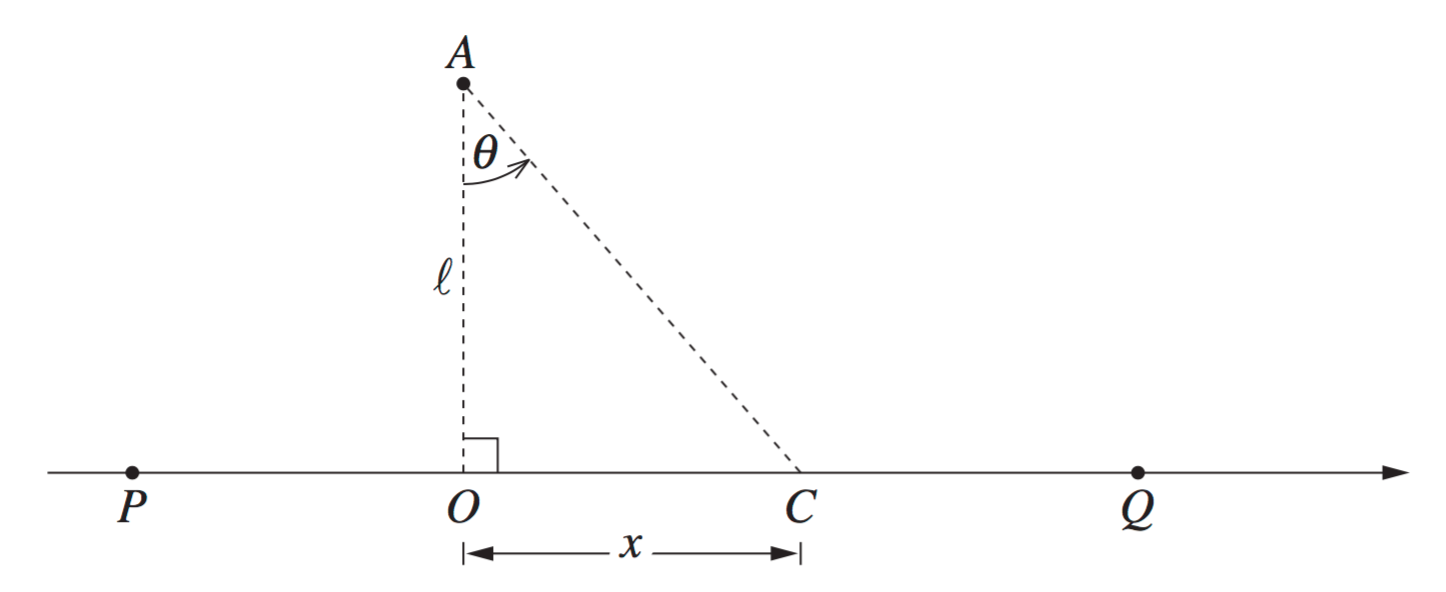
A spectator is at `A` which is directly opposite `O`, and  `OA = l`  metres. When the car is at `C`, its displacement from `O` is `x` metres and `/_OAC = theta`, with  `- pi/2 < theta < pi/2`.

  1. Show that  `(d theta)/(dt) = (vl)/(l^2 + x^2)`.   (2 marks)

    --- 8 WORK AREA LINES (style=lined) ---

  2. Let `m` be the maximum value of `(d theta)/dt`.  


    Find the value of `m` in terms of `v` and `l`.   (1 mark)

    --- 2 WORK AREA LINES (style=lined) ---

  3. There are two values of `theta` for which  `(d theta)/(dt) = m/4`.


    Find these two values of `theta`.   (2 marks)

    --- 6 WORK AREA LINES (style=lined) ---

Show Answers Only

a.    `text(Proof)\ \ text{(See Worked Solutions)}`

b.    `v/l`

c.    `+- pi/3`

Show Worked Solution

a.  `text(Show)\ \ (d theta)/(dt) = (vl)/(l^2 + x^2)`

`(d theta)/(dt)` `= (d theta)/(dx) * (dx)/(dt)\ \ \ \ \ \ \ …\ (1)`
`v` `= (dx)/(dt)\ \ \ text{(given)}`

 
`text(Find)\ (d theta)/(dx):`

`tan theta` `= x/l`
`theta` `= tan^-1 (x/l)`
`(d theta)/(dx)` `= l/(l^2+x^2)`

 
`text{Substituting into (1):}`

`(d theta)/(dt)= l/(l^2+x^2) xx v= (vl)/(l^2 + x^2)\ \ \ text(… as required)`
 

b.    `(d theta)/(dt)\ \ text(is a MAX when)\ \ x = 0`

`:. m= (vl)/(l^2 + 0^2)= v/l`
 

c.    `text(Find)\ theta\ text(when)\ \ (d theta)/(dt) = m/4`

MARKER’S COMMENT: Many students lost marks by not giving their answer in the specified range. Be careful!
`(d theta)/(dt)` `= v/(4l)`
`(vl)/(l^2 +x^2)` `= v/(4l)`
`l^2 + x^2` `= 4l^2`
`x^2` `= 3l^2`
`x` `= +- sqrt3 l`


`tan theta` `= x/l= +- sqrt 3`
`:. theta` `= +- pi/3,\ \ \ \ \ (- pi/2 < theta < pi/2)`

Filed Under: 13. Trig Calc, Graphs and Circular Measure EXT1, 5. Trig Ratios EXT1, Inverse Trig Functions EXT1, Rates of Change EXT1, Related Rates of Change, Related Rates of Change Tagged With: Band 4, Band 5, smc-1079-40-Other Themes, smc-7351-40-Other Themes

Proof, EXT1 P1 2008 HSC 3b

Use mathematical induction to prove that, for integers  `n >= 1`,

`1 xx 3 + 2 xx 4 + 3 xx 5 + ... + n(n+2) = n/6 (n + 1)(2n + 7)`.   (3 marks)

--- 14 WORK AREA LINES (style=lined) ---

Show Answers Only

`text(Proof)\ \ text{(See Worked Solutions)}`

Show Worked Solution

`text(Prove)\ \ 1 xx 3 + 2 xx 4 + 3 xx 5 + … + n(n+2)`

`= n/6 (n+1)(2n + 7)\ \ \ text(for)\ n >= 1`

`text(If)\ \ n = 1`

`text(LHS) = 1 xx 3 = 3`

`text(RHS) = 1/6 (2)(9) = 3 = text(LHS)`

`:.\ text(True for)\ \ n = 1`

 
`text(Assume true for)\ \ n = k`

`text(i.e.)\ \ 1 xx 3 + 2 xx 4 + … + k (k + 2)`

`= k/6 (k + 1)(2k + 7)`

 
`text(Prove true for)\ \ n = k + 1`

`text(i.e.)\ \ 1 xx 3 + 2 xx 4 + … + k(k+2) + (k + 1)(k + 3)`

`= ((k+1))/6 (k + 2)(2k + 9)`

`text(LHS)` `= k/6 (k + 1)(2k + 7) + (k + 1)(k + 3)`
  `= 1/6 (k + 1)[k(2k + 7) + 6(k + 3)]`
  `= 1/6 (k + 1)[2k^2 + 7k + 6k + 18]`
  `= 1/6 (k + 1)[2k^2 + 13k + 18]`
  `= 1/6 (k +1)(k + 2)(2k + 9)\ \ \ \ text(… as required)`

 
`=>\ text(True for)\ n = k + 1`

`:.\ text(S) text(ince true for)\ n = 1,\ text(by PMI, true for integral)\ n >= 1.`

Filed Under: 7. Induction and Other Series EXT1, Induction (Y12), P1 Induction (Y12) Tagged With: Band 4, smc-1019-20-Sum of a Series, smc-7281-20-Sum of a Series

Functions, EXT1 F1 2008 HSC 3a

  1.  Sketch the graph of  `y = |\ 2x-1\ |`.   (1 mark)

    --- 8 WORK AREA LINES (style=lined) ---

  2.  Hence, or otherwise, solve  `|\ 2x-1\ | <= |\ x-3\ |`.    (3 marks)

    --- 5 WORK AREA LINES (style=lined) ---

Show Answers Only

a.    

Real Functions, EXT1 2008 HSC 3a Answer

b.    `-2 <= x <= 4/3`

Show Worked Solution
a.    Real Functions, EXT1 2008 HSC 3a Answer


b.    `text(Solving for)\ \ |\ 2x-1\ | <= |\ x-3\ |`

`text(Graph shows the statement is TRUE between the)`

`text(points of intersection.)`

`=>\ text(Intersection occurs when)`

`(2x-1)` `= (x-3)\ \ \ text(or)\ \ \ ` `-(2x-1)` `= x-3`
`x` `= -2` `-2x + 1` `= x-3`
    `-3x` `= -4`
    `x` `= 4/3`


`:.\ text(Solution is)\ \ {x: -2 <=  x <= 4/3}`

Filed Under: 1. Basic Arithmetic and Algebra EXT1, 4. Real Functions EXT1, Graphical Relationships, Inequalities, Inequalities Tagged With: Band 3, Band 4, smc-1033-20-Absolute Value, smc-1072-30-\(y=\abs{f(x)}; y=f(\abs{x}) \), smc-6640-30-\(y=\abs{f(x)}; y=f(\abs{x}) \), SMc-6643-20-Absolute Value, y = f(|x|)

Measurement, STD2 M7 EQ-Bank 22

Bronwyn needs to have 3.0 litres of intravenous liquid given to her over a period of 4 hours. 

What is the required flow rate in mL per minute?   (2 marks) 

--- 4 WORK AREA LINES (style=lined) ---

Show Answers Only

`12.5\ text(mL/minute)`

Show Worked Solution

`text(Total liquid)= 3.0 xx 1000= 3000\ text(mL)`

`text(Total minutes)= 4 xx 60= 240`

`:.\ text(Flow Rate)= 3000/240= 12.5\ text(mL/minute)`

Filed Under: Medication, Rates, Rates Tagged With: Band 4, smc-6932-55-Other Rate Problems, smc-805-30-Medication

Measurement, STD2 M7 EQ-Bank 26

A medication is available in both tablet and liquid form.  A tablet contains 50 mg of the active ingredient while the liquid form contains 60 mg per 10 mL.  

Michael likes taking tablets and Georgia prefers liquid medicines.  If they each need 0.2 g of the active ingredient, what dosages do they take?   (3 marks) 

--- 6 WORK AREA LINES (style=lined) ---

Show Answers Only

`text(Michael takes 4 tablets and Georgia takes 33.3mL.)`

Show Worked Solution

`text(Michael – tablets)`

`0.2\ text(g) = 200\ text(mg)`

`:.\ text(# Tablets)=200/50= 4`

 
`text(Georgia – liquid)`

`60\ text(mg in)\ 10\ text(mL)`

`1\ text(mg) = 10/60 = 0.166…\ text(mL)`

`200\ text(mg)= 200 xx 0.166…= 33.3\ text(mL)\ \ text{(to 1 d.p.)}`
  

`:.\ text(Michael takes 4 tablets and Georgia takes 33.3 mL.)`

Filed Under: Medication, Rates, Rates Tagged With: Band 4, smc-6932-55-Other Rate Problems, smc-805-30-Medication

Financial Maths, STD2 F5 EQ-Bank 28

Dominique wants to save $15 000 to use as spending money when she travels overseas in 2 years' time.  

If she invests $3500 at the end of every 6 months into an account earning 4% p.a., compounded half-yearly, will she have enough?

Use the table below to justify your answer.   (2 marks)


--- 4 WORK AREA LINES (style=lined) ---

Show Answers Only

`text(Dominique will not have saved)`

`text(enough to reach)\ $15\ 000.`

Show Worked Solution

`text(Interest rate)\ text{(6 monthly)} = text(4%)  -: 2 = text(2%)`

`n = 4\ \ \ text{(6 month periods in 2 years)}`

`=>\ text(FVA factor) = 4.122\ \ \ text{(from Table)}`

`text(FVA)= 3500 xx 4.122= $14\ 427`
   

 `:.\ text(Dominique will not have saved enough to)`

`text(reach)\ $15\ 000.`

Filed Under: Annuities (Y12), F5 Annuities (Y12), FM5 - Annuities and Loan repayments, Modelling Investments and Loans Tagged With: Band 4, common-content, smc-1002-40-FV Annuity Table, smc-6912-10-FV of $1 Annuity Table, smc-816-10-FV of $1 Annuity Table

Financial Maths, STD2 F5 EQ-Bank 30

Camilla buys a car for $21 000 and repays it over 4 years through equal monthly instalments.

She pays a 10% deposit and interest is charged at 9% p.a. on the reducing balance loan.

Using the Table of present value interest factors below, where `r` represents the monthly interest and `N` represents the number of repayments
 

2UG FM5 S-2 

  1. Calculate the monthly repayment,  `$P`, that Camilla must pay to complete the loan after 4 years  (to the nearest $).   (3 marks)

    --- 6 WORK AREA LINES (style=lined) ---

  2. Calculate the total interest paid over the life of the loan.    (1 mark)

    --- 1 WORK AREA LINES (style=lined) ---

Show Answers Only

a.    `text(Camilla must repay $470 per month)`

b.    `$3660`

Show Worked Solution

a.    `text(Deposit) = 10text(%) xx 21\ 000 = $2100`

`text(Loan Value)= 21\ 000-2100= $18\ 900` 

`text(Monthly interest rate) = text(9%)/12 = 0.0075`

`text(# Repayments) = 4 xx 12 = 48`

`=>\ text(PVA Factor) = 40.18478\ \ text{(from Table)}`

`text(Monthly repayment)\ ($P)` `= (18\ 900)/(40.18478)`
  `= 470.32…= $470\ text{(nearest $)}`

   
`:.\ text(Camilla must repay $470 per month.)`


b.    `text(Total Repayments)= 48 xx 470= $22\ 560`
   

`:.\ text(Interest paid over loan)= 22\ 560-18\ 900= $3660`

Filed Under: Annuities (Y12), F5 Annuities (Y12), FM5 - Annuities and Loan repayments, Modelling Investments and Loans Tagged With: Band 4, Band 5, common-content, smc-1002-50-PV Annuity Table, smc-6912-20-PV of $1 Annuity Table, smc-816-20-PV of $1 Annuity Table

Functions, EXT1 F2 2008 HSC 2c

The polynomial `p(x)` is given by  `p(x) = ax^3 + 16x^2 + cx-120`, where `a` and `c` are constants.

The three zeros of `p(x)` are `-2,  3` and `beta`.

Find the value of `beta`.   (3 marks) 

--- 6 WORK AREA LINES (style=lined) ---

Show Answers Only

`-5`

Show Worked Solution

`p(x) = ax^3 + 16x^2 + cx-120`

`text(Roots:)\ \ -2, \ 3, \ beta`

`-2 + 3 + beta` `= -B/A`
`beta + 1` `= -16/a`
`beta` `= -16/a-1\ \ \ \ \ …\ (1)`


`-2 xx 3 xx beta` `= -D/A`
`-6 beta` `= 120/a`
`beta` `= -20/a\ \ \ \ \ …\ (2)`


MARKER’S COMMENT: Many students displayed significant inefficiencies in solving simultaneous equations.
`- 16/a-1` `= -20/beta`
`-16-a` `= -20`
`a` `= 4`

 
`text(Substitute)\ \ a = 4\ \ text(into)\ (1):`

`beta=-16/4-1= -5`

Filed Under: Roots, Remainders and Factors, Sum, Products and Multiplicity of Roots, Sums and Products of Zeroes Tagged With: Band 3, Band 4, smc-1205-10-Sum and Product, smc-6645-10-Sum and Product

Mechanics, EXT2* M1 2008 HSC 2b

A particle moves on the `x`-axis with velocity `v`. The particle is initially at rest at  `x = 1`. Its acceleration is given by  `ddot x = x + 4`.

Using the fact that  `ddot x = d/dx (1/2 v^2)`, find the speed of the particle at  `x = 2`.   (3 marks)

--- 8 WORK AREA LINES (style=lined) ---

Show Answers Only

`sqrt11`

Show Worked Solution
`ddot x` `= d/dx (1/2 v^2)=x+4`
`1/2 v^2` `= int ddot x\ dx`
  `= int x + 4\ dx`
  `= 1/2 x^2 + 4x + c`

 
`text(When)\ \ x = 1, v = 0:`

`0= 1/2 + 4 + c\ \ =>\ \ c=4 1/2`

`:.\ 1/2 v^2` `= 1/2 x^2 + 4x-4 1/2`
`v^2` `= x^2 + 8x-9`

 
`text(When)\ \ x = 2:`

`v^2` `= 2^2 + 8 * 2-9= 11`
`v` `= +- sqrt 11`

 
`:.\ text(When)\ x = 2,\ \ text(Speed) = sqrt 11`

Filed Under: Forces and Further Motion in a Straight Line, Motion Without Resistance, Other Motion EXT1 Tagged With: Band 4, smc-1060-02-Motion as f(x), smc-1060-10-Polynomial, smc-7437-10-Motion as \(\large \ f(x)\), smc-7437-60-Polynomial

Calculus, EXT1 C2 2008 HSC 2a

Use the substitution  `u = log_e x`  to evaluate  `int_e^(e^2) 1/(x (log_e x)^2)\ dx`.   (3 marks)

--- 6 WORK AREA LINES (style=lined) ---

Show Answers Only

`1/2`

Show Worked Solution
`u` `= log_e x`
`(du)/(dx)` `= 1/x`
`:. du` `= 1/x\ dx`
`text(When)\ \ \ ` `x = e^2,\ \ ` `u = log_e e^2 = 2`
  `x = e,` `u = 1`

 
`:. int_e^(e^2) 1/(x (log_e x)^2)\ dx`

`= int_1^2 1/(u^2)\ du`

WARNING: Most errors were made in the last stage of substitution in this question. Be careful!

`= int_1^2 u^(-2)\ du`

`= [-1/u]_1^2`

`= [(-1/2) – (-1)]`

`= 1/2`

Filed Under: 11. Integration EXT1, Integration By Substitution, Integration By Substitution Tagged With: Band 4, smc-1036-40-Logs and Exponentials, smc-7290-40-Logs and Exponentials

L&E, EXT1 2008 HSC 1f

Let  `f(x) = log_e [(x - 3)(5 - x)]`.

What is the domain of  `f(x)`?   (2 marks)

Show Answers Only

`text(Domain)\ {x:\ 3<x<5}`

Show Worked Solution

`f(x) = log_e [(x – 3)(5 – x)]`

`text(Find the domain)`

`(x – 3)(5 – x)>0`


L&E, EXT1 2008 HSC 1f Answer

`text(If)\ \ x = 4,`

`(4 – 3)(5 – 4) = 1 > 0`

`:.\ text(Domain)\ {x:\ 3<x<5}`

Filed Under: 12. Logs and Exponentials EXT1 Tagged With: Band 4

Trig Calculus, EXT1 2008 HSC 1e

Evaluate  `int_0^(pi/4) cos theta sin^2 theta\ d theta`.   (2 marks)

Show Answers Only

`sqrt2/12`

Show Worked Solution

`int_0^(pi/4) cos theta sin^2 theta\ d theta`

`= [1/3 sin^3 theta]_0^(pi/4)`

`= 1/3 (sin (pi/4))^3 – 1/3 (sin 0)^3`

`= 1/3 * (1/sqrt2)^3`

`= 1/3 * 1/(2 sqrt2)`

`= 1/(6 sqrt 2) xx sqrt2/sqrt2`

`= sqrt2/12`

Filed Under: 13. Trig Calc, Graphs and Circular Measure EXT1 Tagged With: Band 4

Combinatorics, EXT1 A1 2008 HSC 1d

Find an expression for the coefficient of `x^8 y^4` in the expansion of `(2x + 3y)^12`.   (2 marks) 

--- 6 WORK AREA LINES (style=lined) ---

Show Answers Only

`10\ 264\ 320`

Show Worked Solution

`text(Find co-efficient of)\ x^8 y^4 :`

MARKER’S COMMENT: More errors were made by students who used `T_(k+1)` as the general term rather than `T_k` (both are possible).

`T_k =\ text(General term of)\ (2x + 3y)^12 `

`T_k` `= ((12),(k)) (2x)^(12-k) * (3y)^k`
  `= ((12),(k)) * 2^(12-k) * 3^k * x^(12-k) * y^k`

 
`x^8 y^4\ text(occurs when)\ k = 4`

`T_4= ((12),(4)) * 2^(12-4) * 3^4 * x^8 y^4`

`:.\ text(Co-efficient of)\ x^8y^4= ((12),(4)) * 2^8 * 3^4= 10\ 264\ 320`

Filed Under: 17. Binomial EXT1, Binomial Expansion, The Binomial Theorem (Y11) Tagged With: Band 4, smc-1088-10-Coefficients, smc-6639-10-Coefficients

Measurement, 2UG 2008 HSC 28b

A tunnel is excavated with a cross-section as shown.


  1. Find an expression for the area of the cross-section using TWO applications of Simpson’s rule.  (2 marks)
  2. The area of the cross-section must be 600 m2. The tunnel is 80 m wide.   
  3. If the value of `a` increases by 2 metres, by how much will `b` change?   (2 marks)


Show Answers Only
  1. `(2h)/3 (4a + b)`
  2.  
  3. `b\ text(decreases by 8 m.)`
Show Worked Solution
(i)    `A` `~~ h/3 [y_0 + 4y_1 + y_2] + h/3 [y_0 + 4y_1 + y_2]`
    `~~ h/3 [0 + 4a + b] + h/3 [b + 4a + 0]`
    `~~ (2h)/3 (4a + b)`


(ii)    `text(Given)\ \ A = 600\ text(m²)`
  `text(If 80 m wide) \ => h = 20`


`A` `= (2h)/3 (4a + b)`
`600` `= ((2 xx 20))/3 (4a + b)`
`4a + b` `= (600 xx 3)/40`
`b` `= 45 – 4a`

 
`:.\ text(If)\ a\ text(increases by 2 m,)\ b\ text(will)`

`text(decrease by 8 m.)`

Filed Under: Other Linear Modelling, Simpson's Rule/Measurement Error Tagged With: Band 4, Band 6, HSC

Statistics, STD2 S5 2008 HSC 28a

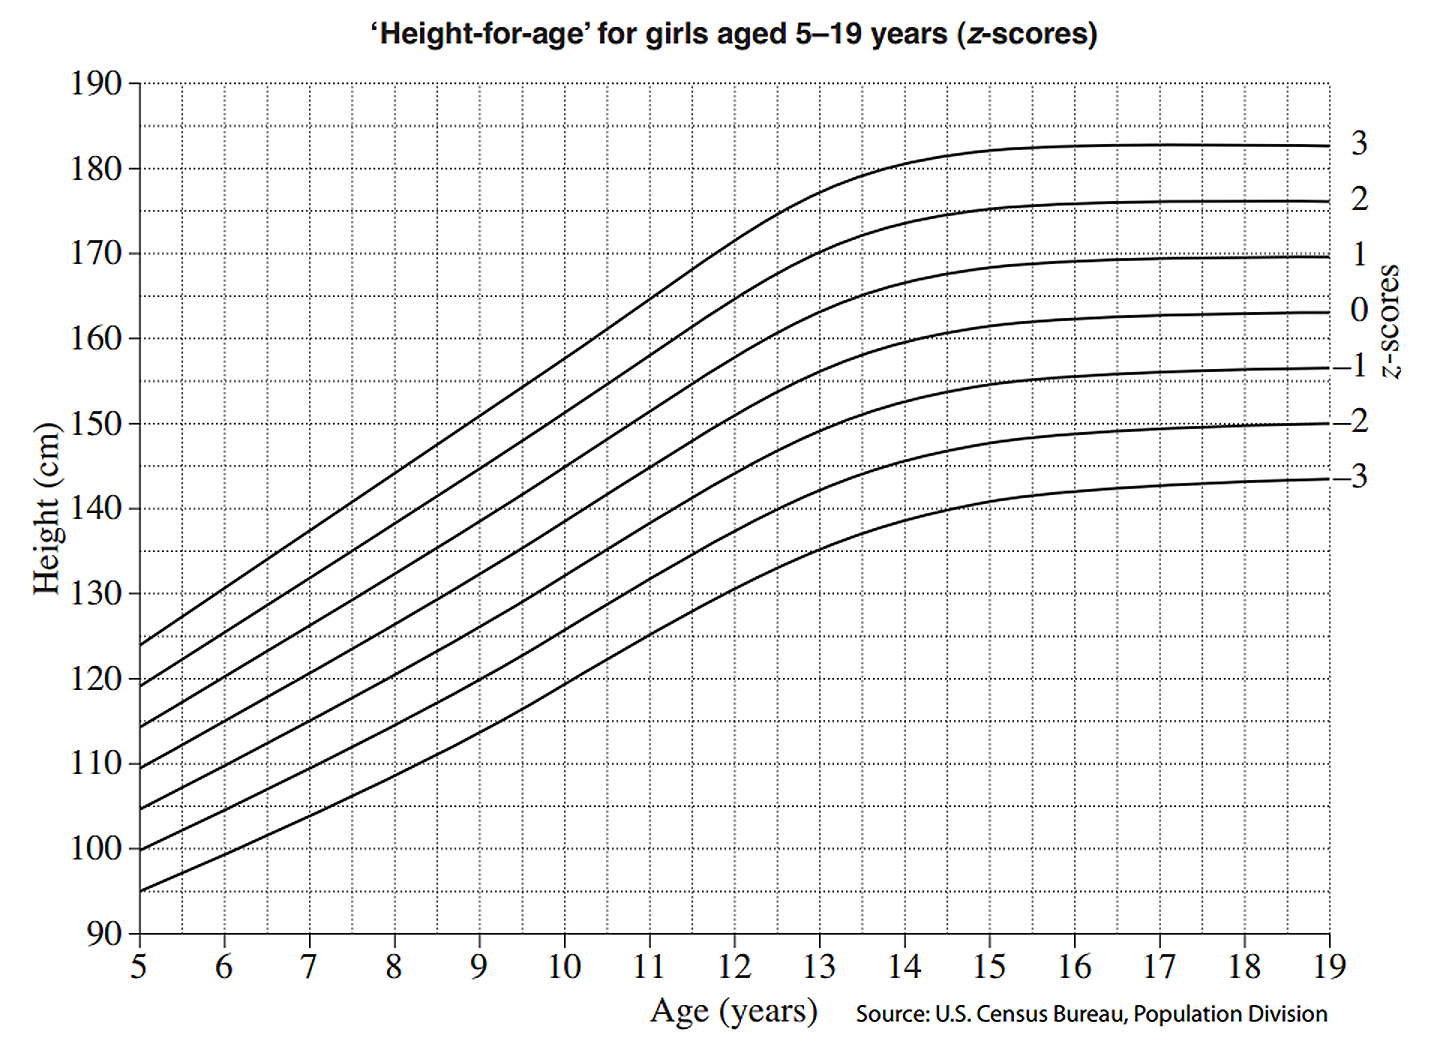
The following graph indicates  `z`-scores of ‘height-for-age’ for girls aged  5 – 19 years.
 

  1. What is the `z`-score for a six year old girl of height 120 cm?   (1 mark)

    --- 2 WORK AREA LINES (style=lined) ---

  2. Rachel is 10 ½  years of age. 


    (1)  If  2.5% of girls of the same age are taller than Rachel, how tall is she?   (1 mark)

    --- 1 WORK AREA LINES (style=lined) ---


    (2)  Rachel does not grow any taller. At age 15 ½, what percentage of girls of the same age will be taller than Rachel?   (2 marks)

    --- 4 WORK AREA LINES (style=lined) ---

  3. What is the average height of an 18 year old girl?  (1 mark)

    --- 1 WORK AREA LINES (style=lined) ---

For adults (18 years and older), the Body Mass Index is given by

`B = m/h^2`  where  `m = text(mass)`  in kilograms and  `h = text(height)`  in metres.

The medically accepted healthy range for  `B`  is  `21 <= B <= 25`.

  1. What is the minimum weight for an 18 year old girl of average height to be considered healthy?   (2 marks)

    --- 4 WORK AREA LINES (style=lined) ---

  2. The average height, `C`, in centimetres, of a girl between the ages of 6 years and 11 years can be represented by a line with equation
     
            `C = 6A + 79`   where `A` is the age in years. 
     
    (1)  For this line, the gradient is 6. What does this indicate about the heights of girls aged 6 to 11?   (1 mark)

    --- 2 WORK AREA LINES (style=lined) ---


    (2)  Give ONE reason why this equation is not suitable for predicting heights of girls older than 12.   (1 mark)

    --- 2 WORK AREA LINES (style=lined) ---

Show Answers Only
  1. `1`
  2. (1) `155\ text(cm)`


    (2) `text(84%)`

  3. `163\ text(cm)`
  4. `55.8\ text(kg)`
  5. (1) `text(It indicates that 6-11 year old girls)`


          `text(grow, on average, 6cm per year)`


    (2) `text(Girls eventually stop growing, and the)`


          `text(equation doesn’t factor this in.)`

Show Worked Solution
i.    `z text(-score) = 1`


ii. (1)   `text(If 2 ½ % are taller than Rachel)`
    `=> z text(-score of +2)`
    `:.\ text(She is 155 cm)`
     
   (2)   `text(At age)\ 15\ ½,\ 155\ text(cm has a)\ z text(-score of –1)`
    `text(68% between)\ z = 1\ text(and)\ –1`
    `=> text(34% between)\ z = 0\ text(and)\ –1`
    `text(50% have)\ z >= 0`
     
    `:.\ text(% Above)\ z text(-score of –1)`
    `= 50 + 34`
    `= 8text(4%)`

 
`:.\ text(84% of girls would be taller than Rachel at age)\ 15 ½.`


iii.   `text(Average height of 18 year old has)\ z text(-score = 0)`
  `:.\ text(Average height) = 163\ text(cm)`


iv.   `B = m/h^2`
  `h = 163\ text(cm) = 1.63\ text(m)`


`text(Given)\ \ 21 <= B <= 25,\ text(minimum healthy)`

`text(weight occurs when)\ B = 21`

`=> 21` `= m/1.63^2`
`m` `= 21 xx 1.63^2`
  `= 55.794…`
  `= 55.8\ text(kg)\ text{(1 d.p.)}`


v. (1)   `text(It indicates that 6-11 year old girls, on average, grow)`
    `text(6 cm per year.)`
  (2) `text(Girls eventually stop growing, and the equation doesn’t)`
    `text(factor this in.)`

Filed Under: DS5/6 - Normal Distribution and Sampling, Exponential/Quadratic (Projectile), Normal Distribution, Other Linear Modelling, S5 The Normal Distribution (Y12) Tagged With: Band 4, Band 5, Band 6, common-content, page-break-before-question, smc-819-10-Single z-score, smc-819-40-Graphs, smc-995-10-Single z-score, smc-995-40-Graphs

Financial Maths, STD2 F4 2008 HSC 27c

A plasma TV depreciated in value by 15% per annum. Two years after it was purchased it had depreciated to a value of $2023, using the declining balance method.

What was the purchase price of the plasma TV?   (2 marks)

--- 4 WORK AREA LINES (style=lined) ---

Show Answers Only

`$2800`

Show Worked Solution

`S = V_0 (1-r)^n`

`2023` `= V_0 (1-0.15)^2`
`2023` `= V_0 (0.85)^2`
`V_0` `= 2023/0.85^2`
  `= 2800`


`:.\ text(The purchase price) = $2800`

Filed Under: Depreciation, Depreciation, Depreciation, Depreciation - Declining Balance, Depreciation - Declining Balance, Depreciation / Running costs Tagged With: Band 4, num-title-ct-coreb, num-title-qs-hsc, smc-1139-30-Find V, smc-4335-28-Find V, smc-6845-20-Declining Balance, smc-6925-20-Declining Balance, smc-813-30-Find V

Measurement, 2UG 2008 HSC 27a

An aircraft travels at an average speed of  913 km/h. It departs from a town in Kenya  (0°, 38°E)  on Tuesday at 10 pm and flies east to a town in Borneo  (0°, 113°E).

  1. What is the distance, to the nearest kilometre, between the two towns? (Assume the radius of Earth is 6400 km.) (2 marks)
  2. How long will the flight take? (Answer to the nearest hour.)   (1 mark)
  3. What will be the local time in Borneo when the aircraft arrives? (Ignore time zones.)   (2 marks)


Show Answers Only
  1. `8378\ text(km)`
  2. `9\ text(hours)`
  3. `text(12 midday on Wednesday)`
Show Worked Solution
(i)   `text(Angular difference in longitude)`

`= 113 – 38`

`= 75^@`
 

`text(Arc length)` `= 75/360 xx 2 xx pi xx 6400`
  `= 8377.58…`
  `= 8378\ text(km)\ text{(nearest km)}`

 
`:.\ text(The distance between the two towns is 8378 km.)`


(ii)    `text(Flight time)` `= text(Distance)/text(Speed)`
    `= 8378/913`
    `= 9.176…`
    `= 9\ text(hours)\ text{(nearest hr)}`


(iii)   `text(Time Difference)` `= 75 xx 4`
    `= 300\ text(minutes)`
    `= 5\ text(hours)`

 
`text(Kenya is further East)`

`=>\ text(Kenya is +5 hours)`
 

`:.\ text(Arrival time in Kenya)`

`= text{10 pm (Tues) + 5 hrs + 9 hrs}\ text{(flight)}`

`= 12\ text(midday on Wednesday)`

Filed Under: MM6 - Spherical Geometry Tagged With: Band 4

Statistics, STD2 S1 2008 HSC 26d

The graph shows the predicted population age distribution in Australia in 2008.


  1. How many females are in the 0–4 age group?   (1 mark)

    --- 1 WORK AREA LINES (style=lined) ---

  2. What is the modal age group?   (1 mark)

    --- 1 WORK AREA LINES (style=lined) ---

  3. How many people are in the 15–19 age group?   (2 marks)

    --- 4 WORK AREA LINES (style=lined) ---

  4. Give ONE reason why there are more people in the 80+ age group than in the 75–79 age group.   (1 mark)

    --- 2 WORK AREA LINES (style=lined) ---

Show Answers Only

a.    `600\ 000`

b.    `35-39`

c.    `1\ 450\ 000`

d.    `text(The 80+ group includes all people over 80)`

`text(and is not restricted by a 5-year limit.)`

Show Worked Solution

a.    `text{# Females} (0-4)= 0.6 xx 1\ 000\ 000= 600\ 000`

b.    `text(Modal age group)\ =35-39`

c.    `text{# Males} (15-19)= 0.75 xx 1\ 000\ 000= 750\ 000`

`text{# Females} (15-19)= 0.7 xx 1\ 000\ 000= 700\ 000`

`:.\ text{Total People} (15-19)` `= 750\ 000 + 700\ 000`
  `= 1\ 450\ 000`


d.     `text(The 80+ group includes all people over 80)`
  `text(and is not restricted by a 5-year limit.)`

Filed Under: Bar Charts and Histograms, Bar Charts and Histograms, Bar Charts and Histograms, Bar Charts, Histograms and Other Graphs, Data Analysis, Displaying Data - Bar Charts and Histograms, Displaying Data - Bar Charts and Histograms Tagged With: Band 3, Band 4, Band 5, common-content, num-title-ct-core, num-title-qs-hsc, smc-1128-15-Histograms, smc-4224-15-Mode, smc-4224-35-Describing datasets, smc-6310-20-Histograms, smc-6530-20-Histograms, smc-821-15-Histograms, smc-997-15-Histograms

Probability, STD2 S2 2008 HSC 26b

The retirement ages of two million people are displayed in a table.


  1. What is the relative frequency of the 51–55 year retirement age?   (1 mark)

    --- 1 WORK AREA LINES (style=lined) ---

  2. Describe the distribution.   (1 mark)

    --- 2 WORK AREA LINES (style=lined) ---

Show Answers Only

a.    `7/400`

b.    `text(Distribution is negatively skewed because as age increases, so does the)`

`text(number of people in each age bracket.)`

Show Worked Solution

a.    `text(Relative frequency)\ (51-55)`

`= text{# People (51-55)}/text(Total People)`

`= (35\ 000)/(2\ 000\ 000)= 7/400`
 

b.    `text(Distribution is negatively skewed because as age increases, so does the)`

`text(number of people in each age bracket.)`

Filed Under: Relative Frequency, Relative Frequency, Relative Frequency, Relative Frequency, Summary Statistics (no graph), Venn Diagrams and Expected/Relative Frequency Tagged With: Band 4, Band 5, common-content, smc-1133-10-Surveys/Two-Way Tables, smc-6936-30-Relative Frequency, smc-827-10-Surveys/Two-Way Tables, smc-990-10-Surveys/Two-Way Tables, smc-999-70-Other

Probability, STD2 S2 2008 HSC 26a

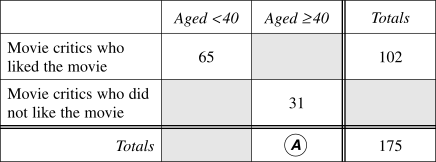
Cecil invited 175 movie critics to preview his new movie. After seeing the movie, he conducted a survey. Cecil has almost completed the two-way table.
 

  1. Determine the value of  `A`.   (1 mark)

    --- 1 WORK AREA LINES (style=lined) ---

  2. A movie critic is selected at random.


    What is the probability that the critic was less than 40 years old and did not like the movie?   (2 marks)

    --- 4 WORK AREA LINES (style=lined) ---

  3. Cecil believes that his movie will be a box office success if 65% of the critics who were surveyed liked the movie.


    Will this movie be considered a box office success? Justify your answer.   (1 mark)

    --- 2 WORK AREA LINES (style=lined) ---

Show Answers Only

a.    `58`

b.    `6/25`

c.    `text(Proof)\ \ text{(See Worked Solutions)}`

Show Worked Solution

a.    `text{Critics liked and}\ >= 40 = 102-65 = 37`

`A = 37+31=68`

 
b.
    `text{Critics did not like and < 40} = 175-65-37-31= 42`

`P text{(not like and  < 40)}= 42/175= 6/25`
 

c.    `text(Critics liked) = 102`

`text(% Critics liked)= 102/175 xx 100= 58.28…%`

`:.\ text{Movie NOT a box office success (< 65% critics liked)}`

Filed Under: Relative Frequency, Relative Frequency, Relative Frequency, Relative Frequency, Relative Frequency and Venn Diagrams, Venn Diagrams and Expected/Relative Frequency Tagged With: Band 3, Band 4, common-content, num-title-ct-pathb, num-title-qs-hsc, smc-1133-10-Surveys/Two-Way Tables, smc-4815-10-2-Way tables, smc-6936-20-Two-way Tables, smc-827-10-Surveys/Two-Way Tables, smc-990-10-Surveys/Two-Way Tables

Probability, STD2 S2 2008 HSC 25b

In a drawer there are 30 ribbons. Twelve are blue and eighteen are red.

Two ribbons are selected at random.

  1. Copy and complete the probability tree diagram.   (1 mark)


  2. What is the probability of selecting a pair of ribbons which are the same colour?   (2 marks)

    --- 4 WORK AREA LINES (style=lined) ---

Show Answers Only

a.

b.    `73/145`

Show Worked Solution

a. 

b.    `Ptext{(same colour)}`

`=\ text{P(BB) + P(RR)}`

`= 12/30 xx 11/29 + 18/30 xx 17/29`

`= 132/870 + 306/870= 73/145` 

Filed Under: Multi-stage Events, Multi-Stage Events, Single and Multi-Stage Events, Single and Multi-Stage Events Tagged With: Band 4, Band 5, smc-1135-10-Probability Trees, smc-6935-10-Probability Trees, smc-829-10-Probability Trees

Probability, STD2 S2 2008 HSC 24b

Three-digit numbers are formed from five cards labelled  1,  2,  3,  4  and  5.

  1. How many different three-digit numbers can be formed?  (1 mark)

    --- 1 WORK AREA LINES (style=lined) ---

  2. If one of these numbers is selected at random, what is the probability that it is odd?   (1 mark)

    --- 2 WORK AREA LINES (style=lined) ---

  3. How many of these three-digit numbers are even?   (1 mark)

    --- 2 WORK AREA LINES (style=lined) ---

  4. What is the probability of randomly selecting a three-digit number less than 500 with its digits arranged in descending order?   (2 marks)

    --- 4 WORK AREA LINES (style=lined) ---

Show Answers Only
  1. `60`
  2. `3/5`
  3. `24`
  4. `1/15`
Show Worked Solution

i.  `text(# Different numbers)`

♦ Mean mark 45%.

`= 5 xx 4 xx 3`

`= 60`


ii.  `text(The last digit must be one of the)`

`text(5 numbers, of which 3 are odd)`

`:.\ text{P(odd)} = 3/5`


iii. `text{P(even)} = 1- text{P(odd)} = 2/5`

♦ Mean mark 48%.

`:.\ text(Number of even numbers)`

`= 2/5 xx 60`

`= 24`


iv.  `text(The numbers that satisfy the criteria:)`

♦♦♦ Mean mark 10%.

`432, 431, 421, 321`

`:.\ text{P(selection)} = 4/60 = 1/15`

Filed Under: # Combinations, Combinations, Combinations and Single Stage Events, Multi-stage Events Tagged With: Band 4, Band 5, Band 6, smc-1134-20-Number Combinations, smc-828-20-Number Combinations

Financial Maths, STD2 F1 2008 HSC 24a

Bob is employed as a salesman. He is offered two methods of calculating his income.

\begin{array} {|l|}
\hline
\rule{0pt}{2.5ex}\text{Method 1: Commission only of 13% on all sales}\rule[-1ex]{0pt}{0pt} \\
\hline
\rule{0pt}{2.5ex}\text{Method 2: \$350 per week plus a commission of 4.5% on all sales}\rule[-1ex]{0pt}{0pt} \\
\hline
\end{array}

Bob’s research determines that the average sales total per employee per month is $15 670. 

  1. Based on his research, how much could Bob expect to earn in a year if he were to choose Method 1?   (2 marks)

    --- 4 WORK AREA LINES (style=lined) ---

  2. If Bob were to choose a method of payment based on the average sales figures, state which method he should choose in order to earn the greater income. Justify your answer with appropriate calculations.   (3 marks)

    --- 6 WORK AREA LINES (style=lined) ---

Show Answers Only
  1. `$24\ 445.20`
  2. `text(Proof)\ \ text{(See Worked Solutions)}`
Show Worked Solution

a.    `text(Method 1)`

`text(Yearly sales)= 12 xx 15\ 670= 188\ 040`

`:.\ text(Earnings)= text(13%) xx 188\ 040= $24\ 445.20`

b.    `text(Method 2)`

`text(In 1 Year, Weekly Wage)= 350 xx 52= 18\ 200`

`text(Commission)= text(4.5%) xx 188\ 040= 8461.80`
`text(Total earnings)= 18\ 200 + 8461.80= $26\ 661.80`

`:.\ text(Bob should choose Method 2.)`

Filed Under: Earning and Spending Money, Earning Money and Budgeting, Earning Money and Budgeting, FM1 - Earning money, Ways of Earning, Ways of Earning Tagged With: Band 3, Band 4, num-title-ct-corea, num-title-qs-hsc, smc-1126-20-Commission, smc-4226-20-Commission, smc-6276-20-Commission, smc-6515-20-Commission, smc-810-20-Commission

Statistics, STD2 S1 2008 HSC 23e

In a survey, 450 people were asked about their favourite takeaway food. The results are displayed in the bar graph.

2008 23e
 
How many people chose pizza as their favourite takeaway food?   (2 marks)

Show Answers Only

`175`

Show Worked Solution

`text(Number of people who chose pizza)`

COMMENT: This question required measurement of the actual image on the exam. The same methodology works here.

`= text{Length of pizza section}/text{Total length of bar} xx 450`

`~~ 7/18 xx 450~~ 175`
 

`:.\ 175\ text(people chose pizza.)`

Filed Under: Bar Charts, Histograms and Other Graphs, Displaying Data, Displaying Data - Other Charts, Other Chart Types, Other Charts, Other Graphs Tagged With: Band 4, common-content, num-title-ct-core, num-title-qs-hsc, smc-1128-28-Other Charts, smc-5076-15-Sector graphs and Divided Bar graphs, smc-6531-30-Other Charts, smc-822-40-Other Charts, smc-998-40-Other Charts

Algebra, 2UG 2008 HSC 23d

Solve  `(5x + 1)/2 = 4x - 7`.   (3 marks)

Show Answers Only

`5`

Show Worked Solution
`(5x + 1)/2` `= 4x – 7`
`5x + 1` `= 8x – 14`
`3x` `= 15`
`x` `= 5`

Filed Under: Linear and Other Equations Tagged With: Band 4

Measurement, STD2 M7 2008 HSC 23c

An alcoholic drink has 5.5% alcohol by volume. The label on a 375 mL bottle says it contains 1.6 standard drinks.

  1. How many millilitres of alcohol are in a 375 mL bottle?   (1 mark)

    --- 1 WORK AREA LINES (style=lined) ---

  2. It is recommended that a fully-licensed male driver should have a maximum of one standard drink every hour.


    Express this as a rate in millilitres per minute, correct to one decimal place.   (2 marks)

    --- 4 WORK AREA LINES (style=lined) ---

Show Answers Only

a.    `20.625\ text(mL)`

b.    `3.9\ text(mL/min)`

Show Worked Solution

a.    `text(Alcohol)= 5.5/100 xx 375= 20.625\ text(mL)`

b.    `text(S)text(ince 1.6 standard drinks = 375 mL)`

`rightarrow\ text(1 standard drink)= 375/1.6= 234.375\ text(mL)`

`:.\ text(Rate)= 234.375/60= 3.90625~~3.9\ text(mL/min)`
 

Filed Under: M4 Rates (Y12), MM1 - Units of Measurement, Rates, Rates, Rates Tagged With: Band 4, smc-1104-15-General rate problems, smc-6859-20-General Rate Problems, smc-6932-55-Other Rate Problems, smc-805-60-Other rate problems

Measurement, STD2 M1 2008 HSC 23b

The capacity of a bottle is measured as 1.25 litres correct to the nearest 10 millilitres.

What is the percentage error for this measurement?   (1 mark)

Show Answers Only

`text(0.4%)`

Show Worked Solution

`text(A) text(bsolute error) = 5\ text(mL)`

`:.\ text(% error)` `= 5/1250 xx 100`
  `=\ text(0.4%)`

Filed Under: Simpson's Rule/Measurement Error, Units and Measurement Error, Units and Measurement Error Tagged With: Band 4, smc-1120-10-Measurement Error, smc-797-10-Measurement Error

Measurement, STD2 M7 2008 HSC 20 MC

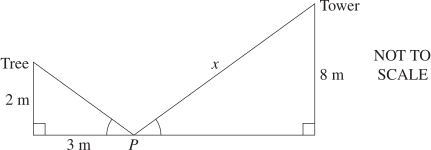
A point `P` lies between a tree, 2 metres high, and a tower, 8 metres high. `P` is 3 metres away from the base of the tree.

From `P`, the angles of elevation to the top of the tree and to the top of the tower are equal.
 

What is the distance, `x`, from `P` to the top of the tower?

  1. 9 m
  2. 9.61 m
  3. 12.04 m
  4. 14.42 m
Show Answers Only

`D`

Show Worked Solution

`text(Triangles are similar)\ \ text{(equiangular)}`

`text(In smaller triangle:)`

`h^2` `= 2^2 + 3^2`
  `= 13`
`h` `= sqrt 13`
   
`x/sqrt13` `= 8/2\ \ \ text{(sides of similar Δs in same ratio)}`
`x` `= (8 sqrt 13)/2`
  `= 14.422…`

 
`=>  D`

Filed Under: M5 Scale Drawings (Y12), Ratio and Scale, Similarity, Similarity and Scale Tagged With: Band 4, num-title-ct-pathc, num-title-qs-hsc, smc-1105-30-Similarity, smc-1187-60-Similarity, smc-4746-50-Real world applications

Probability, STD2 S2 2008 HSC 16 MC

A bag contains some marbles. The probability of selecting a blue marble at random from this bag is  `3/8`.

Which of the following could describe the marbles that are in the bag?

  1. `3`  blue,  `8`  red
  2. `6`  blue,  `11`  red
  3. `3`  blue,  `4`  red,  `4`  green
  4. `6`  blue,  `5`  red,  `5`  green 
Show Answers Only

`D`

Show Worked Solution

`P(B) = 3/8`

`text(In)\ A,\ \ ` `P(B) = 3/11`
`text(In)\ B,\ \ ` `P(B) = 6/17 `
`text(In)\ C,\ \ ` `P(B) = 3/11`
`text(In)\ D,\ \ ` `P(B) = 6/16 = 3/8`

`=>  D`

Filed Under: Combinations and Single Stage Events, Probability, Single and Multi-Stage Events, Single and Multi-Stage Events, Single and Multi-Stage Events, Single stage events Tagged With: Band 4, num-title-ct-core, num-title-qs-hsc, smc-1135-05-Simple Probability, smc-4225-15-Single-stage events, smc-6887-20-Simple Probability, smc-6935-05-Simple Probability, smc-828-10-Simple Probability

Financial Maths, STD2 F4 2008 HSC 15 MC

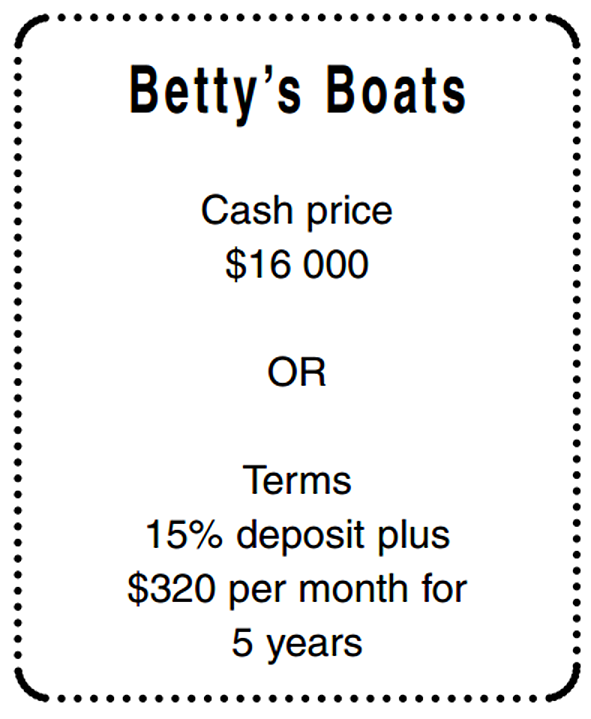
Ali is buying a speedboat at Betty’s Boats.
 

VCAA 2008 15 mc
 

What is the amount of interest Ali will have to pay if he chooses to buy the boat on terms?

  1. $3200 
  2. $5600
  3. $19 200
  4. $21 600
Show Answers Only

`B`

Show Worked Solution

`text(Deposit)= text(15%) xx 16\ 000= $2400`

`text(Payments)= 320 xx 5 xx 12= $19\ 200`

`text(Total paid)= 2400 + 19\ 200= $21\ 600`

`:.\ text(Interest)= 21\ 600-16\ 000=$5600`
  

`=>  B`

Filed Under: FM4 - Credit and Borrowing, Loans, Loans, Loans, Loans and Credit Cards Tagged With: Band 4, smc-1140-40-Total Loan/Interest Payments, smc-6846-30-Total Loan/Interest Payments, smc-6926-40-Total Loan/Interest Payments, smc-814-40-Total Loan/Interest Payments

Statistics, STD2 S1 2008 HSC 13 MC

The height of each student in a class was measured and it was found that the mean height was 160 cm.

Two students were absent. When their heights were included in the data for the class, the mean height did not change.

Which of the following heights are possible for the two absent students?

  1. 155 cm and 162 cm
  2. 152 cm and 167 cm
  3. 149 cm and 171 cm
  4. 143 cm and 178 cm
Show Answers Only

`C`

Show Worked Solution

`text(S) text(ince the mean doesn’t change)`

`=>\ text(2 absent students must have a)`

 `text(mean height of 160 cm.)`

`text(Considering each option given,)`

`(149 + 171) -: 2 = 160`

`=>  C`

Filed Under: Data Analysis, Measures of Centre and Spread, Measures of Centre and Spread, Summary Statistics, Summary Statistics - No Graph, Summary Statistics - No graph, Summary Statistics (no graph) Tagged With: Band 4, common-content, num-title-ct-core, num-title-qs-hsc, smc-1131-10-Mean, smc-4224-25-Mean, smc-4224-50-Add/remove data, smc-6312-10-Mean, smc-6532-10-Mean, smc-824-10-Mean, smc-999-10-Mean

Statistics, STD2 S4 2008 HSC 12 MC

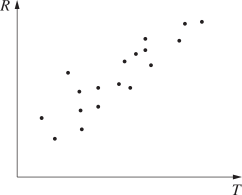
A scatterplot is shown.
 

Which of the following best describes the correlation between  \(R\)  and  \(T\)?

  1. Positive
  2. Negative 
  3. Positively skewed
  4. Negatively skewed
Show Answers Only

\(A\)

Show Worked Solution

\(\text{Correlation is positive.}\)

\(\text{NB. The skew does not directly relate to correlation.}\)

\(\Rightarrow  A\)

Filed Under: Bivariate Data, Bivariate Data Analysis, Bivariate Data Analysis (Y12), Correlation / Body Measurements, S3 Further Statistical Analysis (Y12), S4 Bivariate Data Analysis (Y12) Tagged With: Band 4, common-content, num-title-ct-coreb, num-title-qs-hsc, smc-1001-30-Correlation, smc-1113-30-Correlation, smc-5022-30-Correlation, smc-6934-30-Correlation, smc-785-30-Correlation

Measurement, STD2 M1 2008 HSC 11 MC

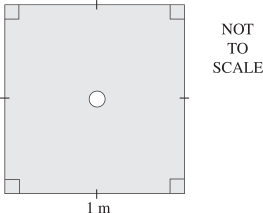
The diagram shows the floor of a shower. The drain in the floor is a circle with a diameter of 10 cm.

What is the area of the shower floor, excluding the drain?


  1. 9686 cm²
  2. 9921 cm²
  3. 9969 cm²
  4. 10 000 cm²
Show Answers Only

`B`

Show Worked Solution
COMMENT: Students should see that answers are all in cm², and therefore use cm as the base unit for their calculations. 
`text(Area)` `=text(Square)-text(Circle)`
  `= (100 xx 100)-(pi xx 5^2)= 10\ 000-78.5398…`
  `= 9921.46…\ text(cm)^2`

 
`=>  B`

Filed Under: Areas and Volumes (Harder), Circular measure, Perimeter and Area, Perimeter and Area, Perimeter and Area, Perimeter, Area and Volume Tagged With: Band 4, num-title-ct-core, num-title-qs-hsc, smc-1121-20-Perimeter and Area (Circular Measure), smc-4944-50-Composite shapes, smc-6483-50-Area (Circular Measure), smc-6520-50-Area (Circular Measure), smc-798-20-Perimeter and Area (Circular Measure)

Statistics, STD2 S1 2008 HSC 10 MC

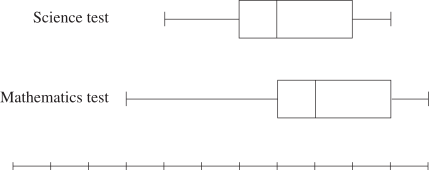
The marks for a Science test and a Mathematics test are presented in box-and-whisker plots.
 

 Which measure must be the same for both tests?

  1. Mean
  2. Range
  3. Median
  4. Interquartile range
Show Answers Only

`D`

Show Worked Solution

`text(IQR)=text(Upper Quartile)-text(Lower Quartile)`

`text{In both box plots, IQR = 3 intervals (against bottom scale)}`

`=>  D`

Filed Under: Box Plots and 5-Number Summary, Stem & Leaf, Box & Whisker, Summary Statistics, Summary Statistics - Box Plots, Summary Statistics - Box Plots, Summary Statistics - Box Plots, Summary Statistics - Box Plots Tagged With: Band 4, common-content, num-title-ct-corea, num-title-qs-hsc, smc-1000-20-Parallel Box-Plots, smc-1131-35-Box Plots, smc-5021-60-Box plots (parallel), smc-6313-20-Parallel Box Plots, smc-6533-20-Parallel Box Plots, smc-825-20-Parallel Box-Plots

Algebra, STD2 A1 2008 HSC 9 MC

What is the value of  `sqrt((x+2y)/(8y))`   if  `x = 5.6`  and  `y = 3.1`, correct to 2 decimal places? 

  1. `0.69`
  2. `2.62`
  3. `2.83` 
  4. `4.77`  
Show Answers Only

`A`

Show Worked Solution
`sqrt((x+2y)/(8y))` `=sqrt((5.6+(2 xx 3.1))/((8 xx 3.1)))`
  `=sqrt(11.8/24.8)=0.6897…`

`=>  A`

Filed Under: AM1 - Algebra (Prelim), Substitution and Other Equations, Substitution and Other Equations, Substitution and Other Equations Tagged With: Band 4, smc-1116-10-Substitution, smc-6234-10-Substitution, smc-6508-10-Substitution, smc-789-10-Substitution

Statistics, STD2 S1 2008 HSC 8 MC

What is the median of the following set of scores?


  1. 12
  2. 13
  3. 14
  4. 15
Show Answers Only

`C`

Show Worked Solution

`text(Median)=(n+1)/2=(33+1)/2=\ text (17th score)`

`:.\ text(Median is 14)`

`=>  C`

Filed Under: Data Analysis, Measures of Centre and Spread, Measures of Centre and Spread, Summary Statistics, Summary Statistics - No Graph, Summary Statistics - No graph, Summary Statistics (no graph) Tagged With: Band 4, common-content, num-title-ct-core, num-title-qs-hsc, smc-1131-20-Median and Mode, smc-1131-60-Frequency Tables, smc-4224-20-Median, smc-6312-20-Median and Mode, smc-6312-60-Frequency Tables, smc-6532-20-Median and Mode, smc-6532-60-Frequency Tables, smc-824-20-Median and Mode, smc-824-60-Frequency Tables, smc-999-20-Median and Mode

Measurement, STD2 M6 2008 HSC 5 MC

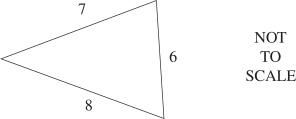
What is the size of the smallest angle in this triangle?
 

  1. `29^@` 
  2. `47^@`
  3. `58^@`
  4. `76^@`
Show Answers Only

`B`

Show Worked Solution

`text(Smallest angle is opposite smallest side.)`

`cos A` `= (b^2 + c^2-a^2)/(2bc)`
  `= (7^2 + 8^2-6^2)/(2 xx 7 xx 8)`
  `= 0.6875`
`A` `=cos ^(-1)(0.6875)`
`:.\ A` `= 46.567…^@`

 
`=>  B`

Filed Under: Non Right-Angled Trig, Non-Right Angled Trig, Non-Right Angled Trig, Non-right-angled Trig Tagged With: Band 4, num-title-ct-pathc, num-title-qs-hsc, smc-4553-10-Cosine Rule, smc-6929-10-Cosine Rule, smc-804-10-Cosine Rule

Algebra, STD2 A4 2008 HSC 4 MC

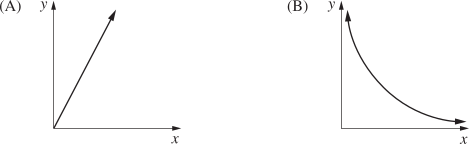
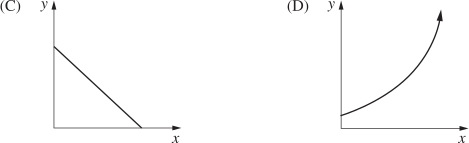
Which graph best represents  `y = 3^x`?
 

Show Answers Only

`D`

Show Worked Solution

`y = 3^x\ \ text(passes through)\ \ (0,1)\ \text(and is exponential.)`

`=>  D`

Filed Under: Exponential/Quadratic (Projectile), Exponentials, Non-Linear: Exponential/Quadratics Tagged With: Band 4, num-title-ct-corea, num-title-qs-hsc, smc-4444-10-Identify graphs, smc-830-10-Identify Graphs

Statistics, STD2 S1 2008 HSC 3 MC

The stem-and-leaf plot represents the daily sales of soft drink from a vending machine.

If the range of sales is 43, what is the value of  2008 3 mc  ?


  1. 4
  2. 5
  3. 24
  4. 25
Show Answers Only

`A`

Show Worked Solution

`text(Range = High) – text(Low) = 43`

`:.\ 67 – text(Low)` `= 43`
`text(Low)` `= 24`

    
`:.\ N = 4`

`=>  A`

Filed Under: Bar Charts, Histograms and Other Graphs, Data Analysis, Displaying Data - Other Charts, Displaying Data - Other Charts, Other Chart Types, Other Charts, Stem & Leaf, Box & Whisker Tagged With: Band 4, common-content, num-title-ct-core, num-title-qs-hsc, smc-1128-24-Stem and Leaf, smc-4224-10-Range, smc-4224-40-Stem and Leaf, smc-6311-10-Stem-and-Leaf, smc-6531-10-Stem-and-Leaf, smc-822-20-Stem and Leaf, smc-998-20-Stem and Leaf

v1 Measurement, STD2 M1 2008 HSC 2 MC

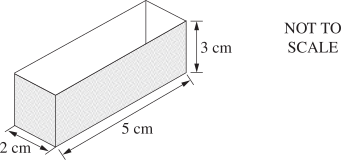
What is the volume of the box?


  1. 10 cm³
  2. 30 cm³
  3. 52 cm³
  4. 62 cm³
Show Answers Only

`C`

Show Worked Solution

`text(Volume)`

`= l xx w xx h`

`= 5 xx 2 xx 3`

`= 30\ text(cm³)`

`=>  C`

Filed Under: Perimeter, Area and Volume (Std2-X) Tagged With: Band 4, num-title-ct-corea, num-title-qs-hsc, smc-4234-40-SA (prisms), smc-798-25-Surface Area

Probability, 2ADV S1 2008 HSC 9a

It is estimated that 85% of students in Australia own a mobile phone.

  1. Two students are selected at random. What is the probability that neither of them owns a mobile phone?  (2 marks)

    --- 4 WORK AREA LINES (style=lined) ---

  2. Based on a recent survey, 20% of the students who own a mobile phone have used their mobile phone during class time. A student is selected at random. What is the probability that the student owns a mobile phone and has used it during class time?   (1 mark)

    --- 2 WORK AREA LINES (style=lined) ---

Show Answers Only
  1. `9/400`
  2. `17/100`
Show Worked Solution

i.     `P(M) = 0.85`

COMMENT: `M^c` is syllabus notation for the complement of event `M`.

`P(M^c) = 1-0.85 = 0.15`

`:.\ P(M^c, M^c)` `= 15/100 * 15/100`
  `= 225/(10\ 000)`
  `= 9/400`


ii.  `text{P(owns mobile and used it)}`

`= P(M) xx  P\text{(used it)}`

`= 17/20 xx 20/100`

`= 17/100`

Filed Under: 3. Probability, Multi-Stage Events, Multi-Stage Events Tagged With: Band 4, Band 5, smc-6469-20-Other Multi-Stage Events, smc-6469-30-Complementary Probability, smc-989-20-Other Multi-Stage Events, smc-989-30-Complementary Probability

Plane Geometry, 2UA 2008 HSC 8b

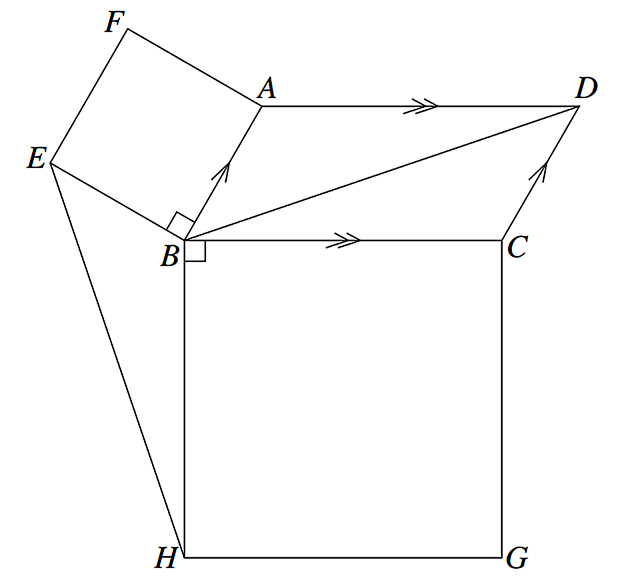
In the diagram,  `ABCD`  is a parallelogram and  `ABEF`  and  `BCGH`  are both squares.

Copy or trace the diagram into your writing booklet.

  1. Prove that  `CD = BE`.  (1 mark)
  2. Prove that  `BD = EH`.   (3 marks)
Show Answers Only
  1. `text(Proof)\ \ text{(See Worked Solutions)}`
  2. `text(Proof)\ \ text{(See Worked Solutions)}`
Show Worked Solution

(i)  `text(Prove)\ CD = BE`

`CD` `= AB\ \ text{(opposite sides of parallelogram)}`
`AB` `= BE\ \ text{(sides of square)}`
`:.\ CD` `= BE\ \ \ text(… as required)`


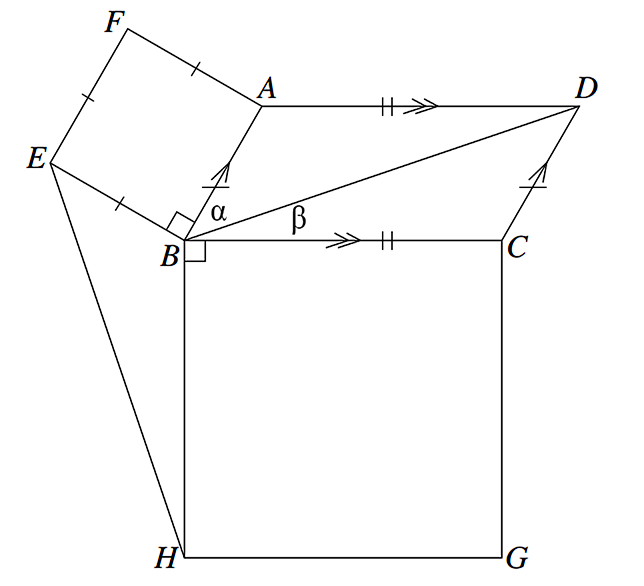
(ii)

`text(Prove)\ BD = EH`

`CD` `= BE\ \ text{(from part (i))}`
`BC` `= BH\ \ text{(sides of square)}`

`/_BDC = /_ABD = alpha\ \ text{(} text(alternate,)\ AB\ text(||)\ CD text{)}`

`text(Let)\ /_DBC = beta`

`/_BCD` `= 180 – alpha – beta\ \ \ \ text{(angle sum of}\ Delta BDCtext{)}`
`/_EBH` `= 360 – 90 – 90 – alpha – beta\ \ \ `
   `text{(angles about a point)}`
  `= 180 – alpha – beta`
  `= /_BCD`

`=> Delta DCB ~= Delta EBH\ \ text{(SAS)}`

`:.\ BD = EH\ \ \ ` `text{(corresponding sides of)`
  `\ \ text{congruent triangles)}`

Filed Under: 2. Plane Geometry Tagged With: Band 4, Band 5

Calculus, 2ADV C3 2008 HSC 8a

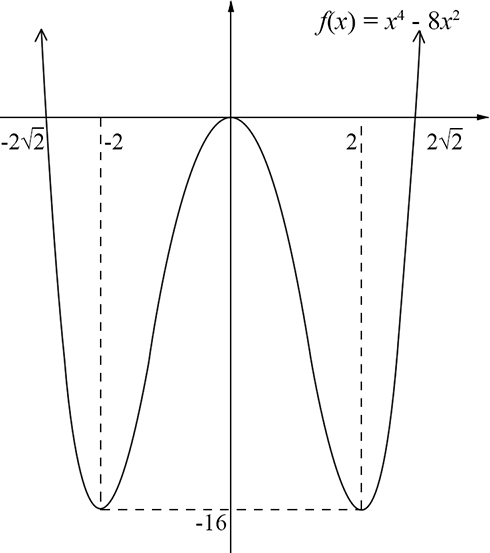
Let  `f(x) = x^4 − 8x^2`.

  1. Find the coordinates of the points where the graph of  `y = f(x)`  crosses the axes.  (2 marks)

    --- 5 WORK AREA LINES (style=lined) ---

  2. Show that  `f(x)`  is an even function.   (1 mark)

    --- 2 WORK AREA LINES (style=lined) ---

  3. Find the coordinates of the stationary points of  `f(x)`  and determine their nature.   (4 marks)

    --- 8 WORK AREA LINES (style=lined) ---

  4. Sketch the graph of  `y = f(x)`.   (1 mark)

    --- 8 WORK AREA LINES (style=lined) ---

Show Answers Only

a.    `(-2 sqrt 2,0), (2 sqrt 2, 0)`

b.    `text(Proof)\ \ text{(See Worked Solutions)}`

c.    `text(S.P.s at)\ (0,0), (2,-16), (-2,-16)`

d.    

  1. 2UA HSC 2008 8ai
Show Worked Solution
a.     `f(x) = x^4 – 8x^2`

`y text(-intercept when)\ x = 0`

`:.\ text(Cuts)\ y\ text(axis at)\ (0,0)`

`x\ text(-intercept when)\ f(x) = 0`

`x^4 – 8x^2` `= 0`
`x^2 (x^2 – 8)` `= 0`

`x^2 – 8 = 0\ \ \ \ \ text(or)\ \ \ \ \ x = 0`

`x^2` `= 8`
`x` `= +- sqrt 8 = +- 2 sqrt 2`


`:.\ text(Cuts)\ x text(-axis at)\ (-2 sqrt 2,0),\ \ text(and)\ \ (2 sqrt 2, 0)`

`text{(Note that it only touches}\ xtext{-axis at (0,0))}`


b.     `f(x)` `= x^4 – 8x^2`
  `f(–x)` `= (–x)^4 – 8(–x)^2`
    `= x^4 – 8x^2`
    `= f(x)`


`:.\ f(x)\ text(is an even function.)`


c.     `f(x)` `= x^4 – 8x^2`
  `f'(x)` `= 4x^3 – 16x`
  `f″(x)` `=12x^2-16`


`text(S.P.  when)\ \ f'(x) = 0`

`4x^3 – 16x` `= 0`
`4x (x^2 – 4)` `= 0`
`x^2 – 4` `=0\ \ \ \ \ x = 0`
`x^2` `= 4`
`x` `= +-2`
`text(At)\ x=2\ \ `  `f(x)`  `=(2)^4 – 8(2)^2 = -16`
  `f″(x)` `=12(2^2)-16>0`

`:.\ text{MIN at (2, –16)}`

`:.\ text{MIN at (–2, –16)},\ \ \ (f(x)\ text(is even))`


`text(At)\ x=0\ \ `  `f(x)`  `=(0)^4 – 8(0)^2 = 0`
  `f″(x)` `=12(0^2)-16<0`

`:.\ text{MAX at (0,0)}`


d.    

Filed Under: Curve Sketching, Curve Sketching, Curve Sketching and The Primitive Function Tagged With: Band 4, Band 5, smc-7225-20-Degree 4, smc-969-20-Degree 4

Probability, 2ADV S1 2008 HSC 7c

Xena and Gabrielle compete in a series of games. The series finishes when one player has won two games. In any game, the probability that Xena wins is `2/3` and the probability that Gabrielle wins is `1/3`.

Part of the tree diagram for this series of games is shown.


  1. Complete the tree diagram showing the possible outcomes.   (1 mark)
  2. What is the probability that Gabrielle wins the series?   (2 marks)

    --- 4 WORK AREA LINES (style=lined) ---

  3. What is the probability that three games are played in the series?   (2 marks)

    --- 4 WORK AREA LINES (style=lined) ---

Show Answers Only
  1.    
  2. `7/27`
  3. `4/9`
Show Worked Solution
i. 2UA HSC 2008 7ci
MARKER’S COMMENT: A tree diagram with 8 outcomes is incorrect (i.e. no third game is played if 1 player wins the first 2 games).

 
ii.
  `P text{(} G\ text(wins) text{)}`

`= P(XGG) + P (GXG) + P (GG)`

`= 2/3 xx 1/3 xx 1/3 + 1/3 xx 2/3 xx 1/3 + 1/3 xx 1/3`

`= 2/27 + 2/27 + 1/9`

`= 7/27`
 

iii.  `text(Strategy 1:)`

`P text{(3 games played)}`

`= P (XG) + P(GX)`

`= 2/3 xx 1/3 + 1/3 xx 2/3`

`= 4/9`
 

`text(Strategy 2:)`

`P text{(3 games)}`

`= 1-[P(XX) + P(GG)]`

`= 1-[2/3 xx 2/3 + 1/3 xx 1/3]`

`= 1-5/9`

`= 4/9`

Filed Under: 3. Probability, Multi-Stage Events, Multi-Stage Events Tagged With: Band 4, Band 5, page-break-before-solution, smc-6469-10-Probability Trees, smc-6469-30-Complementary Probability, smc-989-10-Probability Trees, smc-989-30-Complementary Probability

Trigonometry, 2ADV T1 2008 HSC 7b

2008 7b

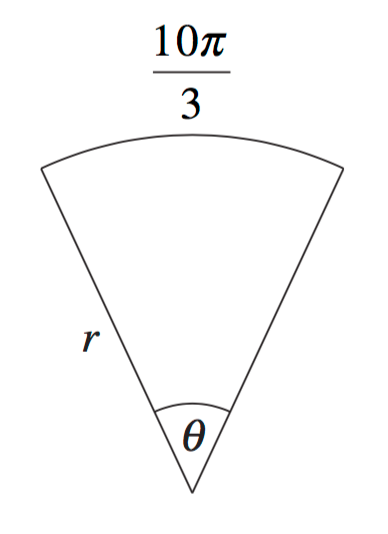
The diagram shows a sector with radius `r` and angle `theta` where `0 < theta <= 2pi`.

The arc length is `(10pi)/3`. 

  1.  Show that  `r >= 5/3`.   (2 marks)

    --- 6 WORK AREA LINES (style=lined) ---

  2.  Calculate the area of the sector when  `r = 4`.   (2 marks)

    --- 4 WORK AREA LINES (style=lined) ---

Show Answers Only
  1. `text(Proof)\ \ text{(See Worked Solutions)}`
  2. `(20pi)/3\ text(u²)`
Show Worked Solution
i.    `text(Show)\ r >= 5/3`
`text(Arc length)\ ` `= r theta\ \ text(where)\ \ 0 < theta <= 2pi`
`r theta` `= (10pi)/3`
`:.theta` `= (10pi)/(3r)`


`text(Using)\ 0 <= theta <= 2 pi:`

`0 <= (10pi)/(3r)` `<= 2pi`
`(10pi)/3` `<= 2 pi r`
`5/3` `<= r`


`:.\ r >= 5/3\ \ \ text(… as required.)`


ii.   `text(Area)` `= 1/2 r^2 theta`
    `= 1/2 xx 4^2 xx (10pi)/(3 xx 4)`
    `= (20pi)/3\ text(u²)`

Filed Under: Circular Measure, Circular Measure, Circular Measure Tagged With: Band 4, Band 5, smc-6394-10-Arc Length/Perimeter, smc-6394-20-Area of Sector, smc-978-10-Arc Length/Perimeter, smc-978-20-Area of Sector

Calculus, EXT1* C3 2008 HSC 6c

The graph of  `y = 5/(x - 2)`  is shown below.
 

2008 6c
 

The shaded region in the diagram is bounded by the curve  `y = 5/(x - 2)`, the  `x`-axis and the lines  `x = 3`  and  `x = 6`.

Find the volume of the solid of revolution formed when the shaded region is rotated about the  `x`-axis.  (3 marks)

--- 6 WORK AREA LINES (style=lined) ---

Show Answers Only

`(75pi)/4\ text(u³)`

Show Worked Solution
`y` `= 5/(x – 2)`
`V` `= pi int_3^6 y^2\ dx`
  `= pi int_3^6 (5/(x – 2))^2\ dx`
  `= 25 pi int_3^6 1/((x – 2)^2)\ dx`
  `= 25 pi [(-1)/(x – 2)]_3^6`
  `= 25 pi [-1/4 – (-1)]`
  `=25 pi [3/4]`
  `= (75pi)/4\ text(u³)`

Filed Under: Further Area and Solids of Revolution, Further Areas and Solids of Revolution, Volumes of Solids of Rotation Tagged With: Band 4, smc-1039-40-Other Graphs, smc-1039-60-x-axis Rotation, smc-7294-20-\(\large x\)-axis Rotation, smc-7294-70-Other Graphs

Calculus, 2ADV C4 2008 HSC 5a

The gradient of a curve is given by  `dy/dx = 1-6 sin 3x`. The curve passes through the point  `(0, 7)`.

What is the equation of the curve?   (3 marks)

--- 6 WORK AREA LINES (style=lined) ---

Show Answers Only

`y = x + 2 cos 3x + 5`

Show Worked Solution
`dy/dx` `= 1-6 sin 3x`
`y` `= int 1-6 sin 3x\ dx`
  `= x + 2 cos 3x + c`

  
`text(Passes through)\ (0,7):`

`=> 0 + 2 cos 0 + c` `= 7`
`2 + c` `= 7`
`c` `= 5`

  
`:.\ text(Equation is)\ \ \ y = x + 2 cos 3x + 5`

Filed Under: Differentiation and Integration, Integrals, Other Integration Applications, Rates of Change, Trig Integration, Trig Integration Tagged With: Band 4, smc-1204-10-Sin, smc-1213-25-Tangents/Primitive function, smc-7135-35-Tangents/Primitive function, smc-7188-10-Sin

Quadratic, 2UA 2008 HSC 4c

Consider the parabola  `x^2 = 8(y\ – 3)`.

  1. Write down the coordinates of the vertex.  (1 mark)
  2. Find the coordinates of the focus.   (1 mark)
  3. Sketch the parabola.   (1 mark)
  4. Calculate the area bounded by the parabola and the line  `y = 5`.   (3 marks)
Show Answers Only

(i)   `(0,3)`

(ii)   `(0,5)`

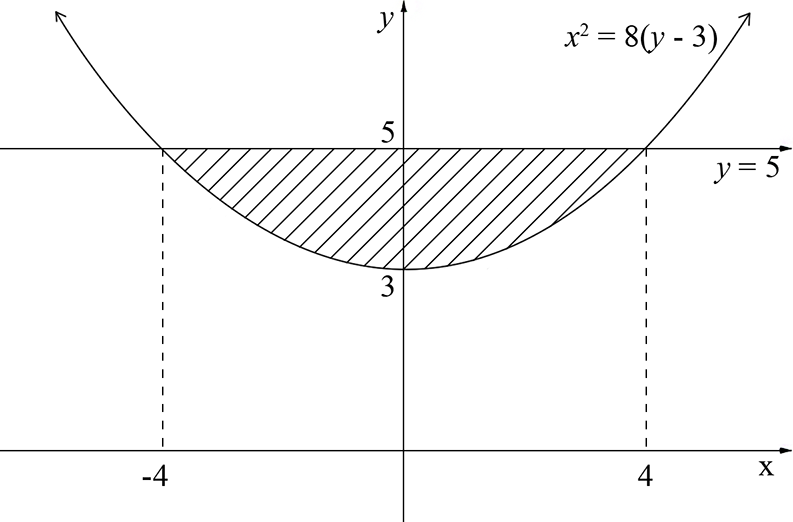
(iii)  

(iv)  `10 2/3\ text(u²)`

Show Worked Solution
(i)    `text(Vertex)\ = (0,3)`


(ii)   `text(Using)\ \ \ x^2` `= 4ay`
  `4a` `= 8`
  `a` `= 2`

`:.\ text(Focus) = (0,5)`


(iii) 2UA HSC 2008 4c 


(iv)   `text(Intersection when)\ y = 5`
`=> x^2` `= 8 (5-3)`
`x^2` `= 16`
`x` `= +- 4`

`text(Find shaded area)`

`x^2` `= 8 (y-3)`
`y – 3` `= x^2/8`
`y` `= x^2/8 +3`


`text(Area)` `= int_-4^4 5\ dx – int_-4^4 x^2/8 + 3\ dx`
  `= int_-4^4 5 – (x^2/8 + 3)\ dx`
  `= int_-4^4 2 – x^2/8\ dx`
  `= [2x – x^3/24]_-4^4`
  `= [(8 – 64/24) – (-8 + 64/24)]`
  `= 5 1/3 – (- 5 1/3)`
  `= 10 2/3\ text(u²)`

Filed Under: Areas Under Curves, The Parabola Tagged With: Band 3, Band 4, Band 5

Calculus, 2ADV C4 2008 HSC 2ci

Find  `int (dx)/(x+5)`.   (1 mark)

--- 1 WORK AREA LINES (style=lined) ---

Show Answers Only

`ln (x + 5) + C`

Show Worked Solution

`int (dx)/(x + 5)`

`= ln (x + 5) + C`

Filed Under: Integrals, L&E Integration, L&E Integration, Log Calculus, Log Calculus (Y12) Tagged With: Band 4, smc-1203-30-Log (Indefinite), smc-7187-30-Log (Indefinite), smc-964-20-Indefinite Integrals

Calculus, 2ADV C4 2008 HSC 2cii

Evaluate  `int_0^(pi/12) sec^2 3x\ dx`.   (3 marks)

--- 4 WORK AREA LINES (style=lined) ---

Show Answers Only

`1/3`

Show Worked Solution

`int_0^(pi/12) sec^2 3x\ dx`

`= [1/3 tan 3x]_0^(pi/12)`

`= [(1/3 tan (pi/4))-(1/3 tan 0)]`

`= 1/3(1)-0=1/3`

Filed Under: Differentiation and Integration, Integrals, Trig Integration, Trig Integration Tagged With: Band 4, smc-1204-30-\(\large \text{sec}^2\), smc-7188-30-\(\large \text{sec}^2\)

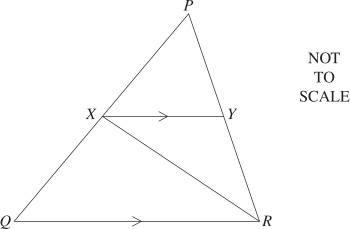
Plane Geometry, 2UA 2008 HSC 4a

In the diagram, `XR` bisects `/_PRQ` and `XY\ text(||)\ QR`.

Prove that `Delta XYR` is an isosceles triangle.   (2 marks)

--- 4 WORK AREA LINES (style=lined) ---

Show Answers Only

`text(Proof)\ text{(See Worked Solutions)}`

Show Worked Solution

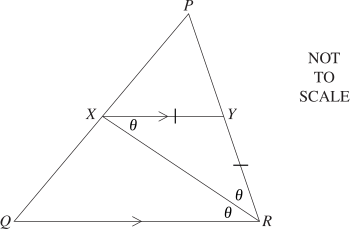
`text{Since}\ XR\ text{bisects}\ /_PRQ`

`/_XRQ` `= /_YRX = theta`
`/_RXY` `= theta\ \ \ text{(} text(alternate angles,)\ XY\ text(||)\ QR text{)}`

 
`:.\ Delta XYR\ \ text(is isosceles)`

Filed Under: 2. Plane Geometry, Special Properties Tagged With: Band 4, num-title-ct-pathc, num-title-qs-hsc, smc-4748-10-Triangle properties

Calculus, 2ADV C4 2008 HSC 3b

  1. Differentiate  `log_e (cos x)`  with respect to  `x`.   (2 marks)

    --- 4 WORK AREA LINES (style=lined) ---

  2. Hence, or otherwise, evaluate  `int_0^(pi/4) tan x\ dx`.   (2 marks)

    --- 4 WORK AREA LINES (style=lined) ---

Show Answers Only

a.    `-tan x`

b.    `-log_e (1/sqrt2)\ \ text(or)\ \ 0.35\ \ text{(2 d.p.)}`

Show Worked Solution
a.     `y` `= log_e (cos x)`
  `dy/dx` `= (-sin x)/(cos x)`
    `=-tan x`


b.     `int_0^(pi/4) tan x\ dx`
  `=-[log_e (cos x)]_0^(pi/4)`
  `=-[log_e(cos (pi/4))-log_e (cos 0)]`
  `=-[log_e (1/sqrt2)-log_e 1]`
  `=-[log_e (1/sqrt2)-0]`
  `=-log_e (1/sqrt2)`
  `= 0.346…\ = 0.35\ \ text{(2 d.p.)}`

Filed Under: Differentiation and Integration, Log Calculus, Log Calculus (Y12), Trig Integration, Trig Integration Tagged With: Band 3, Band 4, smc-1204-50-Diff then Integrate, smc-7188-50-Diff then Integrate, smc-964-10-Differentiation, smc-964-40-Trig overlap, smc-964-50-Diff then integrate

  • « Previous Page
  • 1
  • …
  • 113
  • 114
  • 115
  • 116
  • 117
  • …
  • 121
  • Next Page »

Copyright © 2014–2026 SmarterEd.com.au · Log in