Chilla just turned 16 years old.
Snix is 7 years younger than twice Chilla's age.
How old is Snix?
| `9` | `18` | `21` | `25` |
|
|
|
|
|
Aussie Maths & Science Teachers: Save your time with SmarterEd
Chilla just turned 16 years old.
Snix is 7 years younger than twice Chilla's age.
How old is Snix?
| `9` | `18` | `21` | `25` |
|
|
|
|
|
A tram at the zoo does a complete 5 kilometre loop in 30 minutes.
If the tram travelled at the same speed, how long did it take to complete 2 kilometres?
| `text(8 minutes)` | `text(12 minutes)` | `text(18 minutes)` | `text(24 minutes)` |
|
|
|
|
|
What is the missing number?
`3 xx` `= 9 xx 4`
Max wanted to buy a squash racquet that cost $75.
He has saved $60.
How much extra does he need to save as a percentage of the cost price?
| `text(7.5%)` | `text(20%)` | `text(25%)` | `text(75%)` |
|
|
|
|
|
It takes a ray of sunlight 479.746 seconds to reach the earth from the sun.
How long is this, rounded to two decimal places?
| seconds |
Usain is timed at 9.8472 seconds for the 100 metre sprint.
What is Usain's time, rounded to two decimal places?
| seconds |
36 surfers were asked "Have you snapped a surfboard in the last 12 months?"
`3/4` of the surfers answered "Yes".
How many surfers answered "Yes"?
Sid is selling bike tyre tubes at a market stall.
He makes $54 from selling 6 bike tyre tubes.
All bike tyre tubes cost the same.
How much will Sid make if he sells 11 bike tyre tubes.
| `$65` | `$83` | `$99` | `$108` |
|
|
|
|
|
Yanni buys 7 peaches for $1.30 each.
He pays for the peaches with a $10 note.
How much change should Yanni receive?
| `$0.90` | `$1.10` | `$1.90` | `$8.10` |
|
|
|
|
|
Which one of these numbers is a factor of 65?
| `3` | `6` | `13` | `130` |
|
|
|
|
|
Libby started a meeting at 11:25 am.
The meeting finished at 1:22 pm.
How long did Libby's meeting go for?
| `text(57 minutes)` | `text(63 minutes)` | `text(97 minutes)` | `text(117 minutes)` |
|
|
|
|
|
Dostoy has 73 match sticks.
He uses 6 match sticks to make two small triangles.

What is the largest number of small triangles that Dostoy can make with his 73 match sticks?
| `19` | `21` | `24` | `27` |
|
|
|
|
|
Dorian and Ava save money each week.
Dorian saves $9 per week and Ava saves $6 per week.
After 9 weeks, how much more money has Dorian saved than Ava?
| $ |
Which of these has the same value as 10.4?
|
|
`100 + 4` |
|
|
`10 + 4/100` |
|
|
`1+ 4/100` |
|
|
`10 + 4/10` |
Pinto needs 3 bars of chocolate to make a birthday cake.
He adds `1/4` bar of chocolate at a time in the recipe.
How many `1/4` bars of chocolate will he need to add?
| `3` | `4` | `8` | `12` |
|
|
|
|
|
Kate uses 1 cup of flour to make one muffin.
She measures `1/3` cup each time.
How many `1/3` cups will she need to make 6 muffins?
| `2` | `3` | `12` | `18` |
|
|
|
|
|
7.42 is equal to
|
|
`0.7 + 0.4 + 0.2` |
|
|
`7.0 + 0.4 + 0.2` |
|
|
`7 + 0.04 + 0.02` |
|
|
`7 + 0.4 + 0.02` |
Australia changed its currency from pounds to dollars in 1966.
Approximately how many years ago did this change occur?
| `60` | `65` | `75` | `85` |
|
|
|
|
|
How many numbers between 8 and 51 are divisible by 6?
| `5` | `6` | `7` | `8` |
|
|
|
|
|
In one year, a motor company makes:
Write these as numbers in the boxes below:
|
|
cars |
|
|
trucks |
A second market research project also suggested that if the Westmall shopping centre were sold, each of the three centres (Westmall, Grandmall and Eastmall) would continue to have regular shoppers but would attract and lose shoppers on a weekly basis.
Let `R_n` be the state matrix that shows the expected number of shoppers at each of the three centres `n` weeks after Westmall is sold.
A matrix recurrence relation that generates values of `R_n` is
`R_(n+1) = TR_n + B`
`{:(quad qquad qquad qquad qquad qquad qquad qquad text(this week)),(qquad qquad qquad qquad qquad qquad quad \ W qquad quad G qquad quad \ E),(text(where)\ T = [(quad 0.78, 0.13, 0.10),(quad 0.12, 0.82, 0.10),(quad 0.10, 0.05, 0.80)]{:(W),(G),(E):}\ text(next week,) qquad qquad B = [(-400), (700), (500)]{:(W),(G),(E):}):}`
The matrix `R_2` is the state matrix that shows the expected number of shoppers at each of the three centres in the second week after Westmall is sold
`R_2 = [(239\ 060), (250\ 840), (192\ 900)]{:(W),(G),(E):}`
--- 3 WORK AREA LINES (style=lined) ---
--- 3 WORK AREA LINES (style=lined) ---
Noel has a bowl full of red chewing gum balls and blue chewing gum balls.
The chance of randomly picking a red chewing gum ball is 85%.
What is the probability of randomly picking a blue chewing gum ball?
| % |
Tristan's laundry has a lost clothing basket that contains only black and white socks.
The probability of randomly picking a black sock from the basket is 35%.
What is the probability of randomly picking a white sock?
| % |
A manufacturer makes horse floats.
The table below shows how many floats it makes each month.
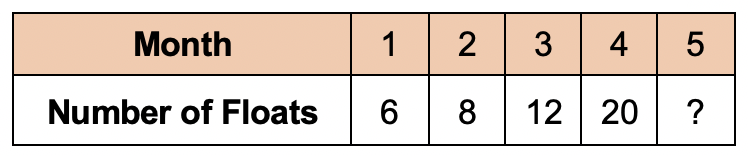
The number of floats made grows each month and follows the rule:
Double the number made last month and deduct 4
How many horse floats are made in the 5th month?
|
|
22 |
|
|
28 |
|
|
32 |
|
|
36 |
Norman started cycling to stay fit.
The table below shows the distance he cycles on his rides.
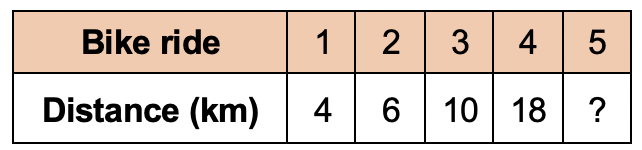
The distance he cycles increases each ride and follows the rule:
Double the last distance and deduct 2.
What is the distance travelled by Norman on his 5th ride?
|
|
26 km |
|
|
30 km |
|
|
34 km |
|
|
36 km |
Lorenzo had a $10 note.
He decided to buy 13 tokens that are worth 60 cents each to play in the arcade.
How much change will he get?
|
|
$2.20 |
|
|
$3.20 |
|
|
$6.80 |
|
|
$7.80 |
Jillian has $25 for buying some groceries.
At the supermarket, she bought 10 oranges that cost $0.25 each and 8 sweet potatoes that cost $1.50 each.
How much change will she get?
|
|
$7.50 |
|
|
$9.50 |
|
|
$10.50 |
|
|
$12.50 |
A company ships crates overseas and calculates the cost of shipping per crate.
This company uses a formula for calculating the size and cost of shipping.
The formula is shown below:
Size = Length + Width + Height
The maximum size of crates to be shipped overseas is 350 cm.
Which of the following crates is oversized?
| Length | Width | Height | |
|
|
200 | 60 | 80 |
|
|
150 | 130 | 90 |
|
|
160 | 100 | 70 |
|
|
130 | 120 | 100 |
A delivery company uses a formula to determine the cost of shipping different sizes of boxes.
The formula they use is as follows:
Size of box = length + width + height
The maximum size that can be shipped is 240 cm.
Which box is oversized?
| Length | Width | Height | |
|
|
100 | 80 | 60 |
|
|
70 | 60 | 90 |
|
|
90 | 90 | 50 |
|
|
90 | 110 | 50 |
Kelly wants to give away some of the apples that came from her family’s farm.
The two small boxes shown below fit either 5 apples or 6 apples.

Kelly has 9 BOX A's and 10 BOX B's.
She shares the apples equally among 15 of her friends.
How many apples will each of her friends receive?
|
|
5 |
|
|
7 |
|
|
8 |
|
|
104 |
|
|
105 |
John bought two different bags of bread rolls.

He bought 5 Bags A's and 10 Bag B's.
John then divided the bread rolls equally among 20 families.
How many bread rolls did each family receive?
|
|
4 |
|
|
5 |
|
|
6 |
|
|
70 |
|
|
80 |
A student needs 12 folder dividers for each subject.
This student is enrolled in 5 subjects.
A school supply store sells the folder dividers in packets of 8.
How many packets should the student buy?
|
|
4 |
|
|
6 |
|
|
7 |
|
|
8 |
William needs 4 eggs for each cake he will bake.
He wants to make 12 cakes.
A certain store sells eggs in bags of 5.
How many bags must he buy in order to make 12 cakes?
|
|
8 |
|
|
9 |
|
|
10 |
|
|
12 |
A regular decagon is folded in half along the dotted line.

The folded shape can be also called a?
|
|
hexagon |
|
|
dodecagon |
|
|
quadrilateral |
|
|
octagon |
The folded shape has 6 sides → hexagon.

The time spent by Mark playing video games on his computer is recorded in a table.
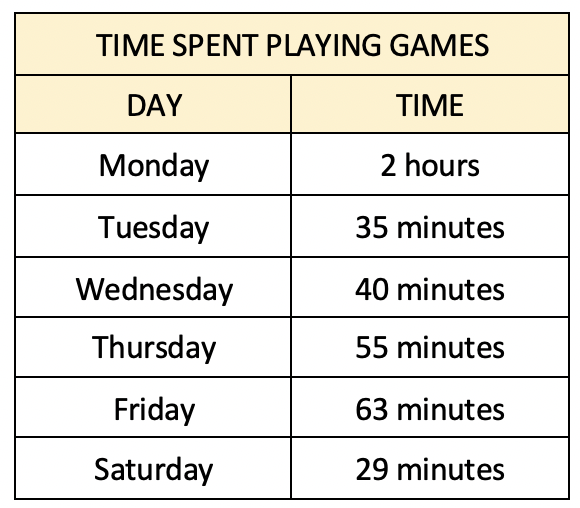
What was the average time per day that Mark spent playing video games over this period?
|
|
41 minutess |
|
|
57 minutes |
|
|
63 minutes |
|
|
342 minutes |
The table shown below records Emily's jogging time over six days.
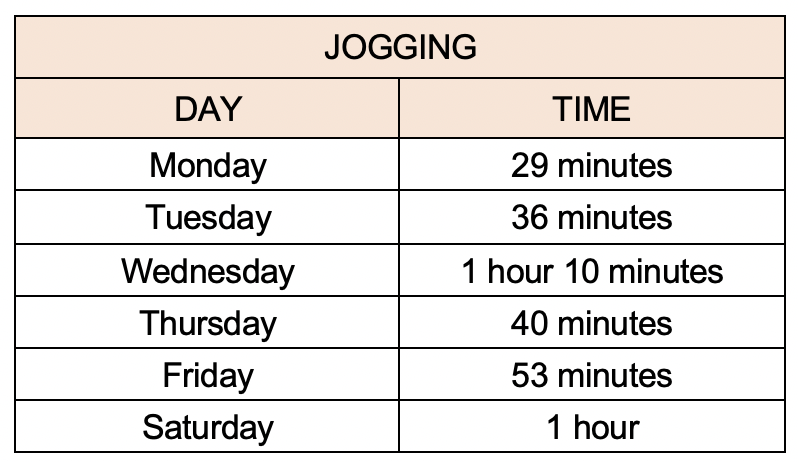
What was the average time Emily jogged each day?
|
|
48 minutes |
|
|
61 minutes |
|
|
288 minutes |
|
|
368 minutes |
Troy built a solid figure using cubes.

He paints all the outer sides red, including the base, and then separates the cubes.
How many faces are painted red?
|
|
24 |
|
|
30 |
|
|
34 |
|
|
36 |
Sarah creates a solid figure using five cubes.

She paints all the outer sides blue, including the base, and then separates the cubes.
How many faces are painted blue?
|
|
18 |
|
|
22 |
|
|
24 |
|
|
26 |
`12.5 xx Z = 2.5`
Find the value of `Z` in order to make this number sentence correct
|
|
1.35 |
|
|
0.40 |
|
|
5.0 |
|
|
0.20 |
`1.36 xx B = 0.68`
Find the value of `B` that makes this number sentence correct.
|
|
0.75 |
|
|
0.60 |
|
|
0.50 |
|
|
0.20 |
The results of a men's 100 metre swimming race is recorded in the table below.
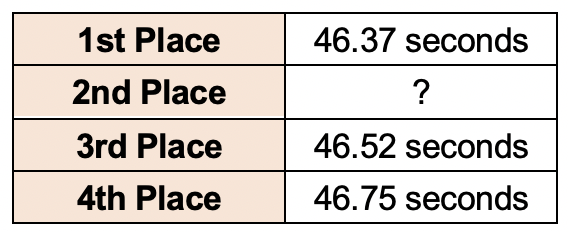
What could be the finishing time of the 2nd placed swimmer?
|
|
46.28 seconds |
|
|
46.61 seconds |
|
|
46.48 seconds |
|
|
46.80 seconds |
The result of a 100-metre dash was recorded in the table shown below.

What could be the time of the runner in 3rd place?
|
|
13.85 seconds |
|
|
14.26 seconds |
|
|
14.58 seconds |
|
|
14.92 seconds |
Lester schedules a company meeting twice every 5 working days.
Today is a working day.
What is the probability that there is a meeting scheduled?
|
|
`2/7` |
|
|
`0.40` |
|
|
`3/5` |
|
|
`text(25%)` |
Laura's country hut is visited by a possum twice every week.
What is the probability that the possum visits her hut today?
|
|
`2/7` |
|
|
`2/5` |
|
|
`0.70` |
|
|
`text(25%)` |
Some tiles are missing in the tile pattern shown below.

When completed, the tile pattern has one line of symmetry
Which of these could be the missing tiles?
|
|
 |
|
|
 |
|
|
 |
|
|
 |
`text{The completed pattern is shown below.}`

Some shapes are missing in this pattern.

When completed, the pattern has one line of symmetry.
Which of these could be the missing part of the pattern?
|
|
 |
|
|
 |
|
|
 |
|
|
 |
`text(The completed pattern is shown below.)`

Henry got lost on his way to visit his uncle’s house and made 3 U-turns before arriving.
In total, how many degrees does Henry turn through when making U-turns on his trip?
|
|
150° |
|
|
270° |
|
|
540° |
|
|
1080° |
During an X-Games snowboarding competition, an athlete performed 4 full backward summersaults before landing.
By how many degrees did the athlete rotate her body during this move?
|
|
360° |
|
|
920° |
|
|
1080° |
|
|
1440° |
A pack of sugar weighs `1/4` of a kilogram.
Josh bought 6 packs for baking.
How many kilograms of sugar did he buy?
|
|
`2/3` |
|
|
`1 1/2` |
|
|
`2 1/4` |
|
|
`3` |
A box of apples weighs `2/3` of a kilogram
Lou bought 3 boxes.
How many kilograms of apples did he bought?
|
|
`1 frac{4}{9} \ text{kg}` |
|
|
`2 \ text{kg}` |
|
|
`frac{8}{9} \ text{kg}` |
|
|
`2 frac{2}{3} \ text{kg}` |
The arrow pictured below is spun once.

Which number is the spinner least likely to land on?
| 1 | 2 | 3 | 1 or 2 |
|
|
|
|
|
A disk is thrown onto the table pictured below.

It has an equal chance of landing in any square.
Which numbered square is the disk least likely to land in?
| 3 | 4 | 5 | same chance for each number |
|
|
|
|
|
The tallest living giraffe is measured at five thousand, seven hundred and eight millimetres tall.
Write this as a number in the box below
millimetres
The exact length of great white shark is measured as five thousand and ninety six millimetres.
Write this as a number in the box below
millimetres
Let `f(x) = x^2e^(−x)`.

Let `g(x) = x^n e^(−x)`, where `n ∈ Z`.


a. `f′(x) = 2xe^(−x) – x^2e^(−x)`
`text(SP’s when)\ \ f′(x) = 0:`
| `x^2e^(−x)` | `= 2xe^(−x)` |
| `x` | `= 2\ \ text(or)\ \ 0` |
`f(0) = 0; \ f(2) = 4e^(−2)`
`:. text(SP’s at)\ \ (0, 0) and (2, 4e^(−2))`
b. `text(As)\ \ x -> ∞, \ f(x) -> 0^+`
`:. text(Horizontal asymptote at)\ \ y = 0`
| c. | |
`text(POI when)\ \ f″(x) = 0`
`:. text(POI’s:)\ (0.59, 0.19), \ (3.41, 0.38)`
d. `g′(x) = x^(n – 1) e^(−x)(n – x)`
`g″(x) = x^(n – 2) e^(−x)(x^2 – 2xn + n^2 – n)`
e.i. `text(Solve:)\ \ x^2 – 2xn + n^2 – n = 0`
`x = n ± sqrtn`
| e.ii. | |
A spinning wheel has sections labelled with different numbers.
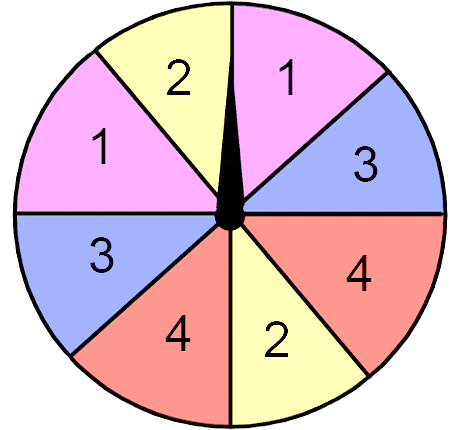
Which of the numbers in the wheel is the spinner most likely to land on?
|
|
1 or 3 |
|
|
1 |
|
|
2 or 4 |
|
|
All of the colours are equally likely |
A spinning wheel has 3 different colours.
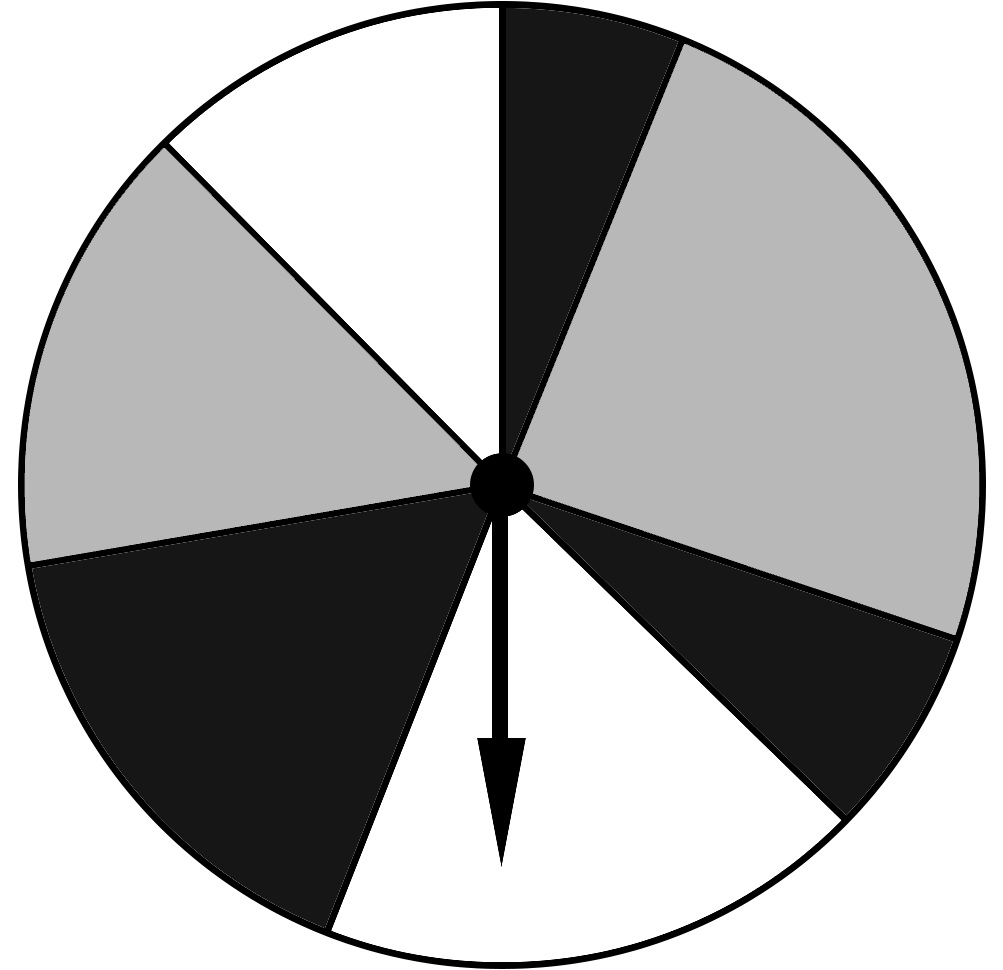
Which colour in the wheel is most likely to land on?
|
|
White |
|
|
Black |
|
|
Grey |
|
|
All of the colours are equally likely |
A circle is divided into 8 equal parts, as shown in the image below.

What percentage of the circle’s area has been labelled with letters?
|
|
30% |
|
|
37.5% |
|
|
42.5% |
|
|
45% |
|
|
47.5% |
Yohan was driving from the hospital to his house.

What directions best describe Yohan’s travel from the hospital to his house?
|
|
East, north-east, north |
|
|
West, north-west, north |
|
|
East, north-east, south |
|
|
West, north-west, south |
`text(The directions travelled by Yohan:)`

`text(The direction was East, North-East, and North)`
A man drives from his house to his office.

What directions best describe his way to the office?
|
|
North, north-west, west, south-west |
|
|
North, north-east, east, south-east |
|
|
North, north-east, east, south |
|
|
North, north-west, east, south-east |
`text(The directions travelled by the man:)`

`:.\ text(The direction was north, north-east, east, south-east.)`