SmarterEd

Aussie Maths & Science Teachers: Save your time with SmarterEd

  • Login
  • Get Help
  • About

Probability, STD2 S2 2007 HSC 2 MC

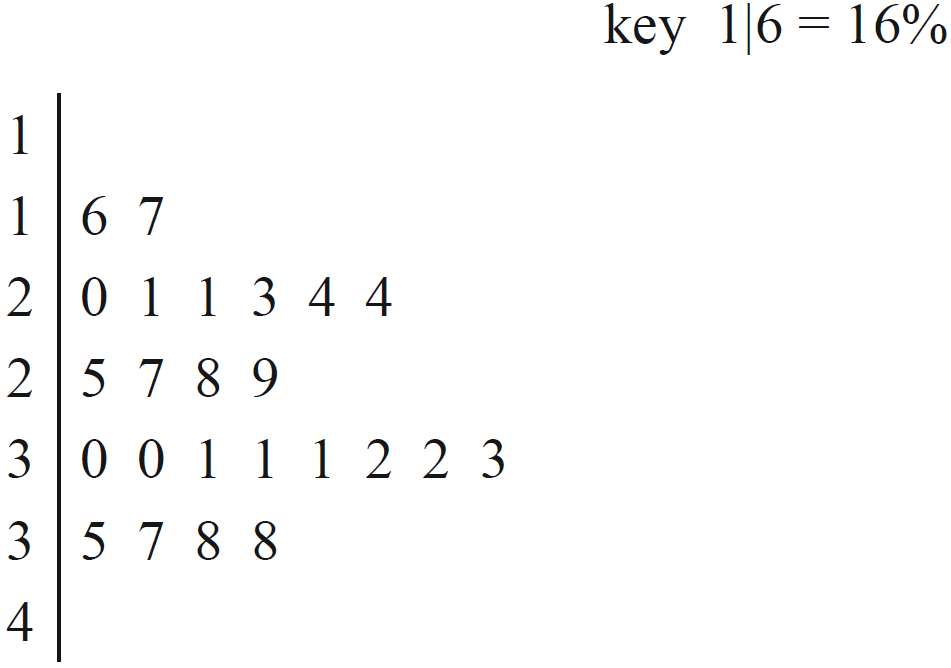
Each student in a class is given a packet of lollies. The teacher records the number of red lollies in each packet using a frequency table.
 

What is the relative frequency of a packet of lollies containing more than three red lollies?

  1.    `4/19`
  2.    `4/15`
  3.    `11/19`
  4.    `11/15`
Show Answers Only

`A`

Show Worked Solution

`text(# Packets with more than 3)`

`= 3 + 1 = 4`

`text(Total packets) = 19`

`:.\ text(Relative Frequency) = 4/19`

`=>  A`

Filed Under: Probability, Relative Frequency, Relative Frequency, Relative Frequency, Relative Frequency Tagged With: Band 3, common-content, num-title-ct-core, num-title-qs-hsc, smc-1133-10-Surveys/Two-Way Tables, smc-4225-35-Relative frequency, smc-827-10-Surveys/Two-Way Tables, smc-990-10-Surveys/Two-Way Tables

Measurement, STD2 M1 2007 HSC 1 MC

What is  `0.000\ 000\ 326`  mm expressed in scientific notation?

  1. `0.326 xx 10^-6\ \ text(mm)`
  2. `3.26 xx 10^-7\ \ text(mm)`
  3. `0.326 xx 10^6\ \ text(mm)`
  4. `3.26 xx 10^7\ \ text(mm)`
Show Answers Only

`B`

Show Worked Solution

`0.000\ 000\ 326\ text(mm)= 3.26 xx 10^-7\ \ text(mm)`

`=> B`

Filed Under: Identify and Convert Between Units, Identify and Convert Between Units, MM1 - Units of Measurement, Units and Measurement Error, Units and Measurement Error Tagged With: Band 3, smc-1120-20-Scientific Notation, smc-6303-40-Scientific Notation, smc-6519-40-Scientific Notation, smc-797-20-Scientific Notation

GEOMETRY, FUR1 2014 VCAA 3 MC

The diagram below shows the location of three boats, `A`, `B` and `C`.

Boat `B` is on a bearing of 110° from boat `A`.

Boat `B` is also on a bearing of 035° from boat `C`.

Boat `A` is due north of boat `C`.

The angle `ABC` is

A.    `35°`

B.    `65°`

C.    `70°`

D.    `75°`

E.  `110°` 

Show Answers Only

`D`

Show Worked Solution

`/_CAB` `= 180 – 110\ \ \ text{(straight angle at A)}`
  `= 70°`


`:./_ABC` `= 180 – (70 + 35)\ \ text{(Angle sum of}\ Delta ABC text{)}`
  `= 75°`

 
`=> D`

Filed Under: Trig - Bearings Tagged With: Band 3

GEOMETRY, FUR1 2014 VCAA 1 MC

The top of a ladder that is 4.50 m long rests 3.25 m up a wall, as shown in the diagram below.
 

The angle, `theta`, that the ladder makes with the wall is closest to

A.   `36°`

B.   `44°`

C.   `46°`

D.   `50°`

E.   `54°`

Show Answers Only

`B`

Show Worked Solution
`cos theta` `=text(adj)/text(hyp)`
  `=3.25/4.50`
  `=0.722…` 
`∴ theta` `= 43.76°` 

 
`=>B`

Filed Under: Right-Angled Trig and Angle Properties Tagged With: Band 3, smc-273-10-SOHCAHTOA

CORE*, FUR1 2014 VCAA 6 MC

Consider the following sequence.

`2,\ 1,\ 0.5\ …`

Which of the following difference equations could generate this sequence?

A. `t_(n + 1) = t_n - 1` `t_1 = 2`
B. `t_(n + 1) = 3 - t_n` `t_1 = 2`
C. `t_(n + 1) = 2 × 0.5^(n – 1)` `t_1 = 2`
D. `t_(n + 1) = - 0.5t_n + 2` `t_1 = 2`
E. `t_(n + 1) = 0.5t_n` `t_1 = 2`
Show Answers Only

`E`

Show Worked Solution

`text(Sequence is)\ \ 2, 1, 0.5, …`

NOTE: “GP” is used as an abbreviation of “geometric sequence”.

`=>\ text(Geometric sequence where common ratio = 0.5)`

`∴\ text(Difference equation is)`

`t_(n + 1) = 0.5t_n`

`=>  E`

Filed Under: Difference Equations - MC, Recursion - General Tagged With: Band 3, smc-714-20-RR (geometric), smc-714-60-Identify RR

CORE*, FUR1 2014 VCAA 4 MC

On day 1, Vikki spends 90 minutes on a training program.

On each following day, she spends 10 minutes less on the training program than she did the day before.

Let  `t_n`  be the number of minutes that Vikki spends on the training program on day  `n`.

A difference equation that can be used to model this situation for  `1 ≤ n ≤ 10`  is

A.   `t_(n + 1) = 0.90t_n` `t_1 = 90`
B.   `t_(n + 1) = 1.10 t_n` `t_1 = 90`
C.   `t_(n + 1) = t_n - 0.10` `t_1 = 90`
D.   `t_(n + 1) = 1 - 10 t_n` `t_1 = 90`
E.   `t_(n + 1) = t_n - 10` `t_1 = 90`


Show Answers Only

`E`

Show Worked Solution

`text(Difference equation where each term is 10 minutes)`

`text(less than the preceding term.)`

`∴\ text(Equation)\ \ \t_(n+1) = t_n-10, t_1 = 90`

`=>  E`

Filed Under: Difference Equations - MC, Recursion - General Tagged With: Band 3, smc-714-10-RR (arithmetic), smc-714-60-Identify RR

PATTERNS, FUR1 2014 VCAA 3 MC

A city has a population of 100 000 people in 2014.
Each year, the population of the city is expected to increase by 4%.
In 2018, the population is expected to be closest to

A.   `108\ 000` 

B.   `112\ 000` 

C.   `115\ 000`

D.   `117\ 000`

E.   `122\ 000`

Show Answers Only

`D`

Show Worked Solution

`text(Population is a geometric sequence with)`

`a = 100\ 000,\ \ \ \  r = 1.04`

`P_1 (2014)` `= a = text(100 000)`
`P_2 (2015)` `= ar^1 = text(100 000) (1.04) = text(104 000)`
`vdots`  
`P_5 (2018)` `= ar^4 = text(100 000) (1.04)^4 = text(116 985.8…)`


`∴\ text(In 2018, the population will be closest)`

`text(to)\ 117\ 000.`

`=> D`

Filed Under: APs and GPs - MC Tagged With: Band 3

CORE, FUR1 2014 VCAA 10-11 MC

The seasonal indices for the first 11 months of the year, for sales in a sporting equipment store, are shown in the table below.

Part 1

The seasonal index for December is

A.  `0.89`

B.  `0.97`

C.  `1.02`

D.  `1.23`

E.  `1.29`


Part 2

In May, the store sold $213 956 worth of sporting equipment.

The deseasonalised value of these sales was closest to

A.  `$165\ 857`

B.  `$190\ 420`

C.  `$209\ 677`

D.  `$218\ 322`

E.  `$240\ 400`

Show Answers Only

`text(Part 1:)\ E`

`text(Part 2:)\ E`

Show Worked Solution

`text(Part 1)`

`text(Sum of seasonal indices) = 12`

`:.\ text(December’s seasonal index)`

`=12 – text{(1.23 + 0.96 + 1.12 + 1.08 + 0.89}`
`text{+ 0.98 + 0.86 + 0.76 + 0.76 + 0.95 + 1.12)}`
`=1.29`

`=>E`


`text(Part 2)`

`text(May Index)` `=\ text(Actual Sales)/text{Deseasonalised Sales (D)}`
`0.89` `= (213\ 956)/(text{D})`
`:.\ text(D)` `= (213\ 956)/0.89`
  `= $240\ 400`

`=>  E`

Filed Under: Time Series Tagged With: Band 3, smc-266-10-Seasonal Index from a Table, smc-266-20-(De)Seasonalising Data

CORE, FUR1 2011 VCAA 9-10 MC

The length of a type of ant is approximately normally distributed with a mean of 4.8 mm and a standard deviation of 1.2 mm.

Part 1

From this information it can be concluded that around 95% of the lengths of these ants should lie between

A.   `text(2.4 mm and 6.0 mm)`

B.   `text(2.4 mm and 7.2 mm)`

C.   `text(3.6 mm and 6.0 mm)`

D.   `text(3.6 mm and 7.2 mm)`

E.   `text(4.8 mm and 7.2 mm)`


Part 2

A standardised ant length of  `z = text(−0.5)`  corresponds to an actual ant length of

A.   `text(2.4 mm)`

B.   `text(3.6 mm)`

C.   `text(4.2 mm)`

D.   `text(5.4 mm)`

E.   `text(7.0 mm)`

Show Answers Only

`text(Part 1:)\ B`

`text(Part 2:)\ C`

Show Worked Solution

`text(Part 1)`

`text(95% of scores lie between ±2 std dev)`

`bar x = 4.8, \ \ \ s = 1.2`

`text(Lower limit)` `= bar x – 2text(s)`
  `= 4.8 – 2(1.2)`
  `= 2.4\ text(mm)`
`text(Upper limit)` `= bar x + 2text(s)`
  `= 4.8 + 2(1.2)`
  `= 7.2\ text(mm)`

 
`=>B`
 

`text(Part 2)`

`z` `= \ \ (x – bar x)/s`
`-0.5` `= \ \ (x – 4.8)/1.2`
`-0.6` `= \ \ x – 4.8`
`x` `= \ \ 4.2\ text(mm)`

 
`=>C`


Filed Under: Normal Distribution Tagged With: Band 3, Band 4, smc-600-10-Single z-score, smc-600-20-z-score Intervals

CORE, FUR1 2009 VCAA 4-6 MC

The percentage histogram below shows the distribution of the fertility rates (in average births per woman) for 173 countries in 1975.

Part 1

In 1975, the percentage of these 173 countries with fertility rates of 4.5 or greater was closest to

A.   `12text(%)`  

B.   `35text(%)`  

C.   `47text(%)`  

D.   `53text(%)`  

E.   `65text(%)`  


Part 2

In 1975, for these 173 countries, fertility rates were most frequently

A.   less than 2.5

B.   between 1.5 and 2.5

C.   between 2.5 and 4.5 

D.   between 6.5 and 7.5 

E.   greater than 7.5 


Part 3

Which one of the boxplots below could best be used to represent the same fertility rate data as displayed in the percentage histogram?

Show Answers Only

`text(Part 1:)\ E`

`text(Part 2:)\ D`

`text(Part 3:)\ B`

Show Worked Solution

`text(Part  1)`

`text(Adding up the histogram bars from 4.5.)`

`%` `= 12 + 19  + 28 + 5 + 1`
  `= 65text(%)`

`=>  E`


`text(Part  2)`

`text(Fertility rates between 6.5 and 7.5 were 28%)`

`text(which is greater than any other range given.)`

`=>  D`


`text(Part  3)`

♦ Mean mark 43%.
MARKERS’ COMMENT: A systemic approach where students calculated the median, `Q_1` and `Q_3` was most successful.

`text(The boxplots have the same range, therefore)`

`text(consider the values of)\ Q_1,\ Q_3\ text(and median.)`

`text(By elimination,)`

`Q_1\ text{estimate is slightly below 3.5 (the first 2}`

`text{bars add up to 29%), therefore not A, D or E.}`

`Q_3\ text(estimate is around 7. Eliminate C.)`

`=>  B`

Filed Under: Graphs - Histograms and Other, Graphs - Stem/Leaf and Boxplots Tagged With: Band 2, Band 3, Band 5, smc-643-10-Single Box-Plots, smc-644-20-Histograms

CORE, FUR1 2008 VCAA 1-4 MC

The box plot below shows the distribution of the time, in seconds, that 79 customers spent moving along a particular aisle in a large supermarket.
 

     2008 1-4

Part 1

The longest time, in seconds, spent moving along this aisle is closest to

A.    `40`

B.    `60`

C.   `190`

D.   `450`

E.   `500`


Part 2

The shape of the distribution is best described as

A.   symmetric.

B.   negatively skewed.

C.   negatively skewed with outliers.

D.   positively skewed.

E.   positively skewed with outliers.


Part 3

The number of customers who spent more than 90 seconds moving along this aisle is closest to

A.    `7`

B.   `20`

C.   `26`

D.   `75`

E.   `79`


Part 4

From the box plot, it can be concluded that the median time spent moving along the supermarket aisle is

A.   less than the mean time.

B.   equal to the mean time.

C.   greater than the mean time

D.   half of the interquartile range.

E.   one quarter of the range.

Show Answers Only

`text(Part 1:)\ D`

`text(Part 2:)\ E`

`text(Part 3:)\ B`

`text(Part 4:)\ A`

Show Worked Solution

`text(Part 1)`

`text(Longest time is represented by the farthest right)`

`text(data point.)`

`=>D`


`text(Part 2)`

`text(Positively skewed as the tail of the distribution can)`

`text(clearly be seen to extend to the right.)`

`text(The data also clearly shows outliers.)`

`=>E`


`text(Part 3)`

♦ Mean mark 43%.
MARKERS’ COMMENT: Note that the outliers are already accounted for in the boxplot.

`text(From the box plot,)`

`text(Q)_3=90\ text{s}\ \ text{(i.e. 25% spend over 90 s)}`

`:.\ text(Customers that spend over 90 s)`

`= 25text(%) xx 79`

`=19.75`

`=>B`


`text(Part 4)`

`text(The mean is greater than the median for positively)`

`text(skewed data.)`

`=>A`

Filed Under: Graphs - Stem/Leaf and Boxplots Tagged With: Band 3, Band 4, Band 5, smc-643-10-Single Box-Plots, smc-643-70-Distribution Description

CORE*, FUR1 2010 VCAA 6 MC

`t_1=10`, `t_2=k`  and  `t_3=90`  are the first three terms of a difference equation with the rule  `t_n=t_(n - 1) + t_(n - 2)`.

The value of  `k`  is

A.  `30`

B.  `40`

C.  `50`

D.  `60`

E.  `80`

Show Answers Only

`E`

Show Worked Solution

`t_n=t_(n – 1) + t_(n – 2)\ \  … \ (1)`

`text(Given)\ \ t_1=10, \ t_2=k and t_3=90`

`text(Substituting into (1))`

`90` `=k + 10`
`k` `=80`

`=> E`

Filed Under: Difference Equations - MC, Recursion - General Tagged With: Band 3

PATTERNS, FUR1 2010 VCAA 5 MC

A team of swimmers was training.
Claire was the first swimmer for the team and she swam 100 metres.
Every other swimmer in the team swam 50 metres further than the previous swimmer.
Jane was the last swimmer for the team and she swam 800 metres.

The total number of swimmers in this team was

A.      `9`

B.    `13`

C.    `14`

D.    `15`

E.    `18`

Show Answers Only

`D`

Show Worked Solution

`text(Sequence is 100, 150, 200, … ,800)`

`text(AP where)\ \ \ a` `= 100`
`d` `=50`
`T_n` `=a + (n – 1)d`
`800` `=100 + (n – 1)50`
`700` `=50n – 50`
`50n` `=750`
`n` `=15`

`=> D`

Filed Under: APs and GPs - MC Tagged With: Band 3

PATTERNS, FUR1 2012 VCAA 3-4 MC

 Use the following information to answer Parts 1 and 2.

As part of a savings plan, Stacey saved $500 the first month and successively increased the amount that she saved each month by $50. That is, in the second month she saved $550, in the third month she saved $600, and so on.

Part 1

The amount Stacey will save in the 20th month is

A.  `$1450`

B.  `$1500`

C.  `$1650`

D.  `$1950`

E.  `$3050`


Part 2

The total amount Stacey will save in four years is

A.  `$13\ 400`

B.  `$37\ 200`

C.  `$58\ 800`

D.  `$80\ 400`

E.  `$81\ 600`

Show Answers Only

`text (Part 1:)\ A`

`text (Part 2:)\ D`

Show Worked Solution

`text (Part 1)`

`text (Sequence is 500, 550, 600,…)`

`text (AP where)\ \  a` `= 500, and` 
 `d` `= text (550 – 500 = 50)`
 `T_n` `= a + (n – 1) d` 
`T_20` `= 500 + (20 – 1)50`
  `= 1450`

`rArr A`


`text (Part 2)`

`n` `= 4 xx 12 = 48` 
 `S_n` `= n/2 [2a + (n-1)d]`
`S_4` `= 48/2 [2 xx 500 + (48-1)50]`
  `= 24 [1000 + 2350]`
  `= 80\ 400`

`rArr D`

Filed Under: APs and GPs - MC Tagged With: Band 3, Band 4

CORE*, FUR1 2012 VCAA 2 MC

A poultry farmer aims to increase the weight of a turkey by 10% each month.

The turkey’s weight, `T_n`, in kilograms, after `n` months, would be modelled by the rule

A.  `T_(n + 1) = T_n + 10`

B.  `T_(n + 1) = 1.1T_n + 10`

C.  `T_(n + 1) = 0.10T_n`

D.  `T_(n + 1) = 10T_n`

E.  `T_(n + 1) = 1.1T_n`


Show Answers Only

`E`

Show Worked Solution
`T_2` `=1.1T_1`  
`T_3` `= 1.1T_2` 
`vdots`   
`T_(n+1)` `= 1.1T_n`

 
`rArr E`

Filed Under: Difference Equations - MC, Recursion - General Tagged With: Band 3, smc-714-20-RR (geometric), smc-714-60-Identify RR

GEOMETRY, FUR1 2010 VCAA 1 MC

geometry 2010 VCAA 1mc

The value of `x` in the diagram above is

  1. `89`
  2. `90`
  3. `91`
  4. `101`
  5. `180`
Show Answers Only

`C`

Show Worked Solution

geometry 2010 VCAA 1mci

`y` `= 180 – 89\ \ text{(co-interior)}`
  `= 91°`
`:. x` `= 91°\ \ text{(vertically opposite)}`

 
`=> C`

Filed Under: Right-Angled Trig and Angle Properties Tagged With: Band 3, smc-273-60-Other angle properties

PATTERNS, FUR1 2010 VCAA 3 MC

The prizes in a lottery form the terms of a geometric sequence with a common ratio of 0.95.
If the first prize is $20 000, the value of the eighth prize will be closest to

A.     `$7000`

B.     `$8000`

C.     `$12\ 000`

D.     `$13\ 000`

E.     `$14\ 000`

Show Answers Only

`E`

Show Worked Solution

`text(GP has)\ \ r = 0.95`

`T_1` `=a=20000`
`T_2` `=ar=20000(0.95)=19\ 000`
`T_3` `=ar^2=20000(0.95)^2=18\ 050`
`vdots`  
`T_8`  `=ar^7=20000(0.95)^7=13\ 966.74`

`=> E`

Filed Under: APs and GPs - MC Tagged With: Band 3

PATTERNS, FUR1 2010 VCAA 2 MC

The first three terms of a geometric sequence are 

`0.125, 0.25, 0.5`

The fourth term in this sequence would be

A.    `0.625`

B.    `0.75`

C.    `0.875`

D.    `1`

E.    `1.25`

Show Answers Only

`D`

Show Worked Solution

`text(GP sequence is  0.125, 0.25, 0.5)`

`a` `=0.125`
`r` `=t_(2)/t_(1)=0.25/0.125=2`
`T_4` `=ar^3`
  `=0.125 xx 2^3`
  `=1`

`=> D`

Filed Under: APs and GPs - MC Tagged With: Band 3

CORE, FUR1 2010 VCAA 7-9 MC

The height (in cm) and foot length (in cm) for each of eight Year 12 students were recorded and displayed in the scatterplot below.
A least squares regression line has been fitted to the data as shown.
 

Part 1

By inspection, the value of the product-moment correlation coefficient `(r)` for this data is closest to

  1. `0.98`
  2. `0.78`
  3. `0.23`
  4. `– 0.44`
  5. `– 0.67`


Part 2

The explanatory variable is foot length.

The equation of the least squares regression line is closest to

  1. height = –110 + 0.78 × foot length.
  2. height = 141 + 1.3 × foot length.
  3. height = 167 + 1.3 × foot length.
  4. height = 167 + 0.67 × foot length.
  5. foot length = 167 + 1.3 × height.


Part 3

The plot of the residuals against foot length is closest to

CORE, FUR1 2010 VCAA 7-9 MCab

CORE, FUR1 2010 VCAA 7-9 MCcd

CORE, FUR1 2010 VCAA 7-9 MCe

Show Answers Only

`text(Part 1:)\ B`

`text(Part 2:)\ B`

`text(Part 3:)\ B`

Show Worked Solution

`text(Part 1)`

`text(The correlation is positive and strong.)`

`text(Eliminate)\ C, D\ text(and)\ E.`

`r= 0.98\  text(is too strong. Eliminate)\ A.`

`=> B`


`text(Part 2)`

♦♦ Mean mark 35%.
STRATEGY: An alternate but less efficient strategy could be to find 2 points and calculate the gradient and then use the point gradient formula.

`text(The intercept with the height axis)\ (ytext{-axis)}`

`text{is below 167 because that is the height when}`

`text{foot length = 20 cm.}`

`text(Eliminate)\ C, D\ text(and)\ E.`

`text(The gradient is approximately 1.3, by observing)`

`text(the increase in height values when the foot)`

`text(length increases from 20 to 22 cm.)`

`=>  B`


`text(Part 3)`

`text(First residual is positive. Eliminate)\ A, D, E.`

`text(The next 3 residuals are negative. Eliminate)\ C`

`=>  B`

Filed Under: Correlation and Regression Tagged With: Band 3, Band 4, Band 5, smc-265-10-r / r^2 and Association, smc-265-20-Find LSRL Equation/Gradient, smc-265-50-Residuals

CORE, FUR1 2011 VCAA 1-3 MC

The histogram below displays the distribution of the percentage of Internet users in 160 countries in 2007.
 

Part 1

The shape of the histogram is best described as

A.   approximately symmetric.

B.   bell shaped. 

C.   positively skewed.

D.   negatively skewed.

E.   bi-modal.


Part 2

The number of countries in which less than 10% of people are Internet users is closest to

A.   `10`

B.   `16`

C.   `22`

D.   `32`

E.   `54`


Part 3

From the histogram, the median percentage of Internet users is closest to

A.   `10text(%)`

B.   `15text(%)`

C.   `20text(%)`

D.   `30text(%)`

E.   `40text(%)`

Show Answers Only

`text(Part 1:)\ C`

`text(Part 2:)\ E`

`text(Part 3:)\ C`

Show Worked Solution

`text(Part 1)`

`text(The shape of the histogram has a definite tail)`

`text(on the right side which means it is positively)`

`text(skewed.)`

`=>  C`


`text(Part 2)`

`text(The histogram shows that 32% of countries fall)`

`text(between 0–5%, and 22% fall between 5–10%.)`

`:.\ text(Users below 10%)`

`= 32 + 22`

`= 54 text(%)`

`=>  E`


`text(Part 3)`

♦ Mean mark 45%.

`text(Total countries = 160)`

`text(Adding bars from the left hand side, there are)`

`text{80 countries in the first 4 bars (i.e. half of 160).}`

`:.\ text(Median is closest to 20%)`

`=>  C`

Filed Under: Graphs - Histograms and Other, Summary Statistics Tagged With: Band 3, Band 5, smc-468-40-Median Mode and Range, smc-644-20-Histograms, smc-644-60-Distribution Description

Trig Ratios, EXT1 2008 HSC 6a

From a point  `A`  due south of a tower, the angle of elevation of the top of the tower  `T`, is 23°. From another point  `B`, on a bearing of 120° from the tower, the angle of elevation of  `T`  is 32°. The distance  `AB`  is 200 metres.
 

Trig Ratios, EXT1 2008 HSC 6a 
 

  1. Copy or trace the diagram into your writing booklet, adding the given information to your diagram.  (1 mark)
  2. Hence find the height of the tower.   (3 marks)
Show Answers Only
  1. Trig Ratios, EXT1 2008 HSC 6a Answer

  2. `96\ text(m)`
Show Worked Solution

(i) 

Trig Ratios, EXT1 2008 HSC 6a Answer 


(ii)  `text(Find)\ \ OT = h`

`text(Using the cosine rule in)\ Delta AOB :`

`200^2 = OA^2 + OB^2 – 2 * OA * OB * cos 60\ …\ text{(*)}`

 `text(In)\ Delta OAT,\tan 23^@= h/(OA)`

`=> OA= h/(tan 23^@)\  …\ (1)`

 `text(In)\ Delta OBT,\ tan 32^@= h/(OB)`

`=> OB= h/(tan 32^@)\ \ \ …\ (2)`
 

`text(Substitute)\ (1)\ text(and)\ (2)\ text(into)\ text{(*)}`

`200^2` `= (h^2)/(tan^2 23^@) + (h^2)/(tan^2 32^@) – 2 * h/(tan 23^@) * h/(tan 32^@) * 1/2`
  `= h^2 (1/(tan^2 23^@) + 1/(tan^2 32^@) + 1/(tan23^@ * tan32^@) )`
  `= h^2 (4.340…)`
`h^2` `= (40\ 000)/(4.340…)`
  `= 9214.55…`
`:. h` `= 95.99…`
  `= 96\ text(m)\ \ \ text{(to nearest m)}`

Filed Under: 5. Trig Ratios EXT1 Tagged With: Band 3, Band 4

CORE, FUR1 2014 VCAA 7 MC

The parallel boxplots below summarise the distribution of population density, in people per square kilometre, for 27 inner suburbs and 23 outer suburbs of a large city.
 

Which one of the following statements is not true?

  1. More than 50% of the outer suburbs have population densities below 2000 people per square kilometre. 
  2. More than 75% of the inner suburbs have population densities below 6000 people per square kilometre. 
  3. Population densities are more variable in the outer suburbs than in the inner suburbs.
  4. The median population density of the inner suburbs is approximately 4400 people per square kilometre.
  5. Population densities are, on average, higher in the inner suburbs than in the outer suburbs.
Show Answers Only

`C`

Show Worked Solution

`text(The chart of the inner suburbs has both a higher IQR and)`

`text(range than the outer suburbs. This supports the argument)`

`text(that densities are NOT more variable in the outer suburbs,)`

`text(making C an untrue statement.)`


`text(All other statements can be shown to be true using)`

`text(quartile and median comparisons.)`

`=>  C`

Filed Under: Graphs - Stem/Leaf and Boxplots Tagged With: Band 3, smc-643-20-Parallel Box-Plots

CORE, FUR1 2014 VCAA 3-5 MC

The following table shows the data collected from a sample of seven drivers who entered a supermarket car park. The variables in the table are:

distance – the distance that each driver travelled to the supermarket from their home
 

    • sex – the sex of the driver (female, male)
    • number of children – the number of children in the car
    • type of car – the type of car (sedan, wagon, other)
    • postcode – the postcode of the driver’s home.
       

Part 1

The mean,  `barx`, and the standard deviation, `s_x`, of the variable, distance, are closest to

A.  `barx = 2.5\ \ \ \ \ \ \s_x = 3.3`

B.  `barx = 2.8\ \ \ \ \ \ \s_x = 1.7`

C.  `barx = 2.8\ \ \ \ \ \ \s_x = 1.8`

D.  `barx = 2.9\ \ \ \ \ \ \s_x = 1.7`

E.  `barx = 3.3\ \ \ \ \ \ \s_x = 2.5`


Part 2

The number of categorical variables in this data set is

A.  `0`

B.  `1`

C.  `2`

D.  `3`

E.  `4`


Part 3

The number of female drivers with three children in the car is

A.  `0`

B.  `1`

C.  `2`

D.  `3`

E.  `4`


Show Answers Only

`text(Part 1:) \ C`

`text(Part 2:)\ D`

`text(Part 3:)\ B`

Show Worked Solution

`text(Part 1)`

`text(By calculator)`

`text(Distance)\ \ barx` `=2.8`
`s_x` `≈1.822`

 
`=>C`


`text(Part 2)`

♦♦ Mean mark 29%.
MARKER’S NOTE: Postcodes here are categorical variables. Ask yourself “Does it make sense to calculate the mean of this variable?” If the answer is “No”, the variable is categorical.

`text(Categorical variables are sex, type)`

`text(of car, and post code.)`

`=>D`


`text(Part 3)`

`text(1 female driver has 3 children.)`

`=>B`

Filed Under: Summary Statistics Tagged With: Band 2, Band 3, Band 6, smc-468-10-Data Classification, smc-468-20-Mean, smc-468-30-Std Dev

CORE, FUR1 2014 VCAA 2 MC

The time spent by shoppers at a hardware store on a Saturday is approximately normally distributed with a mean of 31 minutes and a standard deviation of 6 minutes.

If 2850 shoppers are expected to visit the store on a Saturday, the number of shoppers who are expected to spend between 25 and 37 minutes in the store is closest to

A.   16

B.   68

C.   460

D.   1900

E.   2400

Show Answers Only

`D`

Show Worked Solution
`barx=31` `s=6`
`ztext{-score (25)}` `=(x-barx)/s`
  `=(25-31)/6`
  `=–1`


`z text{-score (37)}` `=(37-31)/6`
  `=1`


`∴\ text(# Shoppers)` `= text(68%) xx 2850`
  `=1938`

 
`=>  D`

Filed Under: Normal Distribution Tagged With: Band 3, smc-600-20-z-score Intervals

CORE, FUR1 2014 VCAA 1 MC

The following ordered stem plot shows the areas, in square kilometres, of 27 suburbs of a large city.


The median area of these suburbs, in square kilometres, is

A.   `3.0` 

B.   `3.1` 

C.   `3.5`

D.   `30.0`

E.   `30.5`

Show Answers Only

`B`

Show Worked Solution

`text(# Data points = 27)`

`text(Median is)\ \ \ (27+1)/2 = text(14th)`

`∴ text(Median)=3.1\ text(km²)`

`=>  B`

Filed Under: Graphs - Stem/Leaf and Boxplots Tagged With: Band 3, smc-643-40-Stem and Leaf

CORE, FUR1 2012 VCAA 6 MC

The table below shows the percentage of households with and without a computer at home for the years 2007, 2009 and 2011.


In the year 2009, a total of  `5\ 170\ 000` households were surveyed.

The number of households without a computer at home in 2009 was closest to

A.       `801\ 000`
B.    `1\ 153\ 000`
C.    `1\ 737\ 000`
D.    `3\ 433\ 000`
E.    `4\ 017\ 000`
Show Answers Only

`B`

Show Worked Solution

`text (In 2009, the percentage of households without)`

`text(a computer = 22.3%.)`

`:.\ text (# Households without a computer)`

`= 22.3 text (%) xx 5\ 170\ 000`

`= 1\ 152\ 910`

`rArr B`

Filed Under: Graphs - Histograms and Other Tagged With: Band 3, smc-644-50-Frequency Tables

CORE, FUR1 2010 VCAA 5-6 MC

The lengths of the left feet of a large sample of  Year 12 students were measured and recorded. These foot lengths are approximately normally distributed with a mean of 24.2 cm and a standard deviation of 4.2 cm.

Part 1

A Year 12 student has a foot length of 23 cm.
The student’s standardised foot length (standard `z` score) is closest to

A.   –1.2

B.   –0.9

C.   –0.3

D.    0.3

E.     1.2


Part 2

The percentage of students with foot lengths between 20.0 and 24.2 cm is closest to

A.   16%

B.   32%

C.   34%

D.   52%

E.   68%

Show Answers Only

`text(Part 1:)\ C`

`text(Part 2:)\ C`

Show Worked Solution

`text(Part 1)`

`bar(x) = 24.2,`    `s=4.2`
`z text{-score (23)}` `=(x – bar(x))/s`
  `= (23 – 24.2)/4.2`
  `= -0.285…`

`=>  C`


`text(Part 2)`

   `z text{-score (20)}` `=(20- 24.2)/4.2`
  `= -1`
 `z text{-score (24.2)}` `= 0`


`text(68% have a)\ z text(-score between  –1 and 1)`

`:.\ text(34% have a)\ z text(-score between  –1 and 0)`

`=>  C`

Filed Under: Normal Distribution Tagged With: Band 3, Band 4, smc-600-10-Single z-score, smc-600-20-z-score Intervals

CORE, FUR1 2010 VCAA 4 MC

The passengers on a train were asked why they travelled by train. Each reason, along with the percentage of passengers who gave that reason, is displayed in the segmented bar chart below.
 

CORE, FUR1 2010 VCAA 4 MC
 

The percentage of passengers who gave the reason ‘no car’ is closest to

A.   `text(14%)`

B.   `text(18%)`

C.   `text(26%)`

D.   `text(74%)`

E.   `text(88%)`

Show Answers Only

`A`

Show Worked Solution

`text(Percentage that stated “no car”)`

`=\ text(88% – 74%)`

`=\ text(14%)`

`=>  A`

Filed Under: Graphs - Histograms and Other Tagged With: Band 3, smc-644-40-Segmented Bar Charts

CORE, FUR1 2009 VCAA 8 MC

An animal study was conducted to investigate the relationship between exposure to danger during sleep (high, medium, low) and chance of attack (above average, average, below average). The results are summarised in the percentage segmented bar chart below.


The percentage of animals whose exposure to danger during sleep is high, and whose chance of attack is below average, is closest to

A.     `4text(%)`

B.   `12text(%)`

C.   `28text(%)`

D.   `72text(%)`

E.   `86text(%)`

Show Answers Only

`E`

Show Worked Solution

`text(The correct percentage is the black bar section)`

`text(above the “high” column heading.)`

`=>E`

Filed Under: Graphs - Histograms and Other Tagged With: Band 3, smc-644-40-Segmented Bar Charts

CORE, FUR1 2009 VCAA 1-3 MC

The back-to-back ordered stem plot below shows the female and male smoking rates, expressed as a percentage, in 18 countries.


Part 1

For these 18 countries, the lowest female smoking rate is

A.     `5text(%)`  

B.     `7text(%)`  

C.     `9text(%)`  

D.   `15text(%)`  

E.   `19text(%)`  


Part 2

For these 18 countries, the interquartile range (IQR) of the female smoking rates is

A.     `4` 

B.     `6`

C.   `19`

D.   `22`

E.   `23`


Part 3

For these 18 countries, the smoking rates for females are generally

A.   lower and less variable than the smoking rates for males.

B.   lower and more variable than the smoking rates for males.

C.   higher and less variable than the smoking rates for males.

D.   higher and more variable than the smoking rates for males.

E.   about the same as the smoking rates for males.

Show Answers Only

`text(Part  1:) \ D`

`text(Part  2:) \ B`

`text(Part  3:) \ A`

Show Worked Solution

`text(Part  1)`

`text(Lowest female smoking rate is 15%.)`

`=>  D`


`text(Part  2)`

`text(18 data points.)`

`text(Split in half and take the middle point of each group.)`

`Q_L` `=5 text(th value = 19%)`
`Q_U` `= 14 text(th value = 25%)`
 `∴ IQR` `= 25text(% – 19%) =6text(%)` 

 
`=>  B`


`text(Part  3)`

`text{Smoking rates are lower and less variable (range of}`

`text{females rates vs male rates is 13% vs 30%).}`

`=>  A`

Filed Under: Graphs - Stem/Leaf and Boxplots Tagged With: Band 2, Band 3, smc-643-50-Back-to-Back Stem and Leaf, smc-643-70-Distribution Description

PATTERNS, FUR1 2013 VCAA 3 MC

The first time a student played an online game, he played for 18 minutes.
Each time he played the game after that, he played for 12 minutes longer than the previous time.
After completing his 15th game, the total time he had spent playing these 15 games was

A.   `186` minutes 

B.   `691` minutes  

C. `1206` minutes 

D. `1395` minutes  

E. `1530` minutes

Show Answers Only

`E`

Show Worked Solution

`text(Series)\quad18, 18+12, 18+(2×12), …`

`text(AP with)\quad a=18 and d=12`

`S_n` `=n/2[2a+(n-1)d]`
`S_15` `=15/2[2(18)+(15-1)12]`
  `=15/2(36+168)`
  `=15/2(204)`
  `=1530`

`=> E`

Filed Under: APs and GPs - MC Tagged With: Band 3

CORE, FUR1 2013 VCAA 12-13 MC

The time series plot below displays the number of guests staying at a holiday resort during summer, autumn, winter and spring for the years 2007 to 2012 inclusive.
 

CORE, FUR1 2013 VCAA 12-13 MC_1
 

 Part 1

Which one of the following best describes the pattern in the time series?

A.  random variation only

B.  decreasing trend with seasonality

C.  seasonality only

D.  increasing trend only

E.  increasing trend with seasonality 


Part 2

The table below shows the data from the times series plot for the years 2007 and 2008. 
 

CORE, FUR1 2013 VCAA 12-13 MC_2
 

Using four-mean smoothing with centring, the smoothed number of guests for winter 2007 is closest to

A.  `85`

B.  `107`

C.  `183`

D.  `192`

E.  `200` 

Show Answers Only

`text(Part 1:)\ C`

`text(Part 2:)\ D`

Show Worked Solution

`text(Part 1)`

`text(The pattern in the time series is seasonal only,)`

`text(with peaks appearing in Summer. There is no)`

`text(apparent year-to-year trend.)`

`=> C`


`text(Part 2)`

`text{Mean of guests (Season 1-4)}`

`=(390+126+85+130)/4`
`=182.75`


`text{Mean of guests (Season 2-5)}`

`=(126+85+85+130+460)/4`
`=200.25`


`:.\ text(Four-mean smoothing with centring)`

`=(182.75+200.25)/2`
`=191.5`

`=> D`

Filed Under: Time Series Tagged With: Band 3, Band 4, smc-266-40-Time Series Trends, smc-266-60-MEAN Smoothing

CORE, FUR1 2013 VCAA 8 MC

The table below shows the hourly rate of pay earned by 10 employees in a company in 1990 and in 2010.
 

CORE, FUR1 2013 VCAA 8 MC
 

The value of the correlation coefficient, `r`, for this set of data is closest to

A.   `0.74`  

B.   `0.86`  

C.   `0.92`

D.   `0.93`

E.   `0.96`

Show Answers Only

`E`

Show Worked Solution

`text(By calculator)`

`r=0.962…`

`=> E`

Filed Under: Correlation and Regression Tagged With: Band 3, smc-265-10-r / r^2 and Association

CORE, FUR1 2013 VCAA 5-6 MC

The time, in hours, that each student spent sleeping on a school night was recorded for 1550 secondary-school students. The distribution of these times was found to be approximately normal with a mean of 7.4 hours and a standard deviation of 0.7 hours.
 

Part 1

The time that 95% of these students spent sleeping on a school night could be 

A.  less than 6.0 hours.   

B.  between 6.0 and 8.8 hours.

C.  between 6.7 and 8.8 hours.

D.  less than 6.0 hours or greater than 8.8 hours.

E.  less than 6.7 hours or greater than 9.5 hours.


Part 2

The number of these students who spent more than 8.1 hours sleeping on a school night was closest to

A.       16

B.     248

C.   1302

D.   1510

E.   1545

Show Answers Only

`text(Part 1:)\ B`

`text(Part 2:)\ B`

Show Worked Solution

`text(Part 1)`

`-2 < z text(-score) < 2,\ \ text(contains 95% of students.)`

`barx=7.4, \ \ \ s=0.7`

`z text(-score of +2)` `= 7.4+(2×0.7)`
  `= 8.8\ text(hours)`           
   
`z text(-score of –2)` `= 7.4−(2×0.7)`
  `= 6.0\ text(hours)`


`:. 95 text(% students sleep between 6 and 8.8 hours.`

 `=>B`
 

`text(Part 2)`

`text (Find)\ z text(-score of 8.1 hours)`

`ztext(-score)` `= (x-barx)/s` 
  `= (8.1-7.4)/0.7`
  `= 1`

 
`text(68% students have)\ \   –1 < z text(-score) < 1`

`:. 16 text(% have)\ z text(-score) > 1`

`:.\ text(# Students)` `= 16text(%) xx1550`
  `= 248`

 `=>B`

Filed Under: Normal Distribution Tagged With: Band 3, smc-600-10-Single z-score, smc-600-20-z-score Intervals

CORE, FUR1 2013 VCAA 3-4 MC

The heights of 82 mothers and their eldest daughters are classified as 'short', 'medium' or 'tall'. The results are displayed in the frequency table below.
 

CORE, FUR1 2013 VCAA 3-4 MC

 
 Part 1

The number of mothers whose height is classified as 'medium' is

 A.   `7` 

B.  `10` 

C.  `14`

D.  `31`

E.  `33`


Part 2

Of the mothers whose height is classified as 'tall', the percentage who have eldest daughters whose height is classified as 'short' is closest to

A.    `text(3%)`

B.    `text(4%)`

C.  `text(14%)`

D.  `text(17%)`

E.  `text(27%)`

Show Answers Only

`text(Part 1:)\ D`

`text(Part 2:)\ C`

Show Worked Solution

       `text(Part 1)`

`text(# Mothers classified as medium)`

`=10+14+7\ \ \ text{(from Table)}`
`=31`

`=>D` 


`text(Part 2)`

♦ Mean mark 45%.
MARKER’S COMMENT: Many students obtained the wrong base of 82 for this percentage calculation.
`text(# Tall Mothers)` `=3+11+8` 
  `=22`

`text{# Tall Mothers with short eldest = 3 (from Table)}`

`:.\ text(Percentage)` `=3/22×100`
  `=13.6363…%`

`=>  C`

Filed Under: Graphs - Histograms and Other Tagged With: Band 3, Band 5, smc-644-50-Frequency Tables

CORE, FUR1 2013 VCAA 1-2 MC

The following ordered stem plot shows the percentage of homes connected to broadband internet for 24 countries in 2007.
 

   CORE, FUR1 2013 VCAA 1-2 MC 
 

 Part 1

The number of these countries with more than 22% of homes connected to broadband internet in 2007 is

A.    `4`

B.    `5`

C.  `19`

D.  `20`

E.  `22`


Part 2

Which one of the following statements relating to the data in the ordered stem plot is not true?

A.  The minimum is 16%.

B.  The median is 30%.

C.  The first quartile is 23.5%

D.  The third quartile is 32%.

E.  The maximum is 38%.

Show Answers Only

`text(Part 1:)\ C`

`text(Part 2:)\ B`

Show Worked Solution

`text(Part 1)`

`text(There are 19 values greater than 22%)`

      `=>  C`


`text(Part 2)`

`text(24 data points.)` 

`text(Median)` `= text(12th + 13th)/2`
  `=(29+30)/2`
  `=29.5`


`:.\ text(B is incorrect and all other  statements can)`

`text(be verified as true.)`

`=>  B`

Filed Under: Graphs - Stem/Leaf and Boxplots Tagged With: Band 2, Band 3, smc-643-40-Stem and Leaf

Functions, EXT1 F1 2008 HSC 3a

  1.  Sketch the graph of  `y = |\ 2x-1\ |`.   (1 mark)

    --- 8 WORK AREA LINES (style=lined) ---

  2.  Hence, or otherwise, solve  `|\ 2x-1\ | <= |\ x-3\ |`.    (3 marks)

    --- 5 WORK AREA LINES (style=lined) ---

Show Answers Only

a.    

Real Functions, EXT1 2008 HSC 3a Answer

b.    `-2 <= x <= 4/3`

Show Worked Solution
a.    Real Functions, EXT1 2008 HSC 3a Answer


b.    `text(Solving for)\ \ |\ 2x-1\ | <= |\ x-3\ |`

`text(Graph shows the statement is TRUE between the)`

`text(points of intersection.)`

`=>\ text(Intersection occurs when)`

`(2x-1)` `= (x-3)\ \ \ text(or)\ \ \ ` `-(2x-1)` `= x-3`
`x` `= -2` `-2x + 1` `= x-3`
    `-3x` `= -4`
    `x` `= 4/3`


`:.\ text(Solution is)\ \ {x: -2 <=  x <= 4/3}`

Filed Under: 1. Basic Arithmetic and Algebra EXT1, 4. Real Functions EXT1, Graphical Relationships, Inequalities, Inequalities Tagged With: Band 3, Band 4, smc-1033-20-Absolute Value, smc-1072-30-\(y=\abs{f(x)}; y=f(\abs{x}) \), smc-6640-30-\(y=\abs{f(x)}; y=f(\abs{x}) \), SMc-6643-20-Absolute Value, y = f(|x|)

Functions, EXT1 F2 2008 HSC 2c

The polynomial `p(x)` is given by  `p(x) = ax^3 + 16x^2 + cx-120`, where `a` and `c` are constants.

The three zeros of `p(x)` are `-2,  3` and `beta`.

Find the value of `beta`.   (3 marks) 

--- 6 WORK AREA LINES (style=lined) ---

Show Answers Only

`-5`

Show Worked Solution

`p(x) = ax^3 + 16x^2 + cx-120`

`text(Roots:)\ \ -2, \ 3, \ beta`

`-2 + 3 + beta` `= -B/A`
`beta + 1` `= -16/a`
`beta` `= -16/a-1\ \ \ \ \ …\ (1)`


`-2 xx 3 xx beta` `= -D/A`
`-6 beta` `= 120/a`
`beta` `= -20/a\ \ \ \ \ …\ (2)`


MARKER’S COMMENT: Many students displayed significant inefficiencies in solving simultaneous equations.
`- 16/a-1` `= -20/beta`
`-16-a` `= -20`
`a` `= 4`

 
`text(Substitute)\ \ a = 4\ \ text(into)\ (1):`

`beta=-16/4-1= -5`

Filed Under: Roots, Remainders and Factors, Sum, Products and Multiplicity of Roots, Sums and Products of Zeroes Tagged With: Band 3, Band 4, smc-1205-10-Sum and Product, smc-6645-10-Sum and Product

Calculus, EXT1 C2 2008 HSC 1c

Evaluate  `int_-1^1 1/sqrt(4 - x^2)\ dx`.   (2 marks)

Show Answers Only

`pi/3`

Show Worked Solution

`int_-1^1 1/sqrt(4 – x^2)\ dx`

`= [sin^(-1) (x/2)]_(-1)^1`

`= sin^(-1) (1/2) – sin^(-1) (-1/2)`

`= pi/6 – (- pi/6)`

`= pi/3`

Filed Under: Inverse Functions Calculus, Inverse Trig Functions EXT1 Tagged With: Band 3, smc-1037-30-Sin/Cos Integration

Calculus, EXT1 C2 2008 HSC 1b

Differentiate  `cos^(–1) (3x)`  with respect to  `x`.   (2 marks)

Show Answers Only

`(-3)/sqrt(1 – 9x^2)`

Show Worked Solution
`y` `= cos^(-1) (3x)`
`dy/dx` `= – 1/sqrt(1 – (3x)^2) * d/(dx) (3x)`
  `= (-3)/sqrt(1 – 9x^2)`

Filed Under: Inverse Functions Calculus, Inverse Trig Functions EXT1 Tagged With: Band 3, smc-1037-10-Sin/Cos Differentiation

Functions, EXT1 F2 2008 HSC 1a

The polynomial  `x^3`  is divided by  `x + 3`. Calculate the remainder.   (2 marks)

Show Answers Only

`-27`

Show Worked Solution

`P(-3)= (-3)^3= -27`

`:.\ text(Remainder when)\ x^3 -: (x + 3) = -27`

MARKER’S COMMENT: “Grave concern” that many who found `P(-3)=-27` stated the remainder was 27!

Filed Under: Polynomials, Remainder and Factor Theorems, Remainder and Factor Theorems, Roots, Remainders and Factors Tagged With: Band 3, num-title-ct-patha, num-title-qs-hsc, smc-1031-20-Remainder Theorem, smc-6644-20-Remainder Theorem

Statistics, STD2 S1 2008 HSC 26d

The graph shows the predicted population age distribution in Australia in 2008.


  1. How many females are in the 0–4 age group?   (1 mark)

    --- 1 WORK AREA LINES (style=lined) ---

  2. What is the modal age group?   (1 mark)

    --- 1 WORK AREA LINES (style=lined) ---

  3. How many people are in the 15–19 age group?   (2 marks)

    --- 4 WORK AREA LINES (style=lined) ---

  4. Give ONE reason why there are more people in the 80+ age group than in the 75–79 age group.   (1 mark)

    --- 2 WORK AREA LINES (style=lined) ---

Show Answers Only

a.    `600\ 000`

b.    `35-39`

c.    `1\ 450\ 000`

d.    `text(The 80+ group includes all people over 80)`

`text(and is not restricted by a 5-year limit.)`

Show Worked Solution

a.    `text{# Females} (0-4)= 0.6 xx 1\ 000\ 000= 600\ 000`

b.    `text(Modal age group)\ =35-39`

c.    `text{# Males} (15-19)= 0.75 xx 1\ 000\ 000= 750\ 000`

`text{# Females} (15-19)= 0.7 xx 1\ 000\ 000= 700\ 000`

`:.\ text{Total People} (15-19)` `= 750\ 000 + 700\ 000`
  `= 1\ 450\ 000`


d.     `text(The 80+ group includes all people over 80)`
  `text(and is not restricted by a 5-year limit.)`

Filed Under: Bar Charts and Histograms, Bar Charts and Histograms, Bar Charts and Histograms, Bar Charts and Histograms, Bar Charts and Histograms, Bar Charts, Histograms and Other Graphs, Data Analysis Tagged With: Band 3, Band 4, Band 5, common-content, num-title-ct-core, num-title-qs-hsc, smc-1128-15-Histograms, smc-4224-15-Mode, smc-4224-35-Describing datasets, smc-6310-20-Histograms, smc-6530-20-Histograms, smc-821-15-Histograms, smc-997-15-Histograms

Probability, STD2 S2 2008 HSC 26a

Cecil invited 175 movie critics to preview his new movie. After seeing the movie, he conducted a survey. Cecil has almost completed the two-way table.
 

  1. Determine the value of  `A`.   (1 mark)

    --- 1 WORK AREA LINES (style=lined) ---

  2. A movie critic is selected at random.


    What is the probability that the critic was less than 40 years old and did not like the movie?  (2 marks)

    --- 4 WORK AREA LINES (style=lined) ---

  3. Cecil believes that his movie will be a box office success if 65% of the critics who were surveyed liked the movie.


    Will this movie be considered a box office success? Justify your answer.  (1 mark)

    --- 2 WORK AREA LINES (style=lined) ---

Show Answers Only
  1. `58`
  2. `6/25`
  3. `text(Proof)\ \ text{(See Worked Solutions)}`
Show Worked Solution

i.  `text{Critics liked and}\ >= 40`

`= 102-65`

`= 37`

`:. A = 37+31=68`

 
ii.
  `text{Critics did not like and < 40}`

`= 175-65-37-31`

`= 42`
 

`:.\ P text{(not like and  < 40)}`

`= 42/175`

`= 6/25`
 

iii.   `text(Critics liked) = 102`

`text(% Critics liked)` `= 102/175 xx 100`
  `= 58.28…%`

 
`:.\ text{Movie NOT a box office success (< 65% critics liked)}`

Filed Under: Relative Frequency, Relative Frequency, Relative Frequency, Relative Frequency, Relative Frequency and Venn Diagrams Tagged With: Band 3, Band 4, common-content, num-title-ct-pathb, num-title-qs-hsc, smc-1133-10-Surveys/Two-Way Tables, smc-4815-10-2-Way tables, smc-827-10-Surveys/Two-Way Tables, smc-990-10-Surveys/Two-Way Tables

Financial Maths, STD2 F1 2008 HSC 24a

Bob is employed as a salesman. He is offered two methods of calculating his income.

\begin{array} {|l|}
\hline
\rule{0pt}{2.5ex}\text{Method 1: Commission only of 13% on all sales}\rule[-1ex]{0pt}{0pt} \\
\hline
\rule{0pt}{2.5ex}\text{Method 2: \$350 per week plus a commission of 4.5% on all sales}\rule[-1ex]{0pt}{0pt} \\
\hline
\end{array}

Bob’s research determines that the average sales total per employee per month is $15 670. 

  1. Based on his research, how much could Bob expect to earn in a year if he were to choose Method 1?   (2 marks)

    --- 4 WORK AREA LINES (style=lined) ---

  2. If Bob were to choose a method of payment based on the average sales figures, state which method he should choose in order to earn the greater income. Justify your answer with appropriate calculations.   (3 marks)

    --- 6 WORK AREA LINES (style=lined) ---

Show Answers Only
  1. `$24\ 445.20`
  2. `text(Proof)\ \ text{(See Worked Solutions)}`
Show Worked Solution

a.    `text(Method 1)`

`text(Yearly sales)= 12 xx 15\ 670= 188\ 040`

`:.\ text(Earnings)= text(13%) xx 188\ 040= $24\ 445.20`

b.    `text(Method 2)`

`text(In 1 Year, Weekly Wage)= 350 xx 52= 18\ 200`

`text(Commission)= text(4.5%) xx 188\ 040= 8461.80`

`text(Total earnings)= 18\ 200 + 8461.80= $26\ 661.80`

`:.\ text(Bob should choose Method 2.)`

Filed Under: Earning and Spending Money, Earning Money and Budgeting, Earning Money and Budgeting, FM1 - Earning money, Ways of Earning, Ways of Earning Tagged With: Band 3, Band 4, num-title-ct-corea, num-title-qs-hsc, smc-1126-20-Commission, smc-4226-20-Commission, smc-6276-20-Commission, smc-6515-20-Commission, smc-810-20-Commission

Statistics, STD2 S1 2008 HSC 23a

You are organising an outside sporting event at Mathsville and have to decide which month has the best weather for your event. The average temperature must be between 20°C and 30°C, and average rainfall must be less than 80 mm.

The radar chart for Mathsville shows the average temperature for each month, and the table gives the average rainfall for each month.
 

VCAA 2008 23a
 

  1. If you consider only the temperature data, there are a number of possible months for holding the event. Name ONE of these months.  (1 mark)

    --- 1 WORK AREA LINES (style=lined) ---

  2. If both rainfall and temperature data are considered, which month is the best month for the sporting event?   (1 mark)

    --- 1 WORK AREA LINES (style=lined) ---

Show Answers Only
  1. `text(One of Feb, Mar, Nov, Dec)`
  2. `text(November)`
Show Worked Solution

i.  `text(One of Feb, Mar, Nov, Dec)`
 

ii.  `text(November)`

Filed Under: Bar Charts, Histograms and Other Graphs, Other Charts, Other Graphs Tagged With: Band 3, smc-1128-28-Other Charts, smc-822-40-Other Charts

Measurement, STD2 M6 2008 HSC 14 MC

Danni is flying a kite that is attached to a string of length 80 metres. The string makes an angle of 55° with the horizontal.

How high, to the nearest metre, is the kite above Danni’s hand?
 

VCAA 2008 14 mc
 

  1.    46 m
  2. 66 m
  3. 98 m
  4. 114 m
Show Answers Only

`B`

Show Worked Solution

2UG 2008 14MC ans

`sin 55^@` `= h/80`
`h` `= 80 xx sin 55^@`
  `= 65.532…\ text(m)`

`=>  B`

Filed Under: M3 Right-Angled Triangles (Y12), Pythagoras and basic trigonometry, Pythagoras and Right-Angled Trig Tagged With: Band 3, smc-1103-20-Right-angled Trig, smc-802-20-Right-Angled Trig

Financial Maths, STD2 F1 2008 HSC 7 MC

Luke’s normal rate of pay is $15 per hour. Last week he was paid for 12 hours, at time-and-a-half.

How many hours would Luke need to work this week, at double time, to earn the same amount?

  1. 4
  2. 6
  3. 8
  4. 9
Show Answers Only

`D`

Show Worked Solution

`text(Amount earned last week)= 270/30= 9\ text(hrs)`

`text(Double time rate)= 2 xx 15= $30 text(/hr)`

`:.\ text(# Hours at double time)= 270/30= 9\ text(hrs)`

`=>  D`

Filed Under: Earning and Spending Money, Earning Money and Budgeting, Earning Money and Budgeting, FM1 - Earning money, Ways of Earning, Ways of Earning Tagged With: Band 3, num-title-ct-corea, num-title-qs-hsc, smc-1126-10-Wages, smc-4331-10-Wages, smc-6276-10-Wages/Salaries, smc-6515-10-Wages/Salaries, smc-810-10-Wages

Financial Maths, STD2 F1 2008 HSC 6 MC

Using the tax table, what is the tax payable on $43 561?

  1. $5424.40
  2. $10 824.40
  3. $16 224.40
  4. $17 424.40
Show Answers Only

`B`

Show Worked Solution

`text(Tax Payable)`

`= 5400 + 0.4 (43\ 561-30\ 000)`

`= 5400 + 5424.40= $10\ 824.40`

`=>  B`

Filed Under: FM3 - Taxation, Tax and Percentage Increase/Decrease, Tax and Percentage Increase/Decrease, Taxation, Taxation Tagged With: Band 3, smc-1125-10-Tax Tables, smc-6277-10-Tax Tables, smc-6516-10-Tax Tables, smc-831-10-Tax Tables

Algebra, 2UG 2008 HSC 1 MC

Which expression is equivalent to  `12k^3 ÷ 4k`?

  1. `3k^2 `
  2. `3k^3`
  3. `8k^2`
  4. `8k^3`
Show Answers Only

`A`

Show Worked Solution
`12k^3 -: 4k` `=(12k^3)/(4k)`  
  `=3k^2`  

 
`=>  A`

Filed Under: Index and Log Laws, Indices Tagged With: Band 3, num-title-ct-pathb, num-title-qs-hsc, smc-4228-10-Positive integers

Quadratic, 2UA 2008 HSC 4c

Consider the parabola  `x^2 = 8(y\ – 3)`.

  1. Write down the coordinates of the vertex.  (1 mark)
  2. Find the coordinates of the focus.   (1 mark)
  3. Sketch the parabola.   (1 mark)
  4. Calculate the area bounded by the parabola and the line  `y = 5`.   (3 marks)
Show Answers Only

(i)   `(0,3)`

(ii)   `(0,5)`

(iii)  

(iv)  `10 2/3\ text(u²)`

Show Worked Solution
(i)    `text(Vertex)\ = (0,3)`


(ii)   `text(Using)\ \ \ x^2` `= 4ay`
  `4a` `= 8`
  `a` `= 2`

`:.\ text(Focus) = (0,5)`


(iii) 2UA HSC 2008 4c 


(iv)   `text(Intersection when)\ y = 5`
`=> x^2` `= 8 (5-3)`
`x^2` `= 16`
`x` `= +- 4`

`text(Find shaded area)`

`x^2` `= 8 (y-3)`
`y – 3` `= x^2/8`
`y` `= x^2/8 +3`


`text(Area)` `= int_-4^4 5\ dx – int_-4^4 x^2/8 + 3\ dx`
  `= int_-4^4 5 – (x^2/8 + 3)\ dx`
  `= int_-4^4 2 – x^2/8\ dx`
  `= [2x – x^3/24]_-4^4`
  `= [(8 – 64/24) – (-8 + 64/24)]`
  `= 5 1/3 – (- 5 1/3)`
  `= 10 2/3\ text(u²)`

Filed Under: Areas Under Curves, The Parabola Tagged With: Band 3, Band 4, Band 5

Calculus, 2ADV C2 2008 HSC 2aiii

Differentiate with respect to  `x`:

`sinx/(x+4)`.   (2 marks) 

Show Answers Only

`(cosx (x+4) – sin x)/((x + 4)^2)`

Show Worked Solution

`y = sinx/(x + 4)`

`u` `= sinx` `\ \ \ \ \ u’` `= cos x`
`v` `= x + 4` `v’` `= 1`
`dy/dx` `= (u’v – uv’)/v^2`
  `= (cos x (x + 4) – sin x)/(x+4)^2`

Filed Under: Differentiation and Integration, Trig Differentiation, Trig Differentiation Tagged With: Band 3, smc-968-10-Sin, smc-968-50-Quotient Rule

Calculus, 2ADV C2 2008 HSC 2aii

Differentiate with respect to  `x`:

`x^2 log_e x`   (2 marks)

Show Answers Only

`x + 2x log_e x`

Show Worked Solution
`y` `= x^2 log_e x`
`dy/dx` `= x^2 * 1/x + 2x * log_e x`
  `= x + 2x log_e x`

Filed Under: L&E Differentiation (Y12), Log Calculus, Log Calculus (Y12), Logs and Exponentials - Differentiation Tagged With: Band 3, smc-964-10-Differentiation, smc-967-20-Logs, smc-967-30-Product Rule

Differentiation, 2UA 2008 HSC 2ai

Differentiate with respect to  `x`:

`(x^2 + 3)^9`   (2 marks)

Show Answers Only

`18x (x^2 + 3)^8`

Show Worked Solution
`y` `= (x^2 + 3)^9`
`dy/dx` `= 9 (x^2 + 3)^8 2x`
  `= 18x (x^2 + 3)^8`

Filed Under: 8. Differentiation and 1st Principles EXT1 Tagged With: Band 3

Calculus, 2ADV C4 2008 HSC 3b

  1. Differentiate  `log_e (cos x)`  with respect to  `x`.  (2 marks)

    --- 4 WORK AREA LINES (style=lined) ---

  2. Hence, or otherwise, evaluate  `int_0^(pi/4) tan x\ dx`.    (2 marks)

    --- 4 WORK AREA LINES (style=lined) ---

Show Answers Only
  1. `- tan x`
  2. `- log_e (1/sqrt2)\ \ text(or)\ \ 0.35\ \ text{(2 d.p.)}`
Show Worked Solution
i.    `y` `= log_e (cos x)`
  `dy/dx` `= (- sin x)/(cos x)`
    `= – tan x`


ii.    `int_0^(pi/4) tan x\ dx`
  `= – [log_e (cos x)]_0^(pi/4)`
  `= – [log_e(cos (pi/4)) – log_e (cos 0)]`
  `= – [log_e (1/sqrt2) – log_e 1]`
  `= – [log_e (1/sqrt2) – 0]`
  `= – log_e (1/sqrt2)`
  `= 0.346…`
  `= 0.35\ \ text{(2 d.p.)}`

Filed Under: Differentiation and Integration, Log Calculus, Log Calculus (Y12), Trig Integration Tagged With: Band 3, Band 4, smc-1204-50-Diff then Integrate, smc-964-10-Differentiation, smc-964-40-Trig overlap, smc-964-50-Diff then integrate

Linear Functions, 2UA 2008 HSC 3a

2008 3a

In the diagram,  `ABCD`  is a quadrilateral. The equation of the line  `AD`  is  `2x- y- 1 = 0`. 

  1. Show that  `ABCD`  is a trapezium by showing that  `BC`  is parallel to  `AD`.  (2 marks)
  2. The line  `CD`  is parallel to the  `x`-axis. Find the coordinates of  `D`.   (1 mark)
  3. Find the length of  `BC`.   (1 mark)
  4. Show that the perpendicular distance from  `B`  to  `AD`  is  `4/sqrt5`.   (2 marks)
  5. Hence, or otherwise, find the area of the trapezium  `ABCD`.   (2 marks)
Show Answers Only
  1. `text(Proof)\ \ text{(See Worked Solutions)}`
  2. `(3,5)`
  3. `sqrt 5\ text(units)`
  4. `text(Proof)\ \ text{(See Worked Solutions)}`
  5. `8\ text(u²)`
Show Worked Solution
(i)    `text(Show)\ BC \ text(||)\ AD`

`B(0,3),\ \ C(1,5)`

`m_(BC)` `= (y_2 – y_1)/(x_2 – x_1)`
  `= (5 – 3)/(1 – 0)`
  `= 2`


`text(Equation)\ \ AD\ \ text(is)\ \ 2x – y – 1 = 0`

`y` `= 2x – 1`
`m_(AD)` `= 2`

`:. BC\  text(||) \ AD`

`:. ABCD\ text(is a trapezium)`


(ii)    `text(Given)\ CD\  text(||) \ x text(-axis)`
  `text(Equation)\ CD\ text(is)\ y = 5`
  `D\ text(is intersection of)`
`y` `= 5,\ \ and`
`2x – y – 1` `= 0`
`:. 2x – 5 – 1` `=0`
`2x` `=6`
`x` `=3`
`:.\ D` `= (3,5)`


(iii)   `B(0,3),\ \ C(1,5)`
`text(dist)\ BC` `= sqrt ( (x_2 – x_1)^2 + (y_2 – y_1)^2 )`
  `= sqrt ( (1-0)^2 + (5-3)^2 )`
  `= sqrt (1 + 4)`
  `= sqrt 5\ text(units)`


(iv)   `text(Show)\ _|_\ text(dist of)\ B\ text(to)\ AD\ text(is)\ 4/sqrt5`

`B (0,3)\ \ \ \ \ 2x – y – 1 = 0` 

`_|_\ text(dist)` `= | (ax_1 + by_1 + c)/sqrt (a^2 + b^2) |`
  `= |( 2(0) – 1(3) -1 )/sqrt (2^2 + (-1)^2) |`
  `= | -4/sqrt5 |`
  `= 4/sqrt 5\ \ \ text(… as required.)`


(v)    `text(Area)` `= 1/2 h (a + b)`
    `= 1/2 xx 4/sqrt5 (BC + AD)`

 
`BC = sqrt5\ \ text{(part (iii))}`
 

`A(0,–1),\ \ D(3,5)`

`text(dist)\ AD` `= sqrt ( (3-0)^2 + (5+1)^2 )`
  `= sqrt (9 + 36)`
  `= sqrt 45`
  `= 3 sqrt 5`
`:.\ text(Area)\ ABCD` `= 1/2 xx 4/sqrt5 (sqrt5 + 3 sqrt 5)`
  `= 2 / sqrt5 (4 sqrt 5)`
  `= 8\ text(u²)`

Filed Under: 6. Linear Functions Tagged With: Band 3, Band 4, HSC

Linear Functions, 2UA 2008 HSC 2b

Let  `M`  be the midpoint of  `(-1, 4)`  and  `(5, 8)`.

Find the equation of the line through  `M`  with gradient  `-1/2`.   (2 marks)

--- 5 WORK AREA LINES (style=lined) ---

Show Answers Only

`x + 2y-14 = 0`

Show Worked Solution

`(-1,4)\ \ \ (5,8)`

`M` `= ( (x_1 + x_2)/2, (y_1 + y_2)/2)`
  `= ( (-1 + 5)/2, (4 + 8)/2)`
  `= (2, 6)`


`text(Equation through)\ (2,6)\ text(with)\ m = -1/2`

`y-y_1` `= m (x-x_1)`
`y-6` `= -1/2 (x-2)`
`2y-12` `= -x + 2`
`x + 2y-14` `= 0`

Filed Under: 6. Linear Functions, Cartesian Plane Tagged With: Band 3, num-title-ct-pathc, num-title-qs-hsc, smc-4422-10-Mid-point, smc-4422-30-Point-gradient

Financial Maths, 2ADV M1 2008 HSC 1f

Find the sum of the first 21 terms of the arithmetic series  3 + 7 + 11 + ...   (2 marks)

--- 5 WORK AREA LINES (style=lined) ---

Show Answers Only

`903`

Show Worked Solution
`S` `= 3 + 7 + 11 + …`
`a` `= 3`
`d` `= 7 – 3 = 4`


`:. S_21` `= n/2 [2a + (n – 1) d]`
  `= 21/2 [2 xx 3 + (21 – 1)4]`
  `= 21/2 [6 + 80]`
  `= 903`

Filed Under: Arithmetic Series, Arithmetic Series Tagged With: Band 3, smc-1005-20-Find Sum, smc-1005-60-Calculations Only

Functions, 2ADV F1 2008 HSC 1e

Expand and simplify  `(sqrt3-1)(2 sqrt3 + 5)`.   (2 marks)

Show Answers Only

`1 + 3 sqrt 3`

Show Worked Solution

`(sqrt 3-1)(2 sqrt 3 + 5)`

`= 2 xx 3 + 5 sqrt 3-2 sqrt 3-5`

`= 1 + 3 sqrt 3`

Filed Under: Algebraic Techniques, Algebraic Techniques, Indices, Surds and Rounding Tagged With: Band 3, num-title-ct-pathc, num-title-qs-hsc, smc-4228-70-Surds, smc-6213-20-Surds (general), smc-983-20-Surds (General), syllabus-2027

Functions, 2ADV F1 2008 HSC 1d

Solve  `| 4x-3 | = 7`.   (2 marks)

--- 5 WORK AREA LINES (style=lined) ---

Show Answers Only

`x = 5/2\ \ text(or)\ x = -1`

Show Worked Solution

`| 4x-3 | = 7`

`4x-3` `= 7` `\ \ \ \ \ -(4x-3)` `= 7`
`4x` `= 10` `-4x + 3` `= 7`
`x` `= 5/2` `-4x` `= 4`
    `x` `= -1`


`:. x=5/2\ \ text(or)\ \ -1`

Filed Under: Further Functions and Relations, Inequalities and Absolute Values, Other Functions and Relations Tagged With: Band 3, smc-6218-10-Absolute Value, smc-987-10-Absolute Value

Functions, 2ADV F1 2008 HSC 1a

Evaluate  `2 cos (pi/5)`  correct to three significant figures.   (2 marks)

Show Answers Only

`1.62\ text{(3 sig)}`

Show Worked Solution
`2 cos (pi/5)` `= 1.6180…`
  `= 1.62\ text{(3 sig)}`

Filed Under: Algebraic Techniques, Algebraic Techniques, Surds and Rounding Tagged With: Band 3, smc-6213-60-Rounding, smc-983-10-Rounding

  • « Previous Page
  • 1
  • …
  • 54
  • 55
  • 56
  • 57
  • 58
  • 59
  • Next Page »

Copyright © 2014–2026 SmarterEd.com.au · Log in