SmarterEd

Aussie Maths & Science Teachers: Save your time with SmarterEd

  • Login
  • Get Help
  • About

PHYSICS, M7 2024 HSC 27

The simplified model below shows the reactants and products of a proton-antiproton reaction which produces three particles called pions, each having a different charge.

\(\text{p}+\overline{\text{p}} \rightarrow \pi^{+}+\pi^0+\pi^{-}\)

There are no other products in this process, which involves only the rearrangement of quarks. No electromagnetic radiation is produced. Assume that the initial kinetic energy of the proton and antiproton is negligible.

Protons consist of two up quarks \(\text{(u)}\) and a down quark \(\text{(d)}\) . Antiprotons consist of two up antiquarks \((\overline{\text{u}})\) and a down antiquark \((\overline{\text{d}})\). Each of the pions consists of two quarks.

The following tables provide information about hadrons and quarks.

Table 1: Hadron Information

\begin{array} {|l|c|c|}
\hline
\rule{0pt}{2.5ex} \quad \quad \ \ \textit{Particle} & \ \ \textit{Rest mass} \ \ & \quad \textit{Charge} \quad \\
& \left(\text{MeV/c}^2\right)&\\
\hline
\rule{0pt}{2.5ex} \text {proton (p)} \rule[-1ex]{0pt}{0pt} & 940 &  +1 \\
\hline
\rule{0pt}{2.5ex} \text {antiproton}(\overline{\text{p}}) \rule[-1ex]{0pt}{0pt} & 940 & -1  \\
\hline
\rule{0pt}{2.5ex} \text {neutral pion }\left(\pi^0\right) \rule[-1ex]{0pt}{0pt} & 140 & \text{zero} \\
\hline
\rule{0pt}{2.5ex} \text{positive pion }\left(\pi^{+}\right) \rule[-1ex]{0pt}{0pt} & 140 & +1 \\
\hline
\rule{0pt}{2.5ex}\text {negative pion }\left(\pi^{-}\right) \rule[-1ex]{0pt}{0pt} & 140 &  -1\\
\hline
\end{array}

 
Table 2: Quark charges

\begin{array} {|l|c|}
\hline
\rule{0pt}{2.5ex} \quad \quad \ \ \textit{Particle} \rule[-1ex]{0pt}{0pt} & \quad \textit{Charge} \quad \\
\hline
\rule{0pt}{2.5ex} \text {down quark (d)} \rule[-1ex]{0pt}{0pt} & -\dfrac{1}{3}  \\
\hline
\rule{0pt}{2.5ex} \text {up quark (u)} \rule[-1ex]{0pt}{0pt} & +\dfrac{2}{3}\\
\hline
\rule{0pt}{2.5ex} \text {down antiquark}(\overline{\text{d}}) \rule[-1ex]{0pt}{0pt} & +\dfrac{1}{3}\\
\hline
\rule{0pt}{2.5ex} \text{up antiquark }(\overline{\text{u}}) \rule[-1ex]{0pt}{0pt} & -\dfrac{2}{3}  \\
\hline
\end{array}

  1. Identify the quarks present in the \(\pi^{-}, \pi^{+}\)and the \(\pi^0\) particles.   (2 marks)

    --- 4 WORK AREA LINES (style=lined) ---

  2. The energy released in the reaction is shared equally between the pions.
  3. Calculate the energy released per pion in this reaction.   (2 marks)

    --- 4 WORK AREA LINES (style=lined) ---

  4. Calculation of the pions' velocities using classical physics predicts that each pion has a velocity, relative to the point at which the proton-antiproton reaction occurred, which exceeds 3 × 10\(^8\) m s\(^{-1}\).
  5. Explain the problem with this prediction and how it can be resolved.   (3 marks)

    --- 6 WORK AREA LINES (style=lined) ---

Show Answers Only

a.   \(\pi^{-}:\ \overline{\text{u}}\text{d}\)

\(\pi^{+}:\ \text{u}\overline{\text{d}}\)

\(\pi^{0}:\ \text{u}\overline{\text{d}}\)
 

b.   \(\text{Initial mass}\ = 940 + 940 =  1880\ \text{MeV/c}^{2} \)

\(\text{Final mass}\ = 3 \times 140 = 420\ \text{MeV/c}^{2} \)

\(\Delta \text{Mass (per pion)}\ = \dfrac{1460}{3} = 487\ \text{MeV/c}^{2} \)

\(\text{Using}\ \ E=mc^2:\)

\(\text{Energy released (per pion)}\ = 487\ \text{MeV}\)
 

c.   Problem with prediction:

  • The calculation shows the pions moving faster than light speed (3 × 10\(^{8}\) m/s), which can’t happen in reality.

Resolving the problem:

  • Since these pions are moving at extremely high speeds, we need to account for relativity.
  • Relativity means that pions’ mass actually increases as they get faster, which prevents them from ever reaching light speed.
  • Part of the energy given to the pions goes into increasing their mass rather than just increasing their velocity.

Show Worked Solution

a.   \(\pi^{-}:\ \overline{\text{u}}\text{d}\)

\(\pi^{+}:\ \text{u}\overline{\text{d}}\)

\(\pi^{0}:\ \text{u}\overline{\text{d}}\)
 

b.   \(\text{Initial mass}\ = 940 + 940 =  1880\ \text{MeV/c}^{2} \)

\(\text{Final mass}\ = 3 \times 140 = 420\ \text{MeV/c}^{2} \)

\(\Delta \text{Mass (per pion)}\ = \dfrac{1460}{3} = 487\ \text{MeV/c}^{2} \)

\(\text{Using}\ \ E=mc^2:\)

\(\text{Energy released (per pion)}\ = 487\ \text{MeV}\)
 

♦ Mean mark (b) 41%.

c.   Problem with prediction:

  • The calculation shows the pions moving faster than light speed (3 × 10\(^{8}\) m/s), which can’t happen in reality.

Resolving the problem:

  • Since these pions are moving at extremely high speeds, we need to account for relativity.
  • Relativity means that pions’ mass actually increases as they get faster, which prevents them from ever reaching light speed.
  • Part of the energy given to the pions goes into increasing their mass rather than just increasing their velocity.
♦ Mean mark (c) 43%.

Filed Under: Deep Inside the Atom, Light and Special Relativity Tagged With: Band 4, Band 5, smc-3699-30-Momentum Dilation and calcs, smc-3704-20-Quarks, smc-3704-30-Nuclear Transformation

Calculus, MET1 2024 VCAA 8

Let  \(g: R \rightarrow R, \ g(x)=\sqrt[3]{x-k}+m\),  where  \(k \in R \backslash\{0\}\)  and  \(m \in R\).

Let the point \(P\) be the \(y\)-intercept of the graph of  \(y=g(x)\).

  1. Find the coordinates of \(P\), in terms of \(k\) and \(m\).   (1 mark)

    --- 2 WORK AREA LINES (style=lined) ---

  2. Find the gradient of \(g\) at \(P\), in terms of \(k\).   (2 marks)

    --- 4 WORK AREA LINES (style=lined) ---

  3. Given that the graph of  \(y=g(x)\)  passes through the origin, express \(k\) in terms of \(m\).   (1 mark)

    --- 3 WORK AREA LINES (style=lined) ---

  4. Let the point \(Q\) be a point different from the point \(P\), such that the gradient of \(g\) at points \(P\) and \(Q\) are equal.
  5. Given that the graph of  \(y=g(x)\)  passes through the origin, find the coordinates of \(Q\) in terms of \(m\).   (3 marks)

    --- 7 WORK AREA LINES (style=lined) ---

Show Answers Only

a.    \(\bigg(0, -\sqrt[3]{k}+m\bigg)\)

b.    \(\dfrac{1}{3}(-k)^{-\frac{2}{3}}\)

c.    \(k=m^3\)

d.    \(Q(2m^3,2m)\)

Show Worked Solution

a.   \(g(0)=\sqrt[3]{0-k}+m=-\sqrt[3]{k}+m\)

\(P(0, -\sqrt[3]{k}+m)\)
 

b.   \(g(x)=\sqrt[3]{x-k}+m=(x-k)^{\frac{1}{3}}+m\)

  \(g^{\prime}(x)\) \(=\dfrac{1}{3}(x-k)^{-\frac{2}{3}}\)
  \(g^{\prime}(0)\) \(=\dfrac{1}{3}(0-k)^{-\frac{2}{3}}=\dfrac{1}{3}(-k)^{-\frac{2}{3}} =\dfrac{1}{3}(k)^{-\frac{2}{3}}\)
♦ Mean mark (b) 39%.
c.     \(\text{When }y=0:\)
     \(-\sqrt[3]{k}+m\) \(=0\)  
  \(\sqrt[3]{k}\) \(=m\)  
  \(k\) \(=m^3\)  
♦ Mean mark (c) 47%.
d.     \(g^{\prime}(x)\) \(=g^{\prime}(0)\)
  \(\dfrac{1}{3}(x-k)^{-\frac{2}{3}}\) \(=\dfrac{1}{3(-k)^{\frac{2}{3}}}\)
  \(\dfrac{1}{(x-k)^{\frac{2}{3}}}\) \(=\dfrac{1}{k^{\frac{2}{3}}}\)
  \((x-k)^{\frac{2}{3}}\) \(=k^{\frac{2}{3}}\)
  \((x-k)^2\) \(=k^2\)
  \(x-k\) \(=\pm k\)
  \(x\) \(=0, \ 2k\)
♦♦♦ Mean mark (d) 15%.

\(\text{When }x=2k:\)

\(y=(2k-k)^{\frac{1}{3}}+m=k^{\frac{1}{3}}+m=2m\ \text{(from (c))}\)

\(\therefore\ \text{Coordinates of are}\ Q(2k, 2m)\Rightarrow\ Q(2m^3,2m)\)

Filed Under: Tangents and Normals Tagged With: Band 4, Band 5, Band 6, smc-634-70-Find point of tangency

Calculus, MET1 2024 VCAA 7

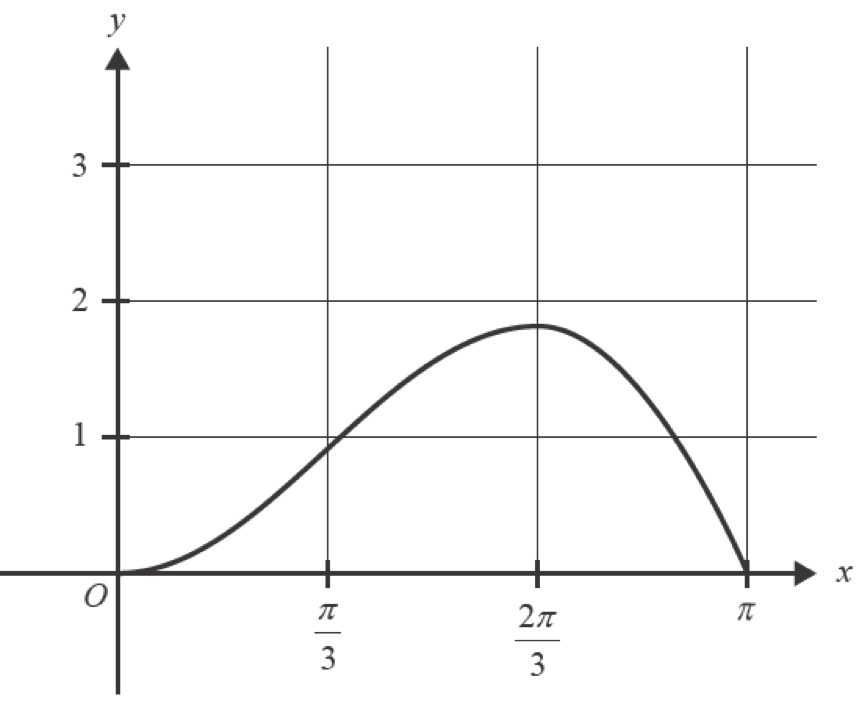
Part of the graph of  \(f:[-\pi, \pi] \rightarrow R, f(x)=x \sin (x)\)  is shown below.

  1. Use the trapezium rule with a step size of \(\dfrac{\pi}{3}\) to determine an approximation of the total area between the graph of  \(y=f(x)\) and the \(x\)-axis over the interval  \(x \in[0, \pi]\).   (3 marks)

    --- 8 WORK AREA LINES (style=lined) ---

  2.   i. Find \(f^{\prime}(x)\).   (1 mark)

    --- 3 WORK AREA LINES (style=lined) ---

  3.  ii. Determine the range of \(f^{\prime}(x)\) over the interval \(\left[\dfrac{\pi}{2}, \dfrac{2 \pi}{3}\right]\).   (1 mark)

    --- 3 WORK AREA LINES (style=lined) ---

  4. iii. Hence, verify that \(f(x)\) has a stationary point for \(x \in\left[\dfrac{\pi}{2}, \dfrac{2 \pi}{3}\right]\).   (1 mark)

    --- 3 WORK AREA LINES (style=lined) ---

  5. On the set of axes below, sketch the graph of  \(y=f^{\prime}(x)\)  on the domain \([-\pi, \pi]\), labelling the endpoints with their coordinates.
  6. You may use the fact that the graph of  \(y=f^{\prime}(x)\)  has a local minimum at approximately \((-1.1,-1.4)\) and a local maximum at approximately \((1.1,1.4)\).   (3 marks)

    --- 0 WORK AREA LINES (style=lined) ---

Show Answers Only

a.    \(\dfrac{\sqrt{3}\pi^2}{6}\)

bi.   \(x\cos(x)+\sin(x)\)

bii.  \(\left[-\dfrac{\pi}{3}+\dfrac{\sqrt{3}}{3},\ 1\right]\)

biii. \(\text{In the interval }\left[\dfrac{\pi}{2}, \dfrac{2\pi}{3}\right],\ f^{\prime}(x)\ \text{changes from positive to negative.}\)

\(f^{\prime}(x)=0\ \text{at some point in the interval.}\)

\(\therefore\ \text{A stationary point must exist in the given range.}\)

c. 

Show Worked Solution

a.     \(A\) \(=\dfrac{\pi}{3}\times\dfrac{1}{2}\left(f(0)+2f\left(\dfrac{\pi}{3}\right)+2f\left(\dfrac{2\pi}{3}\right)+f(\pi)\right)\)
    \(=\dfrac{\pi}{6}\left(0+2\times \dfrac{\pi}{3}\sin\left(\dfrac{\pi}{3}\right)+2\times \dfrac{2\pi}{3}\sin\left(\dfrac{2\pi}{3}\right)+\pi\sin({\pi})\right)\)
    \(=\dfrac{\pi}{6}\left(2\times \dfrac{\pi}{3}\times\dfrac{\sqrt{3}}{2}+2\times\dfrac{2\pi}{3}\times \dfrac{\sqrt{3}}{2}+0\right)\)
    \(=\dfrac{\pi}{6}\left(\dfrac{2\pi\sqrt{3}}{6}+\dfrac{4\pi\sqrt{3}}{6}\right)\)
    \(=\dfrac{\pi}{6}\times \dfrac{6\pi\sqrt{3}}{6}\)
    \(=\dfrac{\sqrt{3}\pi^2}{6}\)
♦ Mean mark (a) 48%.
bi.    \(f(x)\) \(=x\sin(x)\)
  \(f^{\prime}(x)\) \(=x\cos(x)+\sin(x)\)


b.ii.  \(\text{Gradient in given range gradually decreases.}\)

\(\text{Range of}\ f^{\prime}(x)\ \text{will be defined by the endpoints.}\)

  \(f^{\prime}\left(\dfrac{\pi}{2}\right)\) \(=1\)
  \(f^{\prime}\left(\dfrac{2\pi}{3}\right)\) \(=\dfrac{2\pi}{3}\left(\dfrac{-1}{2}+\dfrac{\sqrt{3}}{2}\right)=-\dfrac{\pi}{3}+\dfrac{\sqrt{3}}{3}\)

 
\(\therefore\ \text{Range of }\ f^{\prime} (x)\ \text{is}\quad\left[-\dfrac{\pi}{3}+\dfrac{\sqrt{3}}{3},\ 1\right]\)

♦♦♦ Mean mark (b.ii.) 20%.
♦♦♦ Mean mark (b.iii.) 12%.

 
biii. \(\text{In the interval }\left[\dfrac{\pi}{2}, \dfrac{2\pi}{3}\right],\ f^{\prime}(x)\ \text{changes from positive to negative.}\)

\(f^{\prime}(x)=0\ \text{at some point in the interval.}\)

\(\therefore\ \text{A stationary point must exist in the given range.}\)

 
c.   
\(f^{\prime}(\pi)=\pi\cos(\pi)+\sin(\pi)=-\pi\)

\(f^{\prime}(-\pi)=-\pi\cos(-\pi)+\sin(-\pi)=\pi\)

\(\therefore\ \text{Endpoints are }\ (-\pi,\ \pi)\ \text{and}\ (\pi,\ -\pi).\)

♦♦ Mean mark (c) 36%.

Filed Under: Curve Sketching, The Derivative Function and its Graph, Trapezium Rule and Newton Tagged With: Band 4, Band 5, Band 6, smc-2830-20-Find f'(x) graph given f(x), smc-2830-50-SP problems, smc-5145-04-Trapezium rule, smc-5145-20-No table, smc-724-45-Other graphs, smc-744-40-Product Rule

Functions, MET1 2024 VCAA 5

The function  \(h:[0, \infty) \rightarrow R, \ h(t)=\dfrac{3000}{t+1}\)  models the population of a town after \(t\) years.

  1. Use the model \(h(t)\) to predict the population of the town after four years.   (1 mark)

    --- 2 WORK AREA LINES (style=lined) ---

  2. A new function, \(h_1\), models a population where  \(h_1(0)=h(0)\) but \(h_1\) decreases at half the rate of \(h\) at any point in time.
  3. State a sequence of two transformations that maps \(h\) to this new model \(h_1\).   (2 marks)

    --- 6 WORK AREA LINES (style=lined) ---

  4. In the town, 100 people were randomly selected and surveyed, with 60 people indicating that they were unhappy with the roads.
    1. Determine an approximate 95% confidence interval for the proportion of people in the town who are unhappy with the roads.
    2. Use  \(z=2\)  for this confidence interval.   (2 marks)

      --- 6 WORK AREA LINES (style=lined) ---

    3. A new sample of \(n\) people results in the same sample proportion.
    4. Find the smallest value of \(n\) to achieve a standard deviation of  \(\dfrac{\sqrt{2}}{50}\)  for the sample proportion.   (1 mark)

      --- 4 WORK AREA LINES (style=lined) ---

Show Answers Only

a.    \(600\)

b.   \(\text{Transformations:}\)

\(\text{1- Vertical dilation by a factor of }\frac{1}{2}\ \text{from the }t\ \text{axis}\)

\(\text{2- Translation of 1500 units upwards}\)

ci.   \(\left(\dfrac{3}{5}-\dfrac{\sqrt{6}}{25},\ \dfrac{3}{5}+\dfrac{\sqrt{6}}{25}\right)\)

cii.  \(300\)

Show Worked Solution

a.  \(h(4)=\dfrac{3000}{4+1}=600\)

b.     \(h(t)\) \(=3000(t+1)^{-1}\)
  \(h^{\prime}(t)\) \(=-\dfrac{3000}{(t+1)^2}\)
  \(h_1^{\prime}(t)\) \(=\dfrac{1}{2}h^{\prime}(t)=-\dfrac{1500}{(t+1)^2}\)
  \(h_1(t)\) \(=\dfrac{1500}{t+1}+C\)

♦♦♦ Mean mark (a) 17%.

\(\text{Given}\ \ h(0)=h_1(0):\)

\(\dfrac{1500}{0+1} +C= 3000\ \ \Rightarrow\ \ C=1500\)

\(h_1(t)=\dfrac{1500}{t+1}+1500\)
 

\(\text{Transformations:}\)

\(\text{1- Vertical dilation by a factor of }\frac{1}{2}\ \text{from the }t\ \text{axis}\)

\(\text{2- Translation of 1500 units upwards}\)
 

ci.    \(\hat{p}=\dfrac{60}{100}=\dfrac{3}{5},\quad 1-\hat{p}=\dfrac{2}{5},\quad z=2\)

\(\text{Approx CI}\) \(=\left(\dfrac{3}{5}-2\sqrt{\dfrac{\dfrac{3}{5}\times\dfrac{2}{5}}{100}},\ \dfrac{3}{5}+2\sqrt{\dfrac{\dfrac{3}{5}\times\dfrac{2}{5}}{100}}\right)\)
  \(=\left(\dfrac{3}{5}-\dfrac{2\sqrt{6}}{50},\quad \dfrac{3}{5}+\dfrac{2\sqrt{6}}{50}\right)\)
  \(=\left(\dfrac{3}{5}-\dfrac{\sqrt{6}}{25},\quad \dfrac{3}{5}+\dfrac{\sqrt{6}}{25}\right)\)


cii.   \(\sqrt{\dfrac{\hat{p}(1-\hat{p})}{n}}\) \(=\dfrac{\sqrt{2}}{50}\)
  \(\sqrt{\dfrac{\dfrac{3}{5}\times\dfrac{2}{5}}{n}}\) \(=\dfrac{\sqrt{2}}{50}\)
  \(\dfrac{6}{25n}\) \(=\dfrac{2}{2500}\)
  \(\dfrac{25n}{6}\) \(=1250\)
  \(n\) \(=\dfrac{6}{25}\times 1250\)
    \(=300\)
♦♦ Mean mark (c.ii.) 33%.

Filed Under: Normal Distribution, Transformations Tagged With: Band 2, Band 4, Band 5, Band 6, smc-719-20-95% confidence intervals, smc-719-40-Find sample size, smc-753-40-Combinations, smc-753-85-Other functions

Probability, MET1 2024 VCAA 4

Let \(X\) be a binomial random variable where  \(X \sim \operatorname{Bi}\left(4, \dfrac{9}{10}\right)\).

  1. Find the standard deviation of \(X\).   (1 mark)

    --- 4 WORK AREA LINES (style=lined) ---

  2. Find  \(\operatorname{Pr}(X<2)\).   (2 marks)

    --- 8 WORK AREA LINES (style=lined) ---

Show Answers Only

a.    \(\operatorname{sd}(X)=\dfrac{3}{5}\)

b.    \(\dfrac{37}{10\,000}\)

Show Worked Solution

a.     \(\operatorname{sd}(X)\) \(=\sqrt{np(1-p)}\)
    \(=\sqrt{4\times\dfrac{9}{10}\times\dfrac{1}{10}}\)
    \(=\sqrt{\dfrac{36}{100}}\)
    \(=\dfrac{3}{5}\)


b.     \(\operatorname{Pr}(X<2)\) \(=\operatorname{Pr}(X=0)+\operatorname{Pr}(X=1)\)
    \(=\ ^4C _0\left(\dfrac{9}{10}\right)^0\left(\dfrac{1}{10}\right)^4+\ ^4C_1\left(\dfrac{9}{10}\right)^1\left(\dfrac{1}{10}\right)^3\)
    \(= 1 \times \dfrac {1}{10\,000} + 4 \times \dfrac{9}{10} \times \dfrac{1}{1000}\)
    \(=\dfrac{37}{10\,000}\)
Mean mark (b) 51%.

Filed Under: Binomial Tagged With: Band 4, Band 5, smc-638-10-binomial expansion (non-calc), smc-638-32-Find E(X)/var(X) given n p

Calculus, MET1 2024 VCAA 3

Let  \(g: R \backslash\{-3\} \rightarrow R, \ g(x)=\dfrac{1}{(x+3)^2}-2\).

  1. On the axes below, sketch the graph of  \(y=g(x)\),  labelling all asymptotes with their equations and axis intercepts with their coordinates.   (3 marks)

    --- 0 WORK AREA LINES (style=lined) ---


  2. Determine the area of the region bounded by the line  \(x=-2\),  the \(x\)-axis, the \(y\)-axis and the graph of \(y=g(x)\).   (2 marks)

    --- 6 WORK AREA LINES (style=lined) ---

Show Answers Only

a.

b.    \(\dfrac{10}{3}\ \text{sq units}\)

Show Worked Solution

a.    \(y\text{-intercept:}\ x=0\)

\(y=\dfrac{1}{(0+3)^2}-2=-\dfrac{17}{9}\)

\(x\text{-intercepts:}\ y=0\)

\(\dfrac{1}{(x+3)^2}-2\) \(=0\)
\((x+3)^2\) \(=\dfrac{1}{2}\)
\(x+3\) \(=\pm\dfrac{1}{\sqrt{2}}\)
\(x\) \(=-3\pm\dfrac{1}{\sqrt{2}}\)

b.   \(\text{Area is below}\ x\text{-axis:}\)

  \(\text{Area}\) \(=-\displaystyle\int_{-2}^0 (x+3)^{-3}-2\,dx\)
    \(=-\left[\dfrac{1}{-1}(x+3)^{-1}-2x\right]_{-2}^0\)
    \(=-\left[\dfrac{-1}{x+3}-2x\right]_{-2}^0\)
    \(=-\left[\dfrac{-1}{3}-\left(\dfrac{-1}{-2+3}-2(-2)\right)\right]\)
    \(=-\Big[\dfrac{-1}{3}-(-1+4)\Big] \)
    \(=\dfrac{10}{3}\ \text{u}^{2}\)
♦ Mean mark (b) 40%.

Filed Under: Area Under Curves, Quotient and Other Graphs Tagged With: Band 4, Band 5, smc-723-40-Hyperbola/Quotient, smc-757-10-Quotient function, smc-757-30-Find asymptote(s), smc-757-50-Sketch graph

Functions, MET1 2024 VCAA 2

Consider the simultaneous linear equations

\(\begin{aligned} 3 k x-2 y & =k+4 \\ (k-4) x+k y & =-k\end{aligned}\)

where  \(x, y \in R\) and \(k\) is a real constant.

Determine the value of \(k\) for which the system of equations has no real solution.   (3 marks)

--- 13 WORK AREA LINES (style=lined) ---

Show Answers Only

\(k=\dfrac{4}{3}\)

Show Worked Solution

\(\text{For no solutions lines must be parallel }(m_1=m_2)\)

\(\text{and y-intercepts not equal}\ (c_1\neq c_2).\)

\(3kx-2y=k+4\ \ \Rightarrow \ \ y=\dfrac{3k}{2}x-\dfrac{(k+4)}{2}\)

\(m_1=\dfrac{3k}{2},\ c_1=-\dfrac{(k+4)}{2}\)

\((k-4)x+ky-k\ \ \Rightarrow\ \ y=-\dfrac{(k-4)}{k}x-1\)

\(m_2=-\dfrac{(k-4)}{k},\ c_2=-1\)

Mean mark 56%.

\(\text{Equating gradients:}\)

\(\dfrac{3k}{2}\) \(=-\dfrac{(k-4)}{k}\)
\(3k^2\) \(=-2(k-4)\)
\(3k^2\) \(=-2k+8\)
\(3k^2+2k-8\) \(=0\)
\((3k-4)(k+2)\) \(=0\)

\(k=\dfrac{4}{3},\ k=-2\)
 

\(\text{Substituting to test }y-\text{intercepts:}\)

\(\text{Case 1:}\ \ k=-2\quad\)

\(c_1=-\dfrac{(k+4)}{2}=-\dfrac{(-2+4)}{2}=-1 = c_2\ \ \text{(no solution)}\)

\(\text{Case 2:}\ \ k= \dfrac{4}{3}\)

\(c_1=-\dfrac{(k+4)}{2}==-\dfrac{\Big(\dfrac{4}{3}+4\Big)}{2}=-\dfrac{8}{3} \neq c_2\)

\(\therefore \text{There is no real solution when}\ \ k=\dfrac{4}{3}\)

Filed Under: Simultaneous Equations Tagged With: Band 4, smc-721-30-No solutions

Calculus, MET1 2024 VCAA 1b

Let  \(f(x)=\log _e\left(x^3-3 x+2\right)\).

Find  \(f^{\prime}(3)\)   (2 marks)

--- 6 WORK AREA LINES (style=lined) ---

Show Answers Only

\(\dfrac{6}{5}\)

Show Worked Solution

  \(f(x)\) \(=\log_{e}(x^3-3x+2)\)
  \(f^{\prime}(x)\) \(=\dfrac{3x^2-3}{x^3-3x+2}\)
  \(f^{\prime}(3)\) \(=\dfrac{3(3)^2-3}{(3)^3-3(3)+2}=\dfrac{6}{5}\)

Filed Under: L&E Differentiation Tagged With: Band 4, smc-745-20-Logs

Calculus, MET2 2024 VCAA 3

The points shown on the chart below represent monthly online sales in Australia.

The variable \(y\) represents sales in millions of dollars.

The variable \(t\) represents the month when the sales were made, where \(t=1\) corresponds to January 2021, \(t=2\) corresponds to February 2021 and so on.

  1. A cubic polynomial \(p ;(0,12] \rightarrow R, p(t)=a t^3+b t^2+c t+d\) can be used to model monthly online sales in 2021.

    The graph of \(y=p(f)\) is shown as a dashed curve on the set of axes above.

    It has a local minimum at (2,2500) and a local maximum at (11,4400).

     i. Find, correct to two decimal places, the values of \(a, b, c\) and \(d\).   (3 mark)

    --- 5 WORK AREA LINES (style=lined) ---

    ii. Let \(q:(12,24] \rightarrow R, q(t)=p(t-h)+k\) be a cubic function obtained by translating \(p\), which can be used to model monthly online sales in 2022.

    Find the values of \(h\) and \(k\) such that the graph of \(y=q(t)\) has a local maximum at \((23,4750)\).   (2 marks)

    --- 5 WORK AREA LINES (style=lined) ---

  2. Another function \(f\) can be used to model monthly online sales, where
     
    \(f:(0,36] \rightarrow R, f(t)=3000+30 t+700 \cos \left(\dfrac{\pi t}{6}\right)+400 \cos \left(\dfrac{\pi t}{3}\right)\)

    Part of the graph of \(f\) is shown on the axes below.

    1. Complete the graph of \(f\) on the set of axes above until December 2023, that is, for \(t \in(24,36]\).Label the endpoint at \(t=36\) with its coordinates.   (2 marks)

      --- 0 WORK AREA LINES (style=lined) ---

    1. The function \(f\) predicts that every 12 months, monthly online sales increase by \(n\) million dollars.

      Find the value of \(n\).   (1 mark)

      --- 3 WORK AREA LINES (style=lined) ---

    1. Find the derivative \(f^{\prime}(t)\).   (1 mark)

      --- 3 WORK AREA LINES (style=lined) ---

    1. Hence, find the maximum instantaneous rate of change for the function \(f\), correct to the nearest million dollars per month, and the values of \(t\) in the interval \((0,36]\) when this maximum rate occurs, correct to one decimal place.   (2 marks)

      --- 4 WORK AREA LINES (style=lined) ---

Show Answers Only

ai.   \(a\approx -5.21, b\approx 101.65, c\approx -344.03, d\approx 2823.18\)

aii.  \(h=12, k=350\)

bi.  

bii.  \( n=360\)

biii. \(f^{\prime}(t)=30-\dfrac{350\pi}{3}\sin\left(\dfrac{\pi t}{6}\right)-\dfrac{400\pi}{3}\sin\left(\dfrac{\pi t}{3}\right)\)

biv. \(\text{Maximum rate occurs at }t=10.2, 22.2, 34.2\)

\(\text{Maximum rate}\ \approx 725\ \text{million/month}\)

Show Worked Solution
ai.   \(\text{Given}\ p(2)=2500, p(11)=4400, p^{\prime}(2)=0\ \text{and}\ p^{\prime}(11)=0\) 
  
\(p(t)=at^3+bt^2+ct+d\ \Rightarrow\ p^{\prime}(t)=3at^2+2bt+c\)
  
\(\text{Using CAS:}\)
    
\(\text{Solve}
\begin{cases}
8a+4b+2c+d=2500 \\
1331a+121b+11c+d=4400 \\
12a+4b+c=0  \\
363a+22b+c=0
\end{cases}\)
  

\(a\approx -5.21, b\approx 101.65, c\approx -344.03, d\approx 2823.18\)

aii. \(\text{Local maximim }p(t)\ \text{is}\ (11, 4400)\)

\(\therefore\ h\) \(=23-11=12\)
\(k\) \(=4750-4400=350\)


bi.   \(\text{Plotting points from CAS:}\)

\((24,4820), (26, 3930), (28, 3290), (30, 3600), (32, 3410), (34, 4170), (36, 5180)\)

bii.  \(\text{Using CAS: }\)

\(f(12)-f(0)\) \(=4460-4100=360\)
\(f(24)-f(12)\) \(=4820-4460=360\)
\(f(36)-f(24)\) \(=5180-4820=360\) 

\(\therefore\ n=360\)

biii.  \(f(t)\) \(=3000+30t+700\cos\left(\dfrac{\pi t}{6}\right)+400\cos\left(\dfrac{\pi t}{3}\right)\)
  \(f^{\prime}(t)\) \(=30-\dfrac{700\pi}{6}\sin\left(\dfrac{\pi t}{6}\right)-\dfrac{400\pi}{3}\sin\left(\dfrac{\pi t}{3}\right)\)
    \(=30-\dfrac{350\pi}{3}\sin\left(\dfrac{\pi t}{6}\right)-\dfrac{400\pi}{3}\sin\left(\dfrac{\pi t}{3}\right)\)

  
biv.  \(\text{Max instantaneous rate of change occurs when }f^{\prime\prime}(t)=0\)

\(\text{Maximum rate occurs at }t=10.2, 22.2, 34.2\)

\(\text{Maximum rate using CAS:}\)

\(f^{\prime}(10.2)=f^{\prime}(22.2)=f^{\prime}(34.2)=725.396\approx 725\ \text{million/month}\)

Filed Under: Average Value and Other, Differentiation (Trig), Polynomials, Transformations, Trig Differentiation, Trig Graphing Tagged With: Band 3, Band 4, Band 5, smc-2757-70-Sketch graph, smc-721-10-Unique solution, smc-736-10-sin, smc-736-20-cos, smc-744-10-sin, smc-744-20-cos, smc-753-70-Polynomials, smc-756-20-Trig, smc-756-30-Polynomial

Calculus, MET2 2024 VCAA 2

A model for the temperature in a room, in degrees Celsius, is given by

\(f(t)=\left\{
\begin{array}{cc}12+30 t & \quad \quad 0 \leq t \leq \dfrac{1}{3} \\
22 & t>\dfrac{1}{3}
\end{array}\right.\)

where \(t\) represents time in hours after a heater is switched on.

  1. Express the derivative \(f^{\prime}(t)\) as a hybrid function.   (2 marks)

    --- 3 WORK AREA LINES (style=lined) ---

  1. Find the average rate of change in temperature predicted by the model between \(t=0\) and \(t=\dfrac{1}{2}\).
  2. Give your answer in degrees Celsius per hour.   (1 mark)

    --- 2 WORK AREA LINES (style=lined) ---

  1. Another model for the temperature in the room is given by \(g(t)=22-10 e^{-6 t}, t \geq 0\).
  2.  i. Find the derivative \(g^{\prime}(t)\).   (1 mark)

    --- 2 WORK AREA LINES (style=lined) ---

  3. ii. Find the value of \(t\) for which \(g^{\prime}(t)=10\).
  4.     Give your answer correct to three decimal places.   (1 mark)

    --- 2 WORK AREA LINES (style=lined) ---

  1. Find the time \(t \in(0,1)\) when the temperatures predicted by the models \(f\) and \(g\) are equal.
  2. Give your answer correct to two decimal places.   (1 mark)

    --- 2 WORK AREA LINES (style=lined) ---

  1. Find the time \(t \in(0,1)\) when the difference between the temperatures predicted by the two models is the greatest.
  2. Give your answer correct to two decimal places.   (1 mark)

    --- 4 WORK AREA LINES (style=lined) ---

  1. The amount of power, in kilowatts, used by the heater \(t\) hours after it is switched on, can be modelled by the continuous function \(p\), whose graph is shown below.

\(p(t)=\left\{
\begin{array}{cl}1.5 & 0 \leq t \leq 0.4 \\
0.3+A e^{-10 t} & t>0.4
\end{array}\right.\)

The amount of energy used by the heater, in kilowatt hours, can be estimated by evaluating the area between the graph of \(y=p(t)\) and the \(t\)-axis.
 

  1.   i. Given that \(p(t)\) is continuous for \(t \geq 0\), show that \(A=1.2 e^4\).   (1 mark)

    --- 4 WORK AREA LINES (style=lined) ---

  2.  ii. Find how long it takes, after the heater is switched on, until the heater has used 0.5 kilowatt hours of energy.
  3.     Give your answer in hours.   (1 mark)

    --- 3 WORK AREA LINES (style=lined) ---

  4. iii. Find how long it takes, after the heater is switched on, until the heater has used 1 kilowatt hour of energy.
  5.     Give your answer in hours, correct to two decimal places.   (2 marks)

    --- 3 WORK AREA LINES (style=lined) ---

Show Answers Only

a.    \(f^{\prime}(t)=\left\{
\begin{array}{cc}30  & \quad \quad 0 \leq t <\dfrac{1}{3} \\
0 & t>\dfrac{1}{3}
\end{array}\right.\)

b.    \(20^{\circ}\text{C/h}\)

ci.    \(g^{\prime}(t)=60e^{-6t}\)

cii.   \(0.299\ \text{(3 d.p.)}\)

d.    \(0.27\ \text{(2 d.p.)}\)

e.    \(0.12\ \text{(2 d.p.)}\)

fi.   \(\text{Because function is continuous}\)

\(0.3+Ae^{-10t}\) \(=1.5\)
\(Ae^{-10\times 0.4}\) \(=1.2\)
\(A\) \(=\dfrac{1.2}{e^{-10\times 0.4}}\)
  \(=1.2e^4\)

fii.  \(\dfrac{1}{3}\ \text{hours}\)

fiii. \(1.33\ \text{(2 d.p.)}\)

Show Worked Solution

a.    \(f^{\prime}(t)=\left\{
\begin{array}{cc}30  & \quad \quad 0 \leq t < \dfrac{1}{3} \\
0 & t>\dfrac{1}{3}
\end{array}\right.\)

b.    \(\text{When }\ t=0, f(t)=12\ \ \text{and when }\ t=\dfrac{1}{2}, f(t)=22\)

\(\therefore\ \text{Average rate of change}\) \(=\dfrac{22-12}{\frac{1}{2}}\)
  \(=20^{\circ}\text{C/h}\)


ci.    \(g(t)\) \(=22-10 e^{-6 t}\)
  \(g^{\prime}(t)\) \(=60e^{-6t},\ \ t\geq 0\)


cii.   \(60e^{-6t}\) \(=10\)
  \(-6t\,\ln{e}\) \(=\ln{\dfrac{1}{6}}\)
  \(t\) \(=\dfrac{\ln{\frac{1}{6}}}{-6}\)
      \(=0.2986…\approx 0.299\ \text{(3 d.p.)}\)


d.     \(\left\{
\begin{array}{cc}12+30 t & \ \  0 \leq t \leq \dfrac{1}{3} \\
22 & t>\dfrac{1}{3}
\end{array}\right.\)
\(=22-10e^{-6t}\)

\(\text{Using CAS:}\)

\(\text{Temps equal when}\ t\approx 0.27\ \text{(2 d.p.)}\)


e.     \(\text{Difference }(D)\) \(=|g(t)-f(t)|\)
    \(=\left(22-10e^{-6t}\right)-(12+30t)\)
  \(\dfrac{dD}{dt}\) \(=60e^{-6t}-30\)

\(\text{Max time diff when}\ \dfrac{dD}{dt}=0\)

\(\therefore\ 60e^{-6t}-30\) \(=0\)
\(e^{-6t}\) \(=0.5\)
\(-6t\) \(=\ln{0.5}\)
\(t\) \(=0.1155\dots\)
  \(\approx 0.12\ \text{(2 d.p.)}\)


fi.   \(\text{Because function is continuous}\)

\(0.3+Ae^{-10t}\) \(=1.5\)
\(Ae^{-10\times 0.4}\) \(=1.2\)
\(A\) \(=\dfrac{1.2}{e^{-10\times 0.4}}\)
  \(=1.2e^4\)

  
fii.  \(\text{Using CAS:}\)

\(\text{Or, considering the graph, the area from 0 to 0.4 }=0.6\ \rightarrow t<0.4\)

\(\therefore\ \text{Solving}\ 1.5t=0.5\ \rightarrow\ t=\dfrac{1}{3}\)

\(\therefore\ \text{It takes }\dfrac{1}{3}\ \text{hours for heater to use 0.5  kilowatts.}\)
  

fiii. \(\text{Using CAS:}\)

\(1.5\times 4+\displaystyle\int_{0.4}^{t}0.3+1.2e^4.e^{-10t}dt\) \(=1\)
\(\Bigg[0.3t+0.12e^4.e^{-10t}\Bigg]_{0.4}^{t}\) \(=0.4\)
\(t\) \(=1.3333\dots\)
  \(\approx 1.33\ \text{(2 d.p.)}\)


Filed Under: Differentiation (L&E), Graphs and Applications, L&E Differentiation, L&E Integration, Standard Differentiation Tagged With: Band 3, Band 4, Band 5, smc-739-10-Exponential, smc-745-10-Exponential, smc-746-40-Average ROC, smc-746-60-Composite function, smc-748-20-Exponential (definite)

Functions, MET2 2024 VCAA 1

Consider the function  \( f: R \rightarrow R, f(x)=(x+1)(x+a)(x-2)(x-2 a) \text { where } a \in R \text {. } \)

  1. State, in terms of \(a\) where required, the values of \(x\) for which \(f(x)=0\).  (1 mark

    --- 2 WORK AREA LINES (style=lined) ---

  1. Find the values of \(a\) for which the graph of \(y=f(x)\) has
      
     i. exactly three \(x\)-intercepts.   (2 marks)

    --- 4 WORK AREA LINES (style=lined) ---

    ii. exactly four \(x\)-intercepts.   (1 mark)

    --- 3 WORK AREA LINES (style=lined) ---

  1. Let \(g\) be the function \(g: R \rightarrow R, g(x)=(x+1)^2(x-2)^2\), which is the function \(f\) where \(a=1\).
      
      i. Find \(g^{\prime}(x)\)   (1 mark)

    --- 2 WORK AREA LINES (style=lined) ---

     ii. Find the coordinates of the local maximum of \(g\).   (1 mark)

    --- 3 WORK AREA LINES (style=lined) ---

    iii. Find the values of \(x\) for which \(g^{\prime}(x)>0\).   (1 mark)

    --- 3 WORK AREA LINES (style=lined) ---

     iv. Consider the two tangent lines to the graph of \(y=g(x)\) at the points where
    \(x=\dfrac{-\sqrt{3}+1}{2}\) and \(x=\dfrac{\sqrt{3}+1}{2}\). Determine the coordinates of the point of intersection of these two tangent lines.   (2 marks)

    --- 5 WORK AREA LINES (style=lined) ---

  1. Let \(g\) remain as the function \(g: R \rightarrow R, g(x)=(x+1)^2(x-2)^2\), which is the function \(f\) where \(a=1\).

    Let \(h\) be the function \(h: R \rightarrow R, h(x)=(x+1)(x-1)(x+2)(x-2)\), which is the function \(f\) where \(a=-1\).
      
     i. Using translations only, describe a sequence of transformations of \(h\), for which its image would have a local maximum at the same coordinates as that of \(g\).   (1 mark)

    --- 4 WORK AREA LINES (style=lined) ---

    ii. Using a dilation and translations, describe a different sequence of transformations of \(h\), for which its image would have both local minimums at the same coordinates as that of \(g\).   (2 marks)

    --- 6 WORK AREA LINES (style=lined) ---

Show Answers Only

a.    \(x=-1, x=a, x=2, x=2a\)

bi.  \(a=0, -2, -\dfrac{1}{2}\)

bii. \(R\ \backslash\left\{ -2, -\dfrac{1}{2}, 0, 1\right\}\)

ci.  \(g^{\prime}(x)=2(x-2)(x+1)(2x-1)\)

cii. \(\left(\dfrac{1}{2} , \dfrac{81}{16}\right)\)

ciii. \(x\in\left(-1, \dfrac{1}{2}\right)\cup (2, \infty)\)

civ. \(\left(\dfrac{1}{2}, \dfrac{27}{4}\right)\)

di.   \(\text{Translate }\dfrac{1}{2}\ \text{unit to the right and }\dfrac{81}{16}-4=\dfrac{17}{16}\ \text{units upwards.}\)

dii.  \(\text{Combination is a dilation of }h(x)\ \text{by a factor of}\ \dfrac{3}{\sqrt{10}}\ \text{followed by a }\)

\(\text{translation of }\dfrac{1}{2} \ \text{a unit to the right and an upwards translation of}\ \dfrac{9}{4} \ \text{units}\)

Show Worked Solution

a.    \(x=-1, x=a, x=2, x=2a\)

bi.  \(a=0, -2, -\dfrac{1}{2}\)

bii. \(\text{The solution must be all }R\ \text{except those that give 3 or less solutions.}\)

\(\therefore\ R\ \backslash\left\{ -2, -\dfrac{1}{2}, 0, 1\right\}\)

ci.    \(g^{\prime}(x)\) \(=2(2-x)(x+1)^2+(x-2)^22(x+1)\)
    \(=2(x-2)(x+1)(x+1+x+2)\)
    \(=2(x-2)(x+1)(2x-1)\)

  
cii.  \(\text{When  }g^{\prime}(x)=0, x=2, -1, \dfrac{1}{2}\)

\(\text{From graph local maximum occurs when }x=\dfrac{1}{2}\)

\(g\left(\dfrac{1}{2}\right)\) \(=\left(\dfrac{1}{2}+1\right)^2\left(\dfrac{1}{2}-2\right)^2\)
  \(=\dfrac{9}{4}\times \dfrac{9}{4}=\dfrac{81}{16}\)

  
\(\therefore\ \text{Local maximum at}\ \left(\dfrac{1}{2} , \dfrac{81}{16}\right)\)

ciii. \(\text{From graph}\ g^{\prime}(x)>0\ \text{when }x\in\left(-1, \dfrac{1}{2}\right)\cup (2, \infty)\)

civ.  \(\text{Use CAS to find tangent lines and solve to find intersection.}\)

\(\text{Point of intersection of tangent lines}\ \left(\dfrac{1}{2}, \dfrac{27}{4}\right)\)

di.  \(\text{Local maximum of }g(x)\ \rightarrow\left(\dfrac{1}{2}, \dfrac{81}{16}\right)\)

\(\text{From CAS local maximum of }h(x)\ \rightarrow \left(0, 4\right)\)

\(\therefore\ \text{Translate }\dfrac{1}{2}\ \text{unit to the right and }\dfrac{81}{16}-4=\dfrac{17}{16}\ \text{units upwards.}\)

dii. \(\text{Using CAS to solve }g^{\prime}(x)=0\ \text{and }h^{\prime}(x)=0\)

\(\text{Local Minimums for }g(x)\ \text{at }(-1, 0)\ \text{and }(2, 0)\ \text{which are 3 apart.}\)

\(\text{Local minimums for at }h(x)\ \text{at }\left(-\sqrt{\dfrac{5}{2}}, -\dfrac{9}{4}\right)\ \text{and }\left(\sqrt{\dfrac{5}{2}}, -\dfrac{9}{4}\right)\)

\(\therefore\ \text{Combination is a dilation of }h(x)\ \text{by a factor of}\ \dfrac{3}{\sqrt{10}}\ \text{followed by a }\)

\(\text{translation of }\dfrac{1}{2} \ \text{a unit to the right and an upwards translation of}\ \dfrac{9}{4} \ \text{units.}\)


Filed Under: Polynomials, Tangents and Normals, Transformations Tagged With: Band 3, Band 4, Band 5, smc-634-10-Polynomial, smc-750-10-Factor Theorem, smc-750-60-Other, smc-753-40-Combinations

Probability, MET2 2024 VCAA 19 MC

Consider the normal random variable \(X\) that satisfies  \( \text{Pr} (X < 10) = 0.2\)  and  \(\text{Pr}(X > 18) = 0.2 \).

The value of  \(\text{Pr}(X<12)\)  is closest to

  1. 0.134
  2. 0.297
  3. 0.337
  4. 0.365
Show Answers Only

\(C\)

Show Worked Solution

\(\text{Pr}\left(z<\dfrac{10-\mu}{\sigma}\right)=0.2\)

\(\text{Pr}\left(z\leq\dfrac{18-\mu}{\sigma}\right)=0.8\)

\(\text{Solve simultaneous equations (by CAS):}\)

\(z_1=\dfrac{10-\mu}{\sigma}\ , z_2=\dfrac{18-\mu}{\sigma}\)

\(\therefore\ \text{Pr}(X<12)\approx 0.336947\)

\(\Rightarrow C\)

Mean mark 57%.

Filed Under: Normal Distribution Tagged With: Band 4, smc-719-30-Other z-score intervals

Calculus, MET2 2024 VCAA 18 MC

Find the value of \(x\) which maximises the area of the trapezium below.
 

  1. \(10\)
  2. \(5 \sqrt{2}\)
  3. \(7\)
  4. \(\sqrt{10}\)
Show Answers Only

\(B\)

Show Worked Solution
\(A\) \(=\dfrac{h}{2}(a+b)\)
  \(=2x\sqrt{100-x^2}\quad\text{(Using Pythagoras)}\)
\(\dfrac{dA}{dx}\) \(=\dfrac{4(50-x^2)}{\sqrt{100-x^2}}\quad\text{(Using product rule)}\)


\(\text{For maximum }\ \dfrac{dA}{dx}=0:\)

\(x=5\sqrt{2}\quad (0<x<10)\ \ \text{(by CAS)}\)

 
\(\text{Alternatively:}\)

\(\dfrac{4(50-x^2)}{\sqrt{100-x^2}}\) \(=0\quad(x \neq 10)\)
\(50-x^2\) \(=0\)
(\(\sqrt{50}-x)(\sqrt{50}+x)\) \(=0\)
\(\therefore\ x\) \(=\sqrt{50}=5\sqrt{2}\quad (0<x<10)\)

   
\(\text{Check gradient for max using table}\)
  

\(x\) \(7\) \(\sqrt{50}\) \(7.2\)
\(A^{\prime}\) \(0.56\) \(0\) \(-1.06\)
\(\text{Gradient}\) \(+\) \(0\) \(-\)

   
 \(\therefore\ x=5\sqrt{2}\ \text{maximises the area}\)
  

\(\Rightarrow B\)

Filed Under: Maxima and Minima Tagged With: Band 4, smc-641-10-Area

Calculus, MET2 2024 VCAA 16 MC

Suppose that a differentiable function  \(  f: R \rightarrow R \)  and its derivative  \(f^{\prime}: R \rightarrow R\)  satisfy  \(f(4)=25\)  and  \(f^{\prime}(4)=15\).

Determine the gradient of the tangent line to the graph of  \( {\displaystyle y=\sqrt{f(x)} } \)  at  \( x=4 \).

  1. \(\sqrt{15}\)
  2. \(\dfrac{1}{10}\)
  3. \(\dfrac{15}{2}\)
  4. \(\dfrac{3}{2}\)
Show Answers Only

\(D\)

Show Worked Solution
\(y\) \(=\sqrt{f(x)}={f(x)}^{\frac{1}{2}}\)
\(y^{\prime}\) \(=\dfrac{1}{2}\left({f(x)}^{-\frac{1}{2}}\right)\times f^{\prime}(x)=\dfrac{f^{\prime}(x)}{2\sqrt{f(x)}}\)

 
\(\text{Given}\ \ f(4)=25,\ f^{\prime}(4)=15\)

\(\therefore\ y^{\prime}=\dfrac{15}{2\sqrt{25}}=\dfrac{3}{2}\)

\(\Rightarrow D\)

♦♦ Mean mark 36%.

Filed Under: Tangents and Normals Tagged With: Band 4, smc-634-40-Other Function, smc-634-50-Find tangent given curve

PHYSICS, M5 2024 HSC 25

The mathematical model below shows the relationship between the orbital radius of a satellite and its period.

\(\dfrac{r^3}{T^2}=\dfrac{G M}{4 \pi^2}\)

  1. By considering gravitational force, show how this model can be derived.   (2 marks)

    --- 5 WORK AREA LINES (style=lined) ---

  2. A planet with five moons is discovered. The following graph is produced from observations of the orbital radius of the moons and their orbital periods, measured in Earth days.   
     

  1. Use the graph to calculate the mass of the planet.  (4 marks)

    --- 8 WORK AREA LINES (style=lined) ---

Show Answers Only

a.    See Worked Solutions

b.    \(9.9 \times 10^{25}\ \text{kg}\)

Show Worked Solution

a.    Centripetal force = gravitational force

\(F_c\) \(=F_g\)  
\(\dfrac{mv^2}{r}\) \(=\dfrac{GMm}{r^2}\)  
\(v^2\) \(=\dfrac{GM}{r}\ \ \text{where}\ \ v=\dfrac{2 \pi r}{T}\)  
\( \left(\dfrac{2\pi r}{T}\right)^2\) \(=\dfrac{GM}{r}\)  
\(\dfrac{4 \pi^2 r^2}{T^2}\) \(=\dfrac{GM}{r}\)  
\(\dfrac{r^3}{T^2}\) \(=\dfrac{GM}{4 \pi^2}\)  
  

b.    Find gradient of line through \((200, 0.16)\) and \((300, 0.24)\):

\(m=\dfrac{y_2-y_1}{x_2-x_1} = \dfrac{0.24-0.16}{300 \times 10^{12}-200 \times 10^{12}} = 8 \times 10^{-16}\ \text{days}^{2}/ \text{km}^{3}\)

\(\Rightarrow\ \) Using \(\dfrac{r^3}{T^2} = \dfrac{GM}{4 \pi^2}\), \(r\) and \(T\) must be in SI units: 

\(8 \times 10^{-16} \times \dfrac{(24 \times 60 \times 60)^2}{1000^3} = 5.972 \times 10^{-15}\ \text{s}^{2}\text{/m}^{3}\)

\(\Rightarrow \ \dfrac{T^2}{r^3}= 5.972 \times 10^{-15}\ \text{s}^{2}\text{/m}^{3}\ \ \Rightarrow\ \ \dfrac{r^3}{T^2} = 1.6745 \times 10^{14}\)

\(\dfrac{r^3}{T^2}\) \(=\dfrac{GM}{4 \pi^2}\)  
\(M\) \(=\dfrac{r^3}{T^2} \times \dfrac{4 \pi^2}{G}\)  
  \(=1.6745 \times 10^{14} \times \dfrac{4 \pi^2}{6.67 \times 10^{-11}}\)  
  \(=9.9 \times 10^{25}\ \text{kg}\)  

Filed Under: Motion in Gravitational Fields Tagged With: Band 4, smc-3692-30-Orbital Velocity/Period/Radius

PHYSICS, M8 2024 HSC 24

An absorption spectrum resulting from the passage of visible light from a star's surface through its hydrogen atmosphere is shown. Absorption lines are labelled \(W\) to \(Z\) in the diagram.
 

  1. Determine the surface temperature of the star.   (2 marks)

    --- 4 WORK AREA LINES (style=lined) ---

  2. Absorption line \(W\) originates from an electron transition between the second and sixth energy levels. Use  \(\dfrac{1}{\lambda}=R\left(\dfrac{1}{n_{ f }^2}-\dfrac{1}{n_{ i }^2}\right)\)  to calculate the frequency of light absorbed to produce absorption line \(W\).   (3 marks)

    --- 8 WORK AREA LINES (style=lined) ---

  3. Explain the physical processes that produce an absorption spectrum.   (3 marks)

    --- 8 WORK AREA LINES (style=lined) ---

Show Answers Only

a.    \(5796\ \text{K}\)

b.    \(7.31 \times 10^{14}\ \text{Hz}\)

c.    An absorption spectra is produced when:

  • A continuous spectrum of light  from a black body such as a star passes through cooler and lower density gas in the outer atmosphere of the star.
  • As the light passes through the gas, electrons in the atoms that make up the cooler gas clouds absorb distinct wavelengths/energy levels of light equal to the difference in energy levels between the electron shells where \(E_i-E_f=hf=\dfrac{hc}{\lambda}\). 
  • As the electrons in the atoms fall back into their ground state, they emit the photon of light that they absorb and the photon is then scattered out of the continuous spectrum.
  • The light that remains is then passed through a prism to separate the wavelengths and record the intensities. The black or darkened lines in the absorption spectra is the result of the scattered wavelengths of light. 
Show Worked Solution

a.    Determined temperature using the peak wavelength:

\(T=\dfrac{b}{\lambda_{\text{max}}}=\dfrac{2.898 \times 10^{-3}}{500 \times 10^{-9}}=5796\ \text{K}\)
 

b.     \(\dfrac{1}{\lambda}\) \(=R\left(\dfrac{1}{n_f^2}-\dfrac{1}{n_i^2}\right)\)
    \(=1.097 \times 10^7 \times \left(\dfrac{1}{2^2}-\dfrac{1}{6^2}\right)\)
    \(=2.438 \times 10^6\ \text{m}^{-1}\)
  \(\lambda\) \(=\dfrac{1}{2.438 \times 10^6}=410.2\ \text{nm}\)


\(\therefore f=\dfrac{c}{\lambda} = \dfrac{3 \times 10^8}{410.2 \times 10^{-9}} = 7.31 \times 10^{14}\ \text{Hz}\)
 

c.    Absorption spectra:

  • Produced when a continuous spectrum of light  from a black body such as a star passes through cooler and lower density gas in the outer atmosphere of the star.
  • As the light passes through the gas, electrons in the atoms that make up the cooler gas clouds absorb distinct wavelengths/energy levels of light equal to the difference in energy levels between the electron shells where \(E_i-E_f=hf=\dfrac{hc}{\lambda}\). 
  • As the electrons in the atoms fall back into their ground state, they emit the photon of light that they absorb and the photon is then scattered out of the continuous spectrum.
  • The light that remains is then passed through a prism to separate the wavelengths and record the intensities. The black or darkened lines in the absorption spectra is the result of the scattered wavelengths of light. 
♦ Mean mark (c) 51%.

Filed Under: Light: Quantum Model, Origins of Elements, Quantum Mechanical Nature of the Atom Tagged With: Band 4, Band 5, smc-3698-50-Blackbodies, smc-3698-70-Planck, smc-3700-20-Spectra, smc-3702-20-Electron Transitions

PHYSICS, M8 2024 HSC 23

Development of models of the atom has resulted from both experimental investigations and hypotheses based on theoretical considerations.

  1. A key piece of experimental evidence supporting the nuclear model of the atom was a discovery by Chadwick in 1932.
  2. An aspect of the experimental design is shown.
     

    1. What was the role of paraffin in Chadwick's experiment?   (2 marks)

      --- 4 WORK AREA LINES (style=lined) ---

    2. How did Chadwick's experiment change the model of the atom?  (3 marks)

      --- 6 WORK AREA LINES (style=lined) ---

  1. Explain how de Broglie's hypothesis regarding the nature of electrons addressed limitations in the Bohr-Rutherford model of the atom.   (4 marks)

    --- 8 WORK AREA LINES (style=lined) ---

Show Answers Only

a.i.  Role of paraffin wax:

  • Paraffin wax is a rich source of protons.
  • When the paraffin was placed in front of the unknown radiation, the transfer of momentum from the radiation caused protons to be emitted from the paraffin wax.
  • The emitted protons could then be detected and analysed.
  • From studying the protons ejected from the paraffin wax, Chadwick proposed the existence of the neutron.
     

a.ii. Changes to the model of the atom:

  • Previous to Chadwick’s experiment, the model of the atom proposed by Rutherford consisted of a dense positive charge in the nucleus which was orbited by electrons.
  • In this model however, the protons did not account for the total mass of the nucleus.
  • Through using the conservation of momentum and energy in his experiment, Chadwick proposed the existence of the neutron particle which was slightly heavier than the proton.
  • The model of the atom was updated to include both protons and neutrons in the nucleus which then fully accounted for the mass of the nucleus.
     

b.   Limitations in the Bohr-Rutherford model:

  • Rutherford’s model of the atom stated that electrons orbited the nucleus and were electrostatically attracted to the positive nucleus. This meant that the electrons were in circular motion and were constantly under centripetal acceleration.
  • However, Maxwell predicted that an accelerating charge would emit electro-magnetic radiation and in Rutherford’s model, all atoms should have been unstable as the electrons would emit EMR, lose energy and spiral into the nucleus.
  • Bohr proposed that electrons orbited the nucleus in stationary states at fixed energies with no intermediate states possible where they would not emit EMR but provided no theoretical explanation for this.

De Broglie’s hypothesis:

  • De Broglie proposed that electrons could exhibit a wave nature and could act as matter-waves. The electrons would form standing waves around the nucleus and would no longer be an accelerating particle which addressed the limitation of all atoms being unstable.
  • Further, De Broglie proposed that the standing waves would occur at integer wavelengths where the circumference of the electron orbit would be equal to an integer electron wavelength, \(2\pi r=n\lambda\)  where  \(\lambda = \dfrac{h}{mv}\). At any other radii other than this, deconstructive interference would occur and a standing electron wave would not form. This addressed why electrons could only be present at fixed radii/energy levels in the atom.

Show Worked Solution

a.i.  Role of paraffin wax:

  • Paraffin wax is a rich source of protons.
  • When the paraffin was placed in front of the unknown radiation, the transfer of momentum from the radiation caused protons to be emitted from the paraffin wax.
  • The emitted protons could then be detected and analysed.
  • From studying the protons ejected from the paraffin wax, Chadwick proposed the existence of the neutron. 
Mean mark (a)(i) 52%.

a.ii. Changes to the model of the atom:

  • Previous to Chadwick’s experiment, the model of the atom proposed by Rutherford consisted of a dense positive charge in the nucleus which was orbited by electrons.
  • In this model however, the protons did not account for the total mass of the nucleus.
  • Through using the conservation of momentum and energy in his experiment, Chadwick proposed the existence of the neutron particle which was slightly heavier than the proton.
  • The model of the atom was updated to include both protons and neutrons in the nucleus which then fully accounted for the mass of the nucleus. 

b.   Limitations in the Bohr-Rutherford model:

  • Rutherford’s model of the atom stated that electrons orbited the nucleus and were electrostatically attracted to the positive nucleus. This meant that the electrons were in circular motion and were constantly under centripetal acceleration.
  • However, Maxwell predicted that an accelerating charge would emit electro-magnetic radiation and in Rutherford’s model, all atoms should have been unstable as the electrons would emit EMR, lose energy and spiral into the nucleus.
  • Bohr proposed that electrons orbited the nucleus in stationary states at fixed energies with no intermediate states possible where they would not emit EMR but provided no theoretical explanation for this.

De Broglie’s hypothesis:

  • De Broglie proposed that electrons could exhibit a wave nature and could act as matter-waves. The electrons would form standing waves around the nucleus and would no longer be an accelerating particle which addressed the limitation of all atoms being unstable.
  • Further, De Broglie proposed that the standing waves would occur at integer wavelengths where the circumference of the electron orbit would be equal to an integer electron wavelength, \(2\pi r=n\lambda\)  where  \(\lambda = \dfrac{h}{mv}\). At any other radii other than this, deconstructive interference would occur and a standing electron wave would not form. This addressed why electrons could only be present at fixed radii/energy levels in the atom.
♦ Mean mark (b) 44%.

Filed Under: Quantum Mechanical Nature of the Atom, Structure of the Atom Tagged With: Band 4, Band 5, smc-3701-40-Rutherford, smc-3701-60-Chadwick, smc-3702-10-Bohr's Model, smc-3702-40-De Broglie

Probability, MET2 2024 VCAA 9 MC

At a Year 12 formal, 45% of the students travelled to the event in a hired limousine, while the remaining 55% were driven to the event by a parent.

Of the students who travelled in a hired limousine, 30% had a professional photo taken.

Of the students who were driven by a parent, 60% had a professional photo taken.

Given that a student had a professional photo taken, what is the probability that the student travelled to the event in a hired limousine?

  1. \(\dfrac{1}{8}\)
  2. \(\dfrac{27}{200}\)
  3. \(\dfrac{9}{31}\)
  4. \(\dfrac{22}{31}\)
Show Answers Only

\(C\)

Show Worked Solution

\(\text{Pr(Limo|PP)}\) \(=\dfrac{\text{Pr(Limo)}\ \cap\ \text{Pr(PP)}}{\text{Pr(PP)}}\)
  \(=\dfrac{0.45\times 0.30}{(0.45\times 0.30)+(0.55\times 0.6)}\)
  \(=\dfrac{0.135}{0.465}\)
  \(=\dfrac{9}{31}\)

\(\Rightarrow C\)

Filed Under: Conditional Probability and Set Notation Tagged With: Band 4, smc-2736-10-Conditional probability

Functions, MET2 2024 VCAA 8 MC

Some values of the functions  \(f: R \rightarrow R\)  and  \(g: R \rightarrow R\)  are shown below.

\begin{array} {|c|c|}
\hline
\rule{0pt}{2.5ex} \quad \ x \quad \rule[-1ex]{0pt}{0pt} & \quad \ 1 \quad \rule[-1ex]{0pt}{0pt} & \quad \ 2 \quad \rule[-1ex]{0pt}{0pt} & \quad \ 3 \quad \\
\hline
\rule{0pt}{2.5ex} \quad  f(x) \quad \rule[-1ex]{0pt}{0pt} & \quad \ 0 \quad \rule[-1ex]{0pt}{0pt} & \quad 4 \quad \rule[-1ex]{0pt}{0pt} & \quad 5 \quad \\
\hline
\rule{0pt}{2.5ex} \quad  g(x) \quad \rule[-1ex]{0pt}{0pt} & \quad 3 \quad \rule[-1ex]{0pt}{0pt} & \quad 4 \quad \rule[-1ex]{0pt}{0pt} & \quad -5 \quad \\
\hline
\end{array}

The graph of the function  \(h(x)=f(x)-g(x)\)  must have an \(x\)-intercept at

  1. \((2,0)\)
  2. \((3,0)\)
  3. \((4,0)\)
  4. \((5,0)\)
Show Answers Only

\(A\)

Show Worked Solution

\begin{array} {|c|c|}
\hline
\rule{0pt}{2.5ex} \quad  x \quad \rule[-1ex]{0pt}{0pt} & \quad  1 \quad \rule[-1ex]{0pt}{0pt} & \quad  2 \quad \rule[-1ex]{0pt}{0pt} & \quad  3 \quad \\
\hline
\rule{0pt}{2.5ex}   h(x)  \rule[-1ex]{0pt}{0pt} & \ \ -3 \ \ \rule[-1ex]{0pt}{0pt} & \ \ 0 \ \ \rule[-1ex]{0pt}{0pt} & \ \ 10 \ \ \\
\hline
\end{array}

\(\therefore\ x\text{-intercept}\ \rightarrow\ (2, 0)\)

\(\Rightarrow A\)

Filed Under: Functional Equations Tagged With: Band 4, smc-642-40-Other functions

Probability, MET2 2024 VCAA 7 MC

A fair six-sided die is repeatedly rolled. What is the minimum number of rolls required so that the probability of rolling a six at least once is greater than 0.95 ?

  1. 15
  2. 16
  3. 17
  4. 18
Show Answers Only

\(C\)

Show Worked Solution

\(X\sim \text{Bi} \left(n, \dfrac{1}{6}\right)\)

\(\text{Pr}(X\geq 1)\) \(>0.95\)
\(1-\text{Pr}(X=0)\) \(>0.95\)
\(-\text{Pr}(X=0)\) \(\geq -0.05\)
\(\text{Pr}(X=0)\) \(< 0.05\quad \left[\text{CAS}:\text{invBinomN}\left(0.05,\dfrac{1}{6},0\right)\right]\)
  \(=17\)

  \(\Rightarrow C\)

Filed Under: Binomial Tagged With: Band 4, smc-638-40-Inverse Binom N (CAS)

PHYSICS, M8 2024 HSC 22

The following graph, based on the data gathered by Hubble, shows the relationship between the recessional velocity of galaxies and their distance from Earth.


  1. Describe the significance of the graph to our understanding of the universe.   (2 marks)

    --- 4 WORK AREA LINES (style=lined) ---

  2. How were the recessional velocities of galaxies determined?  (3 marks)

    --- 6 WORK AREA LINES (style=lined) ---

Show Answers Only

a.   Recessional velocity vs distance from Earth graph:

  • The graph shows that the further away galaxies are from Earth, the faster these galaxies are moving away from Earth.
  • This relationships depicts Hubble’s law:  \(v=H_0 D\). 
  • This graph provides evidence that the universe is constantly expanding as predicted by the big bang theory.
     

b.   Determining recessional velocities:

  • The recessional velocities of the galaxies were determined by analysing their absorption spectras.
  • Light waves that are moving away from the Earth will appear to be stretched (wavelength increased) according to the doppler effect.
  • The absorption spectra of galaxies were compared with the spectra of the same elements on Earth, revealing that the galaxies’ spectra were redshifted.
  • The greater the extent of the red shift in the spectra, the greater the recessional velocity of the galaxy. 

Show Worked Solution

a.   Recessional velocity vs distance from Earth graph:

  • The graph shows that the further away galaxies are from Earth, the faster these galaxies are moving away from Earth.
  • This relationships depicts Hubble’s law:  \(v=H_0 D\). 
  • This graph provides evidence that the universe is constantly expanding as predicted by the big bang theory.
     

b.   Determining recessional velocities:

  • The recessional velocities of the galaxies were determined by analysing their absorption spectras.
  • Light waves that are moving away from the Earth will appear to be stretched (wavelength increased) according to the doppler effect.
  • The absorption spectra of galaxies were compared with the spectra of the same elements on Earth, revealing that the galaxies’ spectra were redshifted.
  • The greater the extent of the red shift in the spectra, the greater the recessional velocity of the galaxy. 
♦ Mean mark (b) 49%.

Filed Under: Electromagnetic Spectrum, Origins of Elements Tagged With: Band 4, Band 5, smc-3696-10-Spectroscopy, smc-3700-20-Spectra, smc-3700-30-Hubble

PHYSICS, M5 2024 HSC 13 MC

The diagram shows two identical satellites, \(A\) and \(B\), orbiting a planet.
 

Which row in the table correctly compares the potential energy, \(U\), and kinetic energy, \(K\), of the satellites?

\begin{align*}
\begin{array}{l}
\ \rule{0pt}{2.5ex}  \textbf{} \rule[-1.5ex]{0pt}{0pt}  & \\
\rule{0pt}{2.5ex}  \textbf{A.} \rule[-1ex]{0pt}{0pt} \\
\rule{0pt}{2.5ex}  \textbf{B.} \rule[-1ex]{0pt}{0pt} \\
\rule{0pt}{2.5ex}  \textbf{C.} \rule[-1ex]{0pt}{0pt} \\
\rule{0pt}{2.5ex}  \textbf{D.} \rule[-1ex]{0pt}{0pt} \\
\end{array}
\begin{array}{|c|c|}
\hline
\rule{0pt}{2.5ex} \textit{Potential energy} \rule[-1ex]{0pt}{0pt} & \textit{Kinetic energy} \\
\hline
\rule{0pt}{2.5ex} U_\text{A} > U_\text{B} \rule[-1ex]{0pt}{0pt} & K_\text{A} < K_\text{B} \\
\hline
\rule{0pt}{2.5ex} U_\text{A} < U_\text{B} \rule[-1ex]{0pt}{0pt} & K_\text{A} > K_\text{B} \\
\hline
\rule{0pt}{2.5ex} U_\text{A} > U_\text{B} \rule[-1ex]{0pt}{0pt} & K_\text{A} > K_\text{B} \\
\hline
\rule{0pt}{2.5ex} U_\text{A} < U_\text{B} \rule[-1ex]{0pt}{0pt} & K_\text{A} < K_\text{B} \\
\hline
\end{array}
\end{align*}

Show Answers Only

\(A\)

Show Worked Solution
  • As shown in the graph below, as the radius of a satellite increases the kinetic energy decreases and the gravitational potential energy increases.
      

  • This can also be concluded using the energy formulas for kinetic energy and gravitational potential energy:
  •    \(K=\dfrac{GMm}{2r}\)  and  \(U=\dfrac{GMm}{r}\)

\(\Rightarrow A\)

Filed Under: Motion in Gravitational Fields Tagged With: Band 4, smc-3692-20-Energy Changes, smc-3692-40-Satellites

Calculus, MET2 2024 VCAA 4 MC

If \( { \displaystyle \int_a^b f(x) d x=-5 } \)  and \( { \displaystyle \int_a^c f(x) d x=3 } \), where \(a<b<c\), then \( { \displaystyle \int_b^c 2 f(x) d x } \)  is equal to

  1. \(-16\)
  2. \(16\)
  3. \(-4\)
  4. \(4\)
Show Answers Only

\(B\)

Show Worked Solution
\({ \displaystyle \int_a^b f(x) d x} +{ \displaystyle \int_b^c f(x) d x}\) \(={ \displaystyle \int_a^c f(x) d x} \)  
\(-5+{ \displaystyle \int_b^c f(x) d x}\) \(=3\)  
\({ \displaystyle \int_b^c f(x) d x}\) \(=3+5=8\)  

 
\(\therefore{ \displaystyle \int_b^c 2f(x) d x}=16\)

\(\Rightarrow B\)

Filed Under: Standard Integration Tagged With: Band 4, smc-749-20-Definite Integrals

Probability, MET2 2024 VCAA 3 MC

A discrete random variable \(X\) is defined using the probability distribution below, where \(k\) is a positive real number.

\begin{array} {|c|c|}
\hline
\rule{0pt}{2.5ex} x \rule[-1ex]{0pt}{0pt} & \ \ \ \ \text{0}\ \ \ \  \rule[-1ex]{0pt}{0pt} & \ \ \ \ \text{1}\ \ \ \ \rule[-1ex]{0pt}{0pt} & \ \ \ \ \text{2}\ \ \ \ \rule[-1ex]{0pt}{0pt} & \ \ \ \ \text{3}\ \ \ \ \rule[-1ex]{0pt}{0pt} & \ \ \ \ \text{4}\ \ \ \ \\
\hline
\rule{0pt}{2.5ex} \text{Pr} \  (X = x) \rule[-1ex]{0pt}{0pt} &  2k \rule[-1ex]{0pt}{0pt} & 3k \rule[-1ex]{0pt}{0pt} & 5k \rule[-1ex]{0pt}{0pt} & 3k \rule[-1ex]{0pt}{0pt} & 2k \\
\hline
\end{array}

Find \(\operatorname{Pr}(X<4 \mid X>1)\).

  1. \(\dfrac{13}{15}\)
  2. \(\dfrac{11}{13}\)
  3. \(\dfrac{4}{5}\)
  4. \(\dfrac{8}{15}\)
Show Answers Only

\(C\)

Show Worked Solution

\(2k+3k+5k+3k+2k=1\ \Rightarrow\ k=\dfrac{1}{15}\)

\(\operatorname{Pr}(X<4 \mid X>1)\) \(=\dfrac{\operatorname{Pr}(1<X<4)}{\operatorname{Pr}(X>1)}\)
  \(=\dfrac{\frac{5}{15}+\frac{3}{15}}{\frac{5}{15}+\frac{3}{15}+\frac{2}{15}}\)
  \(=\dfrac{\frac{8}{15}}{\frac{10}{15}}\)
  \(=\dfrac{4}{5}\)


\(\Rightarrow C\)

Filed Under: Probability Distribution Tables Tagged With: Band 4, smc-732-70-Conditional Probability

Graphs, MET2 2024 VCAA 1 MC

The asymptote(s) of the graph of  \(y=\log _e(x+1)-3\)  are

  1. \(x=-1\)  only
  2. \(x=1\)  only
  3. \(y=-3\)  only
  4. \(x=-1\)  and  \(y=-3\)
Show Answers Only

\(A\)

Show Worked Solution

\(\text{Asymptotes occur when}\ \ x+1=0\)

\(\therefore\ \text{Only one asymptote at}\ \ x=-1\)

\(\Rightarrow A\)

Filed Under: Quotient and Other Graphs Tagged With: Band 4, smc-757-30-Find asymptote(s)

PHYSICS, M7 2024 HSC 12 MC

A rod has a length, \(\mathrm{L}_0\), when measured in its own frame of reference.

The rod travels past a stationary observer at speed, \(v\), as shown in the diagram.
 

Which option represents the relationship between the speed of the rod, \(v\), and the length of the rod as measured by the stationary observer?
 

  1. \( W \)
  2. \( X \)
  3. \( Y \)
  4. \( Z \)
Show Answers Only

\(B\)

Show Worked Solution
  • Length contraction occurs when objects travelling at high speeds are observed from a stationary observer.
  •    \(L=L_o\sqrt{1-\frac{v^2}{c^2}}\)
  • At low speeds, e.g. \((0.4c)\), the contraction factor is only small, \(\sqrt{1-\frac{v^2}{c^2}} = \sqrt{1-\frac{(0.4c)^2}{c^2}} = 0.92\)
  • As the speed of the rod increases, the contraction factor increases exponentially, e.g. \((0.9c)\), \(\sqrt{1-\frac{v^2}{c^2}} = \sqrt{1-\frac{(0.9c)^2}{c^2}} = 0.44\)
  • This exponential increase in the length contraction of an object as the object approaches \(c\) is demonstrated by the curve \(X\). 

\(\Rightarrow B\)

Filed Under: Light and Special Relativity Tagged With: Band 4, smc-3699-20-Length Contraction

PHYSICS, M5 2024 HSC 11 MC

A satellite is in a circular orbit.

What is the relationship between its orbital velocity, \(v\), and its orbital radius, \(r\)?

  1. \(v\) is directly proportional to the square of \(r\).
  2. \(v\) is inversely proportional to the square of \(r\).
  3. \(v\) is directly proportional to the square root of \(r\).
  4. \(v\) is inversely proportional to the square root of \(r\).
Show Answers Only

\(D\)

Show Worked Solution
  • The orbital velocity of a satellite is given by the equation: \(v=\sqrt{\dfrac{GM}{r}}\)
  • Hence  \(v \propto \dfrac{1}{\sqrt{r}}\)
  • The orbital velocity is inversely proportional to the square root of the orbital radius.

\(\Rightarrow D\)

Filed Under: Motion in Gravitational Fields Tagged With: Band 4, smc-3692-30-Orbital Velocity/Period/Radius

PHYSICS, M5 2024 HSC 9 MC

Object \(P\) is dropped from rest, and object \(Q\) is launched horizontally from the same height.
 

Which option correctly compares the projectile motion of \(P\) and \(Q\) ?

  1. The acceleration of \(P\) is less than the acceleration of \(Q\).
  2. The final velocity of \(Q\) is greater than the final velocity of \(P\).
  3. The time of flight of \(Q\) is greater than the time of flight of \(P\).
  4. The initial vertical velocity of \(P\) is less than the initial vertical velocity of \(Q\).
Show Answers Only

\(B\)

Show Worked Solution
  • Both objects start with the same initial vertical velocity and experience the same acceleration due to gravity. Therefore both objects will hit the ground at the same time with the same final vertical velocity.
  • Object \(Q\) however, has both vertical and horizontal velocity while object \(P\) only has vertical velocity. Therefore object \(Q\) will have a greater total final velocity when compared with \(P\).

\(\Rightarrow B\)

Filed Under: Projectile Motion Tagged With: Band 4, smc-3690-10-Projectile Motion Models, smc-3690-35-Initial Velocity, smc-3690-90-Velocity and Acceleration

PHYSICS, M6 2024 HSC 8 MC

An ideal transformer produces an output of 6 volts when an input of 240 volts is applied.

What change would be needed to produce an output of 12 volts, using the same input voltage?

  1. Increase the number of turns on the primary coil
  2. Decrease the number of turns on the primary coil
  3. Increase the resistance connected to the secondary coil
  4. Decrease the resistance connected to the secondary coil
Show Answers Only

\(B\)

Show Worked Solution
  • Using the ideal transformer equation:
  •   \(\dfrac{V_p}{V_s}=\dfrac{N_p}{N_s}\ \ \Rightarrow\ \ V_s=V_p \times \dfrac{N_s}{N_p}\)
  • To increase the output voltage while the input voltage remains the same, the value of \(\dfrac{N_s}{N_p}\) must increase.
  • Given the options, this can only be done by decreasing the number of turns on the primary coil.

\(\Rightarrow B\)

Filed Under: Electromagnetic Induction Tagged With: Band 4, smc-3705-50-Transformer Calcs

PHYSICS, M6 2024 HSC 4 MC

A conducting coil is mounted on an axle and placed in a uniform magnetic field. The diagram shows different ways of connecting the coil to a power source.

Which setup allows the conducting coil to rotate continuously?


Show Answers Only

\(D\)

Show Worked Solution
  • The split ring commutator is used in a DC motor to reverse the current in the arms every 180\(^{\circ}\) to ensure unidirectional torque.
  • Initially, the split ring commutator must be in contact with the carbon brushes to produce an electric current through the coil and the coil must lie in the horizontal plane so torque in produced.
  • Additionally, the split ring commutator should disconnect with the carbon brushes as the coil is vertically oriented. 

\(\Rightarrow D\)

Filed Under: Applications of the Motor Effect Tagged With: Band 4, smc-3695-10-Torque, smc-3695-30-DC motor components

CHEMISTRY, M2 EQ-Bank 3

Balance the following chemical equations:

  1. \(\ce{HCl(aq) + Zn(s) -> ZnCl2(aq) + H2(g)}\)   (1 mark)
  2. \(\ce{CuSO4(aq) + AgNO3(aq) -> Ag2SO4(s) + Cu(NO3)2(aq)}\)   (1 mark)

Show Answers Only

a.    \(\ce{2HCl(aq) + Zn(s) -> ZnCl2(aq) + H2(g)}\)

b.    \(\ce{CuSO4(aq) + 2AgNO3(aq) -> Ag2SO4(s) + Cu(NO3)2(aq)}\)

Show Worked Solution

a.    \(\ce{2HCl(aq) + Zn(s) -> ZnCl2(aq) + H2(g)}\)

b.    \(\ce{CuSO4(aq) + 2AgNO3(aq) -> Ag2SO4(s) + Cu(NO3)2(aq)}\)

Filed Under: Chemical Reactions and Stoichiometry Tagged With: Band 3, Band 4, smc-4259-50-Balancing Chemical Equations

BIOLOGY, M6 2024 HSC 34

Discuss the ethical implications and impacts on society of the use of TWO biotechnologies.   (7 marks)

--- 22 WORK AREA LINES (style=lined) ---

Show Answers Only

Social impacts of recombinant DNA technology (plant biotechnology)

  • Recombinant DNA has created beneficial products like Bt corn and Bt cotton.
  • Bt crops require fewer pesticide applications since they produce their own insecticidal proteins.
  • This reduces chemical pesticide costs for farmers and decreases environmental impact from pesticide spraying.

Associated ethical concerns:

  • Farmers growing Bt corn and cotton must purchase, at a significant cost, new GM seeds each season. Traditional farmers can reuse their seeds for the following year’s crop planting.
  • This difference creates economic disparities in access to GM crops and the related market opportunities.

Social impacts of selective breeding/hybridisation (animal biotechnology)

  • Selective breeding/hybridisation has produced, for example, dairy cows capable of increased milk production.
  • This results in higher yields and greater food availability.
  • Improved profits and living standards for farmers who can access the technology.
  • Increased food production to support population growth.

Associated ethical issues:

  • High-yield dairy cows show decreased fertility.
  • May compromise animal welfare and quality of life.
Show Worked Solution

Social impacts of recombinant DNA technology (plant biotechnology)

  • Recombinant DNA has created beneficial products like Bt corn and Bt cotton.
  • Bt crops require fewer pesticide applications since they produce their own insecticidal proteins.
  • This reduces chemical pesticide costs for farmers and decreases environmental impact from pesticide spraying.

Associated ethical concerns:

  • Farmers growing Bt corn and cotton must purchase, at a significant cost, new GM seeds each season. Traditional farmers can reuse their seeds for the following year’s crop planting.
  • This difference creates economic disparities in access to GM crops and the related market opportunities.

Social impacts of selective breeding/hybridisation (animal biotechnology)

  • Selective breeding/hybridisation has produced, for example, dairy cows capable of increased milk production.
  • This results in higher yields and greater food availability.
  • Improved profits and living standards for farmers who can access the technology.
  • Increased food production to support population growth.

Associated ethical issues:

  • High-yield dairy cows show decreased fertility.
  • May compromise animal welfare and quality of life.
♦ Mean mark 56%.

Filed Under: Biotechnology Tagged With: Band 4, Band 5, smc-3653-20-Evaluating Genetic Technology

BIOLOGY, M5 2024 HSC 33

Female Jack Jumper ants (Myrmecia pilosula) have a single pair of chromosomes. During meiosis, crossing over occurs. The diagram shows the crossing over and the position of three genes on the chromosomes.
 

  1. Outline the significance of crossing over for the Jack Jumper ants.   (2 marks)

    --- 4 WORK AREA LINES (style=lined) ---

  2. Draw the chromosomes of the four possible gametes after crossing over for the Jack Jumper ants occurs. Include the alleles for each gene.   (2 marks)
     

    --- 0 WORK AREA LINES (style=lined) ---

Show Answers Only

a.   Significance of crossing over:

  • Genetic variation increases in the Jack Jumper ant population through recombination.
  • This enhanced genetic diversity improves the species’ chances of survival when faced with environmental changes, as some ants may carry beneficial adaptations.
     

b.   

Show Worked Solution

a.   Significance of crossing over:

  • Genetic variation increases in the Jack Jumper ant population through recombination.
  • This enhanced genetic diversity improves the species’ chances of survival when faced with environmental changes, as some ants may carry beneficial adaptations. 

b.   

♦ Mean mark (b) 54%.

Filed Under: Genetic Variation / Inheritance Tagged With: Band 4, Band 5, smc-3648-50-Meiosis

BIOLOGY, M8 2024 HSC 29

An epidemiological study was conducted to help model how many people will be affected by Type 2 diabetes globally in the future. Continuous data were collected from 1990 to 2020. From that data, the following data points were chosen to demonstrate the trend.

\begin{array} {|c|c|}
\hline
\rule{0pt}{2.5ex} \textit{Year} \rule[-1ex]{0pt}{0pt} & \textit{Percentage of population affected} \\
\rule{0pt}{2.5ex} \textit{} \rule[-1ex]{0pt}{0pt} & \textit{by Type 2 diabetes (%)} \\
\hline
\rule{0pt}{2.5ex} \text{1990} \rule[-1ex]{0pt}{0pt} & \text{3.1} \\
\hline
\rule{0pt}{2.5ex} \text{2000} \rule[-1ex]{0pt}{0pt} & \text{3.7} \\
\hline
\rule{0pt}{2.5ex} \text{2010} \rule[-1ex]{0pt}{0pt} & \text{4.3} \\
\hline
\rule{0pt}{2.5ex} \text{2010} \rule[-1ex]{0pt}{0pt} & \text{5.6} \\
\hline
\end{array}

  1. Plot the data on the grid provided and include the line of best fit.   (2 marks)
     

  1. A prediction of the global population numbers suggests there will be about 9 billion \((9\ 000\ 000\ 000)\) people on the planet by 2040.

    Predict the number of people that will be affected by diabetes in 2040. Show working on your graph on the previous page and your calculations.   (3 marks)

--- 3 WORK AREA LINES (style=lined) ---

Show Answers Only

a.   

b.   630 000 000 (630 million)

Show Worked Solution

a.   

♦ Mean mark (a) 56%.

b.   Using the LOBF on the graph:

Population (%) with diabetes in 2040 = 7%

People with diabetes in 2040 = \(\dfrac{7}{100} \times 9\ 000\ 000\ 000 = 630\ 000\ 000\)

Filed Under: Causes and Effects, Epidemiology Tagged With: Band 4, Band 5, smc-3660-11-Environmental/Nutritional, smc-3660-50-Draw graph, smc-3661-10-Analysing Results

BIOLOGY, M8 2024 HSC 31

A study monitored the changes in the body temperature of a kookaburra (an Australian bird) and a human over a 24-hour period. The results of the study are shown in the graph.
 

  1. At what time was the kookaburra's body temperature the lowest?   (1 mark)

--- 2 WORK AREA LINES (style=lined) ---

  1. Some endothermic organisms can display torpor (a significant decrease in physiological activity).

    With reference to the graph, explain whether the human or the kookaburra was displaying torpor and if so, state the time this occurred.   (3 marks)

--- 7 WORK AREA LINES (style=lined) ---

  1. Outline an adaptation that may lead to an increase in the kookaburra's body temperature during the inactive period.   (2 marks)

--- 4 WORK AREA LINES (style=lined) ---

Show Answers Only

a.   4 am

b.   Signs of torpor:

  • The human maintained a steady body temperature throughout the observed period, showing no signs of torpor or reduced physiological activity
  • In contrast, the kookaburra exhibited classic torpor behaviour.
  • Its body temperature dropped significantly between 5 pm and 4 am, demonstrating the characteristic reduction in physiological functions during this period.

c.   Kookaburra adaptation:

  • Kookaburras have an effective insulation mechanism where they puff out their feathers, creating space between them.
  • This fluffing action traps a layer of warm air between the feathers and the bird’s body, forming an insulating barrier
  • The trapped air pocket acts like natural insulation, minimising heat loss and helping the kookaburra maintain its body temperature efficiently.

Show Worked Solution

a.   4 am

b.   Signs of torpor:

  • The human maintained a steady body temperature throughout the observed period, showing no signs of torpor or reduced physiological activity
  • In contrast, the kookaburra exhibited classic torpor behaviour.
  • Its body temperature dropped significantly between 5 pm and 4 am, demonstrating the characteristic reduction in physiological functions during this period.
Mean mark (b) 56%.

c.   Kookaburra adaptation:

  • Kookaburras have an effective insulation mechanism where they puff out their feathers, creating space between them.
  • This fluffing action traps a layer of warm air between the feathers and the bird’s body, forming an insulating barrier
  • The trapped air pocket acts like natural insulation, minimising heat loss and helping the kookaburra maintain its body temperature efficiently.
♦ Mean mark (c) 47%.

Filed Under: Homeostasis Tagged With: Band 2, Band 4, Band 5, smc-3659-15-Temperature, smc-3659-20-Adaptations/Endotherms

BIOLOGY, M5 2024 HSC 30

The diagram shows a simplified version of the process of polypeptide synthesis.
 

  1. Compare Process \(A\) with DNA replication.   (3 marks)

    --- 6 WORK AREA LINES (style=lined) ---

  2. Explain the importance of mRNA and tRNA in polypeptide synthesis.   (5 marks)

    --- 13 WORK AREA LINES (style=lined) ---

Show Answers Only

a.   Process \(A\) vs DNA replication:

  • Both DNA replication and transcription (Process \(A\)) begin with unwinding the DNA double helix.
  • DNA replication’s goal is to create two identical DNA molecules, with each containing one original and one new strand.
  • In contrast, transcription copies just one DNA strand to produce a single mRNA strand.
     

b.   mRNA and tRNA’s role in polypeptide synthesis:

  • mRNA is created in the nucleus by copying a DNA template during transcription.
  • This mRNA molecule serves as a messenger, carrying genetic instructions (in the form of codons) from the nucleus out to ribosomes in the cytoplasm.
  • At the ribosome, translation kicks in – this is where the genetic code gets converted into protein.
  • tRNA molecules are key players here – each has an anticodon that matches up with specific codons on the mRNA strand.
  • The process flows like an assembly line: mRNA codons are read in sequence, tRNA molecules bring in matching amino acids, and these amino acids are linked together to form a polypeptide chain.

Show Worked Solution

a.   Process \(A\) vs DNA replication:

  • Both DNA replication and transcription (Process \(A\)) begin with unwinding the DNA double helix.
  • DNA replication’s goal is to create two identical DNA molecules, with each containing one original and one new strand.
  • In contrast, transcription copies just one DNA strand to produce a single mRNA strand.

b.   mRNA and tRNA’s role in polypeptide synthesis:

  • mRNA is created in the nucleus by copying a DNA template during transcription.
  • This mRNA molecule serves as a messenger, carrying genetic instructions (in the form of codons) from the nucleus out to ribosomes in the cytoplasm.
  • At the ribosome, translation kicks in – this is where the genetic code gets converted into protein.
  • tRNA molecules are key players here – each has an anticodon that matches up with specific codons on the mRNA strand.
  • The process flows like an assembly line: mRNA codons are read in sequence, tRNA molecules bring in matching amino acids, and these amino acids are linked together to form a polypeptide chain.
♦ Mean mark (b) 60%.

Filed Under: DNA and Polypeptide Synthesis Tagged With: Band 4, Band 5, smc-3650-11-RNA, smc-3650-20-Translation, smc-3650-30-Transcription

BIOLOGY, M7 2024 HSC 27

Milk pasteurisation (heating to approximately 70°C) was gradually introduced in America from the early 1900s. The graph shows the number of disease outbreaks in relation to raw (unpasteurised) and pasteurised milk in America from 1900-1975.
 

Explain the trends observed in the graph. In your response, refer to the role of Pasteur's work in pasteurisation.   (5 marks)

--- 13 WORK AREA LINES (style=lined) ---

Show Answers Only
  • Louis Pasteur’s research was pivotal in debunking the theory of spontaneous generation and establishing our understanding of microorganisms.
  • His work revealed that microbes present in milk could be responsible for disease outbreaks.
  • He demonstrated that exposing substances to high temperatures effectively kills microorganisms, which is why heating milk to 70°C eliminates many harmful bacteria.
  • This scientific foundation – the presence of microbes in milk and their vulnerability to heat – explains the effectiveness of milk pasteurisation in preventing disease outbreaks.
  • The historical data presented in the graph supports this, showing significantly fewer disease outbreaks linked to pasteurised milk compared to raw milk.
  • A notable decline in raw milk-related outbreaks occurred after 1945, though this may also be attributed to decreased raw milk consumption during that period.
  • While pasteurised milk has generally proven safer, some disease outbreaks have still occurred with pasteurised products. These cases typically result from issues in the pasteurisation process itself or problems during subsequent storage and transportation of the milk.
Show Worked Solution
  • Louis Pasteur’s research was pivotal in debunking the theory of spontaneous generation and establishing our understanding of microorganisms.
  • His work revealed that microbes present in milk could be responsible for disease outbreaks.
  • He demonstrated that exposing substances to high temperatures effectively kills microorganisms, which is why heating milk to 70°C eliminates many harmful bacteria.
  • This scientific foundation – the presence of microbes in milk and their vulnerability to heat – explains the effectiveness of milk pasteurisation in preventing disease outbreaks.
  • The historical data presented in the graph supports this, showing significantly fewer disease outbreaks linked to pasteurised milk compared to raw milk.
  • A notable decline in raw milk-related outbreaks occurred after 1945, though this may also be attributed to decreased raw milk consumption during that period.
  • While pasteurised milk has generally proven safer, some disease outbreaks have still occurred with pasteurised products. These cases typically result from issues in the pasteurisation process itself or problems during subsequent storage and transportation of the milk.

Filed Under: Causes of Infectious Disease, Prevention, Treatment and Control Tagged With: Band 4, Band 5, smc-3655-60-Louis Pasteur, smc-3658-30-Procedures to Prevent Spread, smc-3658-40-Interpreting Data

BIOLOGY, M7 2024 HSC 26

Describe a plant disease and its effect on agricultural production.   (4 marks)

--- 8 WORK AREA LINES (style=lined) ---

Show Answers Only

Two possible examples (among many) are described below.

Plant disease: Wheat rust

  • Wheat rust is a fungal disease that produces reddish-brown pustules on wheat stems and leaves, weakening the plant and reducing grain development.
  • This disease can devastate entire wheat crops, significantly reducing grain yields and causing major economic losses for Australian grain producers. 

Plant disease: Stone fruit scab

  • Caused by fungi, produces dark spots on plums, peaches and nectarines that develop into scabs, potentially cracking and destroying the fruit.
  • This disease significantly impacts crop quality and yield, resulting in economic losses for farmers.
Show Worked Solution

Two possible examples (among many) are described below.

Plant disease: Wheat rust

  • Wheat rust is a fungal disease that produces reddish-brown pustules on wheat stems and leaves, weakening the plant and reducing grain development.
  • This disease can devastate entire wheat crops, significantly reducing grain yields and causing major economic losses for Australian grain producers. 

Plant disease: Stone fruit scab

  • Caused by fungi, produces dark spots on plums, peaches and nectarines that develop into scabs, potentially cracking and destroying the fruit.
  • This disease significantly impacts crop quality and yield, resulting in economic losses for farmers.

Filed Under: Causes of Infectious Disease Tagged With: Band 4, smc-3655-55-Agricultural Production

BIOLOGY, M6 2024 HSC 25

  1. One-Eyed Jack was a rescue dog that had been injured and lost an eye before his owner adopted him. One-Eyed Jack was cloned and the clone was born with two eyes.

  2. Explain why the cloned dog was born with two eyes.   (2 marks)

    --- 4 WORK AREA LINES (style=lined) ---

  3. Describe how animals like dogs can be cloned.   (4 marks)

    --- 8 WORK AREA LINES (style=lined) ---

Show Answers Only

a.   Reason(s) the cloned dog had two eyes:

  • The DNA used for cloning came from One-Eyed Jack’s somatic (body) cells which contained the complete genetic code for normal eye development.
  • The physical injury that caused Jack to lose his eye did not alter his genes, so it wasn’t passed on to the clone. 

b.   Animal cloning process:

  • The cloning process begins by removing the nucleus from a host egg cell.
  • This is replaced with the nucleus from a body cell of the animal to be cloned.
  • This produces a zygote.
  • After electrical stimulation causes the reconstructed cell to begin dividing, it is implanted into a surrogate mother’s uterus.
  • It then develops into a cloned offspring.

Show Worked Solution

a.   Reason(s) the cloned dog had two eyes:

  • The DNA used for cloning came from One-Eyed Jack’s somatic (body) cells which contained the complete genetic code for normal eye development.
  • The physical injury that caused Jack to lose his eye did not alter his genes, so it wasn’t passed on to the clone.  

b.   Animal cloning process:

  • The cloning process begins by removing the nucleus from a host egg cell.
  • This is replaced with the nucleus from a body cell of the animal to be cloned.
  • This produces a zygote.
  • After electrical stimulation causes the reconstructed cell to begin dividing, it is implanted into a surrogate mother’s uterus.
  • It then develops into a cloned offspring.
♦ Mean mark (b) 52%.

Filed Under: Biotechnology, Genetic Technologies Tagged With: Band 3, Band 4, smc-3653-20-Evaluating Genetic Technology, smc-3654-70-Whole Organism Cloning

BIOLOGY, M8 2024 HSC 24

  1. Outline the cause of a disease due to environmental exposure.   (2 marks)

    --- 3 WORK AREA LINES (style=lined) ---

  2. Explain how an educational program or campaign can be used to decrease the incidence of a disease caused by environmental exposure.   (3 marks)

    --- 7 WORK AREA LINES (style=lined) ---

Show Answers Only

a.   Answers could include one of the following:

  • Lung cancer can be caused by exposure to inhalation of smoke from cigarettes.
  • Environmental exposure to asbestos can result in some microscopic fibres becoming lodged in the lining of a person’s lungs and cause mesothelioma (cancer).

b.   Educational program on the dangers of UV radiation:

  • An educational program in schools could teach students about the link between UV exposure and skin cancer, emphasising protection through hats and sunscreen.
  • This preventative approach helps students understand the risks and increases the chances of them modifying their behaviour to be more sun safe.
  • Overall, the program should contribute to less DNA damage in cells of participants and a reduction in their chances of developing skin cancer.
Show Worked Solution

a.   Answers could include one of the following:

  • Lung cancer can be caused by exposure to inhalation of smoke from cigarettes.
  • Environmental exposure to asbestos can result in some microscopic fibres becoming lodged in the lining of a person’s lungs and cause mesothelioma (cancer).

b.   Educational program on the dangers of UV radiation:

  • An educational program in schools could teach students about the link between UV exposure and skin cancer, emphasising protection through hats and sunscreen.
  • This preventative approach helps students understand the risks and increases the chances of them modifying their behaviour to be more sun safe.
  • Overall, the program should contribute to less DNA damage in cells of participants and a reduction in their chances of developing skin cancer.

Filed Under: Causes and Effects, Prevention Tagged With: Band 3, Band 4, smc-3660-11-Environmental/Nutritional, smc-3662-11-Educational Programs

BIOLOGY, M6 2024 HSC 23

Outline how ONE type of electromagnetic radiation can cause a germline mutation.   (2 marks)

--- 4 WORK AREA LINES (style=lined) ---

Show Answers Only

Answers could include one of the following:

X-Ray Radiation

  • X-rays can cause damage to DNA, breaking chemical bonds and leading to mutations.
  • When this occurs in gametes (sex cells), the mutation will be passed on to future generations.

UV radiation

  • UV radiation can cause adjacent thymine bases in DNA to form incorrect bonds called dimers.
  • When this damage occurs in sperm or egg cells, these mutations can be inherited by offspring.
Show Worked Solution

Answers could include one of the following:

X-Ray Radiation

  • X-rays can cause damage to DNA, breaking chemical bonds and leading to mutations.
  • When this occurs in gametes (sex cells), the mutation will be passed on to future generations.

UV radiation

  • UV radiation can cause adjacent thymine bases in DNA to form incorrect bonds called dimers.
  • When this damage occurs in sperm or egg cells, these mutations can be inherited by offspring.
Mean mark 56%.

Filed Under: Mutation Tagged With: Band 4, smc-3652-20-Somatic vs. Germ-Line, smc-3652-55-Mutation in Reproduction

BIOLOGY, M7 2024 HSC 22

A student designed and conducted a practical investigation to test for the presence of microbes in water and food samples.

  1. Justify a safety precaution required to prevent infection when conducting the investigation.   (2 marks)

--- 4 WORK AREA LINES (style=lined) ---

  1. Explain how the student could ensure the reliability of the investigation.   (2 marks)

--- 4 WORK AREA LINES (style=lined) ---

Show Answers Only

a.   Answers could include one of the following:

  • Wearing gloves when handling samples is essential to stop pathogens in the water/food entering through cuts or abrasions on bare hands, potentially causing infection.
  • Disinfecting all equipment after use is necessary because microbes can multiply rapidly and contaminated materials could spread infectious organisms to others in the laboratory. 

b.   To ensure the reliability of the investigation:

  • Student should prepare multiple food/water samples for testing to ensure consistent results across repeated trials.
  • This process allows them to verify if their findings are reproducible and reliable rather than due to chance.

Show Worked Solution

a.   Answers could include one of the following:

  • Wearing gloves when handling samples is essential to stop pathogens in the water/food entering through cuts or abrasions on bare hands, potentially causing infection.
  • Disinfecting all equipment after use is necessary because microbes can multiply rapidly and contaminated materials could spread infectious organisms to others in the laboratory. 

b.   To ensure the reliability of the investigation:

  • Student should prepare multiple food/water samples for testing to ensure consistent results across repeated trials.
  • This process allows them to verify if their findings are reproducible and reliable rather than due to chance.

Filed Under: Prevention, Treatment and Control Tagged With: Band 3, Band 4, smc-3658-70-Investigation design

BIOLOGY, M5 2024 HSC 20 MC

Analyse the following four pedigrees.
 

Which row in the table correctly identifies the pedigree with the type of inheritance?

\begin{align*}
\begin{array}{l}
\ & \\
\\
\\
\rule{0pt}{2.5ex}\textbf{A.}\rule[-1ex]{0pt}{0pt}\\
\rule{0pt}{2.5ex}\textbf{B.}\rule[-1ex]{0pt}{0pt}\\
\rule{0pt}{2.5ex}\textbf{C.}\rule[-1ex]{0pt}{0pt}\\
\rule{0pt}{2.5ex}\textbf{D.}\rule[-1ex]{0pt}{0pt}\\
\\
\end{array}
\begin{array}{|c|c|}
\hline
\rule{0pt}{2.5ex}\textit{Autosomal} & \textit{Sex-linked} & \textit{Autosomal} & \textit{Sex-linked} \\
\textit{dominant} \rule[-1ex]{0pt}{0pt} & \textit{dominant} & \textit{recessive} & \textit{recessive} \\
\hline
\rule{0pt}{2.5ex}\text{2} \rule[-1ex]{0pt}{0pt}& \text{1} & \text{3} & \text{4} \\
\hline
\rule{0pt}{2.5ex}\text{1} \rule[-1ex]{0pt}{0pt}& \text{4} & \text{2} & \text{3} \\
\hline
\rule{0pt}{2.5ex}\text{1} \rule[-1ex]{0pt}{0pt}& \text{3} & \text{2} & \text{4} \\
\hline
\rule{0pt}{2.5ex}\text{2} \rule[-1ex]{0pt}{0pt} & \text{4} & \text{1} & \text{3} \\
\hline
\end{array}
\end{align*}

Show Answers Only

\(C\)

Show Worked Solution

Consider Pedigree 1:

  • Both parents affected, daughter unaffected (received recessive alleles from each parent).
  • Trait autosomal dominant (eliminate \(A\) and \(D\)).

Consider Pedigree 3:

  • Father affected, mother unaffected, all daughters affected, all sons unaffected. Trait sex linked with all daughters inheriting one dominant allele (from father) and one recessive (from mother).

\(\Rightarrow C\)

Filed Under: Genetic Variation / Inheritance Tagged With: Band 4, smc-3648-10-Pedigrees, smc-3648-30-Sex Linkage, smc-3648-35-Autosomal

BIOLOGY, M7 2024 HSC 15 MC

The graph shows the number of cases of Swine Flu (a viral respiratory illness) from May to July 2009 in Australia.
 

What effective control measures could have been introduced between May and July to limit the spread of the disease in Australia?

\begin{align*}
\begin{array}{l}
\ & \\
\\
\textbf{A.}\\
\\
\textbf{B.}\\
\textbf{C.}\\
\\
\textbf{D.}\\
\\
\\
\end{array}
\begin{array}{|l|l|}
\hline
\ \ \ \ \ \ \ \ \ \ \ \ \ \ \ \ \ \ \ \ \ \ \textit{May-June} & \ \ \ \ \ \ \ \ \  \ \ \ \ \ \ \ \ \ \ \ \textit{July} \\
\hline
\text{Quarantine all people arriving in} & \text{Encourage people to wear masks and } \\
\text{Australia} & \text{wash hands regularly} \\
\hline
\text{Issue antibiotics to overseas visitors} & \text{Isolate people with symptoms} \\
\hline
\text{Encourage people to wear masks and } & \text{Quarantine all people arriving in} \\
\text{wash hands regularly} & \text{Australia} \\
\hline
\text{Isolate people with symptoms} & \text{Vaccinate all people arriving in} \\
\text{} & \text{Australia} \\
\hline
\end{array}
\end{align*}

Show Answers Only

\(A\)

Show Worked Solution
  • Cases from new arrivals peaked in the May-Jun period. Quarantine would be a good strategy for limiting the spread of the disease at this stage.
  • In the July period, locally acquired cases dominate the total number of cases. At this stage, masks and hand washing are effective control measures. It is too late for quarantine, isolation and vaccination to be effective at this advanced stage.

\(\Rightarrow A\)

Filed Under: Prevention, Treatment and Control Tagged With: Band 4, smc-3658-30-Procedures to Prevent Spread

CHEMISTRY, M7 2024 HSC 24

The boiling points for two series of compounds are listed.


  1. Plot the boiling points for each series of compounds against the number of carbon atoms per molecule.   (3 marks)

    --- 0 WORK AREA LINES (style=lined) ---

  1. With reference to hydrogen bonding and dispersion forces, explain the trends in the boiling point data of these compounds, within each series and between the series.   (4 marks)

    --- 12 WORK AREA LINES (style=lined) ---

Show Answers Only

a.     

b.     The alcohols have higher boiling points than amines of the same chain length.

  • Both alcohols and amines have polar hydrogen bonding as a result of the \(\ce{OH}\) and \(\ce{NH2}\) functional groups respectively.
  • Oxygen molecules have higher electronegativity than nitrogen molecules making the hydrogen bonding in the alcohols significantly stronger than the hydrogen bonding in amines.
  • Since the dispersion forces in amines and alcohols of the same chain length are very similar, the difference in the strength of the intermolecular bonding is dependent on the strength of the hydrogen bonding.
  • Therefore, a larger amount of thermal energy is required to separate the alcohol molecules resulting in higher boiling points than amines. 

As the chain length of the alcohols and amines increase, the boiling points also increase.

  • When the chain length increases, the number of electrons in the molecules also increase which corresponds to a larger number of dispersion forces between neighbouring molecules.
  • The stronger dispersion forces between the molecules increase the overall strength of the intermolecular forces in both the alcohols and amines therefore leading to higher boiling points as chain length increases.

Show Worked Solution

a.   


b.     The alcohols have higher boiling points than amines of the same chain length.

  • Both alcohols and amines have polar hydrogen bonding as a result of the \(\ce{OH}\) and \(\ce{NH2}\) functional groups respectively.
  • Oxygen molecules have higher electronegativity than nitrogen molecules making the hydrogen bonding in the alcohols significantly stronger than the hydrogen bonding in amines.
  • Since the dispersion forces in amines and alcohols of the same chain length are very similar, the difference in the strength of the intermolecular bonding is dependent on the strength of the hydrogen bonding.
  • Therefore, a larger amount of thermal energy is required to separate the alcohol molecules resulting in higher boiling points than amines.

As the chain length of the alcohols and amines increase, the boiling points also increase.

  • When the chain length increases, the number of electrons in the molecules also increase which corresponds to a larger number of dispersion forces between neighbouring molecules.
  • The stronger dispersion forces between the molecules increase the overall strength of the intermolecular forces in both the alcohols and amines therefore leading to higher boiling points as chain length increases.

Filed Under: Reactions of Organic Acids and Bases Tagged With: Band 3, Band 4, smc-3680-20-Formulae and Properties, smc-3680-30-Boiling Point and Solubility

CHEMISTRY, M8 2024 HSC 38

Compounds \(\text{A}\) and \(\text{B}\) are isomers with formula \(\ce{C3H7X}\), where \(\ce{X}\) is a halogen. The mass spectrum for compound \(\text{A}\) is shown.


Compounds \(\text{A}\) and \(\text{B}\) undergo substitution reactions in the presence of hydroxide ions, producing alcohols \(\text{C}\) and \(\text{D}\). Compound \(\text{D}\) can be oxidised to a ketone; compound \(\text{C}\) can also be oxidised, but does not produce a ketone.
 

Compound \(\text{E}\) can be produced by refluxing 3-methylbutanoic acid, with one of the alcohols \(\text{C}\) or \(\text{D}\), in the presence of a catalyst.

The \({ }^1 \text{H NMR}\) spectrum for compound \(\text{E}\) contains the following features.
 

Draw the structure of compounds \(\text{A}\), \(\text{B}\) and \(\text{E}\). Explain your answer with reference to the information provided.   (7 marks)


--- 20 WORK AREA LINES (style=lined) ---

Show Answers Only


  • The mass spectrum has two peaks to the far right of the spectrum of similar height at 122 m/z and 124 m/z. This is due to the halogen having two isotopes with the same relative abundance.
  • Isotope \(\ce{X}\) must be bromine, whose isotopes are \(\ce{Br-79}\) and \(\ce{Br-81}\). The two molecular ion peaks both correspond correctly to the molar mass of the parent molecule, \(\ce{C3H7Br}\), depending on which isomer is present in the compound.
  •    \(MM\ce{(C3H7Br-79)} = 3 \times 12 + 1 \times 7 + 79 = 122\)
  •    \(MM\ce{(C3H7Br-81)} = 3 \times 12 + 1 \times 7 + 81 = 124\)
  • The two isomers of \(\ce{C3H7Br}\) are 1-bromopropane and 2-bromopropane and when they undergo a substitution reaction with \(\ce{OH^{-}}\), they will produce propan-1-ol and propan-2-ol respectively. 
  • Only secondary alcohols will oxidise to produce a ketone. Hence compound \(\text{D}\) must be propan-2-ol and compound \(\text{C}\) must be propan-1-ol which can be oxidised to an aldehyde and the aldehyde can be oxidised to a carboxylic acid.
  • Therefore, compound \(\text{B}\) is 2-bromopropane and compound \(\text{A}\) is 1-bromopropane as during the substitution reaction the bromine atom is substituted with the hydroxide ion.
  • When 3-methylbutanoic acid is reacted with alcohol \(\text{C}\) (propan-1-ol) the following reaction takes place:

  • When 3-methylbutanoic acid is reacted with alcohol \(\text{D}\) (propan-2-ol) the following reaction takes place:

  • There are 6 unique hydrogen environments present in compound \(\text{E}\). Therefore compound \(\text{E}\) must be the ester produced in the reaction between 3-methylbutanoic acid and propan-1-ol (it has 6 hydrogen environments vs propan-2-ol ester which has 5).
  • Compound \(\text{E}\) is propyl 3-methylbutanoate.
  • This can be confirmed by the integration (ratio of hydrogens in each environment) and peak splitting columns (number of  splits = number of adjacent hydrogens + 1)
  • The shift at 0.96 is due to environment 1 which has six hydrogen atoms and has one neighbouring hydrogen atom (produces a doublet).
  • The shift at 2.1 is due to environment 2 which has one hydrogen 1 atom and has 8 neighbouring hydrogen atoms a (produces a mutliplet of 9)(.
  • The shift at 4.0 is due to environment 4. This \(\ce{CH2}\) group is bonded to an oxygen atom corresponding to a large chemical shift between 3.2–5.0. It also has 2 neighbouring hydrogens and so produces a triplet.
  • Other answers could have included a further explanation regarding the integration and peak splitting of all the hydrogen environments and their relative chemical shifts.

Show Worked Solution


  • The mass spectrum has two peaks to the far right of the spectrum of similar height at 122 m/z and 124 m/z. This is due to the halogen having two isotopes with the same relative abundance.
  • Isotope \(\ce{X}\) must be bromine, whose isotopes are \(\ce{Br-79}\) and \(\ce{Br-81}\). The two molecular ion peaks both correspond correctly to the molar mass of the parent molecule, \(\ce{C3H7Br}\), depending on which isomer is present in the compound.
  •    \(MM\ce{(C3H7Br-79)} = 3 \times 12 + 1 \times 7 + 79 = 122\)
  •    \(MM\ce{(C3H7Br-81)} = 3 \times 12 + 1 \times 7 + 81 = 124\)
  • The two isomers of \(\ce{C3H7Br}\) are 1-bromopropane and 2-bromopropane and when they undergo a substitution reaction with \(\ce{OH^{-}}\), they will produce propan-1-ol and propan-2-ol respectively. 
  • Only secondary alcohols will oxidise to produce a ketone. Hence compound \(\text{D}\) must be propan-2-ol and compound \(\text{C}\) must be propan-1-ol which can be oxidised to an aldehyde and the aldehyde can be oxidised to a carboxylic acid.
  • Therefore, compound \(\text{B}\) is 2-bromopropane and compound \(\text{A}\) is 1-bromopropane as during the substitution reaction the bromine atom is substituted with the hydroxide ion.
  • When 3-methylbutanoic acid is reacted with alcohol \(\text{C}\) (propan-1-ol) the following reaction takes place:

  • When 3-methylbutanoic acid is reacted with alcohol \(\text{D}\) (propan-2-ol) the following reaction takes place:

  • There are 6 unique hydrogen environments present in compound \(\text{E}\). Therefore compound \(\text{E}\) must be the ester produced in the reaction between 3-methylbutanoic acid and propan-1-ol (it has 6 hydrogen environments vs propan-2-ol ester which has 5).
  • Compound \(\text{E}\) is propyl 3-methylbutanoate.
  • This can be confirmed by the integration (ratio of hydrogens in each environment) and peak splitting columns (number of  splits = number of adjacent hydrogens + 1)
  • The shift at 0.96 is due to environment 1 which has six hydrogen atoms and has one neighbouring hydrogen atom (produces a doublet).
  • The shift at 2.1 is due to environment 2 which has one hydrogen 1 atom and has 8 neighbouring hydrogen atoms a (produces a mutliplet of 9)(.
  • The shift at 4.0 is due to environment 4. This \(\ce{CH2}\) group is bonded to an oxygen atom corresponding to a large chemical shift between 3.2–5.0. It also has 2 neighbouring hydrogens and so produces a triplet.
  • Other answers could have included a further explanation regarding the integration and peak splitting of all the hydrogen environments and their relative chemical shifts.
♦ Mean mark 52%.

Filed Under: Organic Substances Tagged With: Band 4, Band 5, smc-3683-50-Combining Techniques

CHEMISTRY, M5 2024 HSC 37

The relationship between the equilibrium constant, \(K_{eq}\), and \(\Delta G^{\circ}\) for any reaction is shown in the graph, for a limited range of  \(\Delta G^{\circ}\) values.


The \(\Delta H^{\circ}\) and \(T \Delta S^{\circ}\) values for the reaction between copper\(\text{(I)}\) sulfide and oxygen are provided.

\(\ce{Cu2S(s) +O2(g) \rightarrow 2Cu(s) +SO2(g) \quad \quad}\) \(\Delta H^{\circ}=-217 \text{ kJ mol}^{-1}\)
\(\Delta S^{\circ}=-3 \text{ kJ mol}^{-1}\)

Explain, with reference to the information provided, why this reaction proceeds to completion rather than coming to equilibrium.   (3 marks)

--- 10 WORK AREA LINES (style=lined) ---

Show Answers Only

Calculating \(\Delta G\):

   \(\Delta G = \Delta H-T\Delta S=-217-(-3)=-214\ \text{kJ mol}^{-1}\)

  • The graph shows that large negative values of \(\Delta G\) correspond to large \(K_{eq}\) values. Large \(K_{eq}\) values represent that the concentration of the products is significantly higher than the concentration of the reactants. i.e. the reaction runs to completion.
  • The \(\Delta G\) value for the reaction (see above) is significantly negative and would correspond to a significantly high \(K_{eq}\) value. 
  • This reaction proceeds to completion primarily because of its significantly large, negative \(\Delta H\) value, while the \(T\Delta S\) term is relatively small and has minimal influence.
Show Worked Solution

Calculating \(\Delta G\):

   \(\Delta G = \Delta H-T\Delta S=-217-(-3)=-214\ \text{kJ mol}^{-1}\)

  • The graph shows that large negative values of \(\Delta G\) correspond to large \(K_{eq}\) values. Large \(K_{eq}\) values represent that the concentration of the products is significantly higher than the concentration of the reactants. i.e. the reaction runs to completion.
  • The \(\Delta G\) value for the reaction (see above) is significantly negative and would correspond to a significantly high \(K_{eq}\) value. 
  • This reaction proceeds to completion primarily because of its significantly large, negative \(\Delta H\) value, while the \(T\Delta S\) term is relatively small and has minimal influence.

Filed Under: Static and Dynamic Equilibrium Tagged With: Band 4, smc-3669-20-Entropy/Enthalpy

Networks, GEN2 2024 VCAA 15

An upgrade to the supermarket requires the completion of 11 activities, \(A\) to \(K\).

The directed network below shows these activities and their completion time, in weeks.

The minimum completion time for the project is 29 weeks.


  1. Write down the critical path.   (1 mark)

    --- 1 WORK AREA LINES (style=lined) ---

  2. Which activity can be delayed for the longest time without affecting the minimum completion time of the project?   (1 mark)

    --- 1 WORK AREA LINES (style=lined) ---

Use the following information to answer parts c-e.

A change is made to the order of activities.

The table below shows the activities and their new latest starting times in weeks.

\begin{array}{|c|c|}
\hline
\textbf{Activity} & \textbf{Latest Starting}\\
&\textbf{time} \text{(weeks)}\\
\hline A & 0 \\
\hline B & 2 \\
\hline C & 10 \\
\hline D & 9 \\
\hline E & 13 \\
\hline F & 14 \\
\hline G & 18 \\
\hline H & 17 \\
\hline I & 19 \\
\hline J & 25 \\
\hline K & 22 \\
\hline
\end{array}

A dummy activity is now required in the network.

  1. On the directed network below, draw a directed edge to represent the dummy activity. Include a label.  (1 mark)

    --- 1 WORK AREA LINES (style=lined) ---


  1. What is the new minimum completion time of the project?  (1 mark)

    --- 1 WORK AREA LINES (style=lined) ---

  2. The owners of the supermarket want the project completed earlier.
  3. They will pay to reduce the time of some of the activities.
  4. A reduction in completion time of an activity will incur an additional cost of $10 000 per week.
  5. Activities can be reduced by a maximum of two weeks.
  6. The minimum number of weeks an activity can be reduced to is seven weeks.
  7. What is the minimum amount the owners of the supermarket will have to pay to reduce the completion time of the project as much as possible?   (1 mark)

    --- 1 WORK AREA LINES (style=lined) ---

Show Answers Only

a.    \(A, C, H, J\)

b.    \(\text{Activity E}\)

c.    

d.    \(\text{30 weeks}\)

e.    \($50\,000\)

Show Worked Solution

a.    \(\text{Critical path:  }A, C, H, J\)


b.    
\(\text{Activity with the largest float time can be delayed the longest.}\)

\(\text{Consider Activity E:}\)

\(\text{EST = 11, LST}= 18-4=14\rightarrow\ \text{Float time = 3 weeks}\)

\(\therefore\ \text{Activity E can be delayed the longest.}\)
 

♦♦ Mean mark (b) 34%.

c.    

♦♦♦ Mean mark (c) 10%.

d.    \(\text{New minimum completion time is 30 weeks.}\)
 

♦♦♦ Mean mark (d) 27%.

e.    \(\text{Activities that can be reduced:}\)

\(-A\ \text{can be reduced by 2 weeks}\)

\(-B, D\ \text{can each be reduced by 1 week each}\)

\(-H\ \text{can be reduced by 1 week}\)

\(\text{Total reduction = 5 weeks}\)

\(\Rightarrow \ \text{Minimum payment}=$50\,000\)

♦♦♦ Mean mark (e) 7%.

Filed Under: Critical Path Analysis Tagged With: Band 4, Band 5, Band 6, smc-621-20-Critical Paths/EST, smc-621-40-Crashing/Reduce completion time, smc-621-45-Adding activities, smc-621-50-Dummy activities

CHEMISTRY, M7 2024 HSC 35

Unknown samples of three carboxylic acids, labelled \(\text{X , Y}\) and \(\text{Z}\), are analysed to determine their identities.

  • Both \(\text{Y}\) and \(\text{Z}\) react rapidly with bromine in the absence of UV light, but \(\text{X}\) does not. A 0.100 g sample of \(\text{Y}\) reacts with the same amount of bromine as a 0.200 g sample of \(\text{Z}\).
  • Separate 0.100 g samples of \(\text{X , Y}\) and \(\text{Z}\) are titrated with 0.0617 mol L\(^{-1}\) sodium hydroxide solution. The titre volumes are shown.

\(
\begin{array}{|l|c|c|c|}
\hline \textit{Acid } & X & Y & Z \\
\hline \begin{array}{l}
\text {Volume of } \ce{NaOH \text{(mL)}} \\
\end{array} & 21.88 & 22.49 & 22.49 \\
\hline
\end{array}
\)
 

  • Both \(\text{Y}\) and \(\text{Z}\) can undergo hydration reactions in the presence of a suitable catalyst. Two products are possible for the hydration of \(\text{Y}\), but only one product is possible with \(\text{Z}\).

Identify which structures 1, 2 and 3 in the table are acids \(\text{X , Y}\) and \(\text{Z}\). Justify your answer with reference to the information provided.   (7 marks)


--- 22 WORK AREA LINES (style=lined) ---

Show Answers Only

  • Both sample \(\text{Y}\) and \(\text{Z}\) undergo an addition reaction with bromine and a hydration reaction. Therefore these samples must contain a \(\ce{C=C}\) bond.
  • As sample \(\text{X}\), undergoes neither of these reactions, it must have no \(\ce{C=C}\) bond, thus sample \(\text{X}\) is structure \(2\).
  • Both structure \(1\) and structure \(3\) contain 1 \(\ce{C=C}\) each \(\Rightarrow\) they will react in a \(1:1\) with \(\ce{Br2}\). Hence the same number of moles of the carboxylic acid samples will react with the bromine.
  • Since the mass of sample \(\text{Z}\) that reacts with the bromine is double the mass of sample \(\text{Y}\), the molar mass of sample \(\text{Z}\) must be double the molar mass of sample \(\text{Y}\) following the formula \(m = n \times MM\).
  • Therefore, sample \(\text{Y}\) is structure 1 and sample \(\text{Z}\) is structure 3.

Other information provided that could support identification includes:

  • The two products formed for the hydration of \(\text{Y}\) is due to the asymmetry of structure 1 and the single product formed in the hydration of \(\text{Z}\) is due to the symmetrical nature of structure 3.

The titration values are consistent with the proposed samples and their corresponding structures.

  • \(\ce{n(NaOH)}\) reacted with \(\text{X} = 0.0617 \times 0.02188 = 1.35 \times 10^{-3}\ \text{mol}\)
  • \(\text{n}_{\text{X}}= \dfrac{0.100}{74.078}= 0.00135\ \text{mol}\). Therefore \(\text{X}\) reacts in a \(1:1\) molar ratio as it is a monoprotic acid.
  • \(\ce{n(NaOH)}\) reacted with \(\text{Y}\) and \(\text{Z} = 0.0617 \times 0.02249 = 1.39 \times 10^{-3}\ \text{mol}\)
  • \(\text{n}_{\text{Y}}= \dfrac{0.100}{72.062}= 0.00139\ \text{mol}\). Therefore \(\text{Y}\) reacts in a \(1:1\) molar ratio as it is a monoprotic acid.
  • \(\text{n}_{\text{Z}}= \dfrac{0.100}{144.124}= 0.0006938\ \text{mol}\). Therefore \(\text{Z}\) reacts in a \(2:1\) molar ratio with \(\ce{NaOH}\) as it is a diprotic acid.
  • The equal volumes of \(\text{Y}\) and \(\text{Z}\) used in the titration can be attributed to \(\text{Z}\) having twice the molar mass of \(\text{Y}\) and being a diprotic acid.

Show Worked Solution

  • Both sample \(\text{Y}\) and \(\text{Z}\) undergo an addition reaction with bromine and a hydration reaction. Therefore these samples must contain a \(\ce{C=C}\) bond.
  • As sample \(\text{X}\), undergoes neither of these reactions, it must have no \(\ce{C=C}\) bond, thus sample \(\text{X}\) is structure \(2\).
  • Both structure \(1\) and structure \(3\) contain 1 \(\ce{C=C}\) each \(\Rightarrow\) they will react in a \(1:1\) with \(\ce{Br2}\). Hence the same number of moles of the carboxylic acid samples will react with the bromine.
  • Since the mass of sample \(\text{Z}\) that reacts with the bromine is double the mass of sample \(\text{Y}\), the molar mass of sample \(\text{Z}\) must be double the molar mass of sample \(\text{Y}\) following the formula \(m = n \times MM\).
  • Therefore, sample \(\text{Y}\) is structure 1 and sample \(\text{Z}\) is structure 3.

Other information provided that could support identification includes:

  • The two products formed for the hydration of \(\text{Y}\) is due to the asymmetry of structure 1 and the single product formed in the hydration of \(\text{Z}\) is due to the symmetrical nature of structure 3.

The titration values are consistent with the proposed samples and their corresponding structures.

  • \(\ce{n(NaOH)}\) reacted with \(\text{X} = 0.0617 \times 0.02188 = 1.35 \times 10^{-3}\ \text{mol}\)
  • \(\text{n}_{\text{X}}= \dfrac{0.100}{74.078}= 0.00135\ \text{mol}\). Therefore \(\text{X}\) reacts in a \(1:1\) molar ratio as it is a monoprotic acid.
  • \(\ce{n(NaOH)}\) reacted with \(\text{Y}\) and \(\text{Z} = 0.0617 \times 0.02249 = 1.39 \times 10^{-3}\ \text{mol}\)
  • \(\text{n}_{\text{Y}}= \dfrac{0.100}{72.062}= 0.00139\ \text{mol}\). Therefore \(\text{Y}\) reacts in a \(1:1\) molar ratio as it is a monoprotic acid.
  • \(\text{n}_{\text{Z}}= \dfrac{0.100}{144.124}= 0.0006938\ \text{mol}\). Therefore \(\text{Z}\) reacts in a \(2:1\) molar ratio with \(\ce{NaOH}\) as it is a diprotic acid.
  • The equal volumes of \(\text{Y}\) and \(\text{Z}\) used in the titration can be attributed to \(\text{Z}\) having twice the molar mass of \(\text{Y}\) and being a diprotic acid.
♦ Mean mark 55%.

Filed Under: Hydrocarbons and Associated Reactions, Quantitative Analysis Tagged With: Band 4, Band 5, smc-3675-10-Titration, smc-3677-70-Reactions of Unsaturated Hydrocarbons

CHEMISTRY, M6 2024 HSC 34

An aqueous solution of ammonia is added to a solution containing hydrochloric acid. A plot of conductivity against volume of ammonia solution added is shown. The temperature of the solution is kept constant throughout and the conductivity of the solution is corrected for dilution.
 

The relative conductivities of some relevant ions are shown in the table.

\begin{array}{|l|c|}
\hline \textit{Ion } & \textit{Relative conductivity } \\
\hline \ce{H^{+}} & 4.76 \\
\hline \ce{OH^{-}} & 2.70 \\
\hline \ce{Cl^{-}} & 1.04 \\
\hline \ce{NH_4^{+}} & 1.00 \\
\hline
\end{array}

Explain the shape of the graph. Include TWO balanced chemical equations in your answer.   (4 marks)

--- 13 WORK AREA LINES (style=lined) ---

Show Answers Only

  • Initially, \(\ce{H^+(aq)}\) and \(\ce{Cl^-(aq)}\) are present in the solution. Due to the significant relative conductivity of \(\ce{H^+(aq)}\), the overall conductivity of the solution is high.
  • As ammonia is added to the solution prior to the equivalence point (below 4.5 mL), hydrochloric acid is neutralized by the addition of ammonia according to the reaction:
  •    \(\ce{H^+(aq) + NH3(aq) -> NH4^+(aq)}\)
  • This results in the replacement of \(\ce{H^+}\), which exhibit high conductivity, with \(\ce{NH4^+}\), which have lower conductivity. Solution conductivity decreases.
  • The conductivity at the equivalence point is the lowest as only \(\ce{Cl^-}\) and \(\ce{NH4^+}\) ions are present which both have low relative conductivities.
  • Beyond the equivalence point, the excess ammonia added reacts partially with water to form \(\ce{NH4^+}\) and \(\ce{OH^-}\) ions according to the equation:
  •    \(\ce{NH3(aq) + H2O(l) \rightleftharpoons NH4^+(aq) + OH^-(aq)}\)
  • Although these ions are more conductive than the reactant molecules, the ionisation of ammonia is limited due to the presence of \(\ce{NH4^+}\)​ ions already in the solution (as per Le Châtelier’s Principle).
  • Consequently, the conductivity increases only slightly after the equivalence point.

Show Worked Solution

  • Initially, \(\ce{H^+(aq)}\) and \(\ce{Cl^-(aq)}\) are present in the solution. Due to the significant relative conductivity of \(\ce{H^+(aq)}\), the overall conductivity of the solution is high.
  • As ammonia is added to the solution prior to the equivalence point (below 4.5 mL), hydrochloric acid is neutralized by the addition of ammonia according to the reaction:
  •    \(\ce{H^+(aq) + NH3(aq) -> NH4^+(aq)}\)
  • This results in the replacement of \(\ce{H^+}\), which exhibit high conductivity, with \(\ce{NH4^+}\), which have lower conductivity. Solution conductivity decreases.
  • The conductivity at the equivalence point is the lowest as only \(\ce{Cl^-}\) and \(\ce{NH4^+}\) ions are present which both have low relative conductivities.
  • Beyond the equivalence point, the excess ammonia added reacts partially with water to form \(\ce{NH4^+}\) and \(\ce{OH^-}\) ions according to the equation:
  •    \(\ce{NH3(aq) + H2O(l) \rightleftharpoons NH4^+(aq) + OH^-(aq)}\)
  • Although these ions are more conductive than the reactant molecules, the ionisation of ammonia is limited due to the presence of \(\ce{NH4^+}\)​ ions already in the solution (as per Le Châtelier’s Principle).
  • Consequently, the conductivity increases only slightly after the equivalence point.

Filed Under: Quantitative Analysis Tagged With: Band 4, smc-3675-20-Titration Curves and Conductivity Graphs

CHEMISTRY, M8 2024 HSC 33

Acetone can be reduced, as shown.
 

  1. Identify the shape around the central carbon atom in each molecule.   (2 marks)

    --- 4 WORK AREA LINES (style=lined) ---

  2. Explain how \({ }^{13} \text{C NMR}\) spectroscopy could be used to monitor the progress of this reaction.   (3 marks)

    --- 10 WORK AREA LINES (style=lined) ---

Show Answers Only

a.   Acetone:

  • Double bond and 2 single bonds coming off the central carbon atom  \(\Rightarrow\)  trigonal planar.

Product:

  • Contains single bonds coming off the central carbon atom (\Rightarrow\) tetrahedral. (Note: the hydrogen bonded to the central carbon atom in the product molecule is not shown due to the skeletal structure)

b.    \({ }^{13} \text{C NMR}\) Spectroscopy:

  • \({ }^{13} \text{C NMR}\) will differentiate between molecules with different carbon environments. This produces different signals on the \({ }^{13} \text{C NMR}\) spectrum.
  • The acetone would produce two signals on the \({ }^{13} \text{C NMR}\) spectrum. The first signal would be due to the \(\ce{CH3}\) groups either side of the central carbon between 20-50 ppm. The second signal would be from the carbonyl group between 190-220 ppm.
  • The product of the reduction would also produce two signals on the \({ }^{13} \text{C NMR}\) spectrum. The carbon with the hydroxyl group attached to it would produce a signal between 50-90 ppm and the \(\ce{CH3}\) groups either side would produce a signal between 5-40 ppm.
  • The reaction can be monitored by observing the disappearance of the carbonyl signal (190-220 ppm) and appearance of the hydroxyl signal (50-90 ppm) as acetone is reduced to the product.

Show Worked Solution

a.   Acetone:

  • Double bond and 2 single bonds coming off the central carbon atom  \(\Rightarrow\)  trigonal planar.

Product:

  • Contains single bonds coming off the central carbon atom (\Rightarrow\) tetrahedral. (Note: the hydrogen bonded to the central carbon atom in the product molecule is not shown due to the skeletal structure)
♦ Mean mark (a) 44%.

b.    \({ }^{13} \text{C NMR}\) Spectroscopy:

  • \({ }^{13} \text{C NMR}\) will differentiate between molecules with different carbon environments. This produces different signals on the \({ }^{13} \text{C NMR}\) spectrum.
  • The acetone would produce two signals on the \({ }^{13} \text{C NMR}\) spectrum. The first signal would be due to the \(\ce{CH3}\) groups either side of the central carbon between 20-50 ppm. The second signal would be from the carbonyl group between 190-220 ppm.
  • The product of the reduction would also produce two signals on the \({ }^{13} \text{C NMR}\) spectrum. The carbon with the hydroxyl group attached to it would produce a signal between 50-90 ppm and the \(\ce{CH3}\) groups either side would produce a signal between 5-40 ppm.
  • The reaction can be monitored by observing the disappearance of the carbonyl signal (190-220 ppm) and appearance of the hydroxyl signal (50-90 ppm) as acetone is reduced to the product.

Filed Under: Hydrocarbons and Associated Reactions, Organic Substances Tagged With: Band 4, Band 5, smc-3677-40-Molecular Shape, smc-3683-10-C NMR

CHEMISTRY, M8 2024 HSC 31

The atom economy ( AE ) of a reaction is a measure of the mass of atoms in the starting materials that are incorporated into the desired product. Higher AE means lower mass of waste products.

Urea can be produced in a variety of ways. One way is to react ammonia (high toxicity) with phosgene (high toxicity). Another way is to react ammonia with dimethyl carbonate (DMC, low toxicity). The chemical equations and AE for these two processes are provided.
 

Which of these two processes is preferable for urea production? Justify your answer with reference to the information provided.   (3 marks)

--- 8 WORK AREA LINES (style=lined) ---

Show Answers Only

  • The atom economy for the reaction utilizing dimethyl carbonate (DMC) is 48.4%, which is significantly higher compared to the 35.9% achieved in the reaction using phosgene.
  • Consequently, the process involving DMC generates a lower mass of waste products and relies on a less hazardous starting material.
  • Additionally, the DMC-based synthesis requires only 2 moles of ammonia, compared to the 4 moles needed for the phosgene process.
  • These factors highlight the synthesis of urea via DMC as the preferable method for urea production as it offers advantages in terms of atom economy, reduced toxicity of reactants, and minimized use of harmful chemicals.

Show Worked Solution

  • The atom economy for the reaction utilizing dimethyl carbonate (DMC) is 48.4%, which is significantly higher compared to the 35.9% achieved in the reaction using phosgene.
  • Consequently, the process involving DMC generates a lower mass of waste products and relies on a less hazardous starting material.
  • Additionally, the DMC-based synthesis requires only 2 moles of ammonia, compared to the 4 moles needed for the phosgene process.
  • These factors highlight the synthesis of urea via DMC as the preferable method for urea production as it offers advantages in terms of atom economy, reduced toxicity of reactants, and minimized use of harmful chemicals.

Filed Under: Chemical Synthesis and Design Tagged With: Band 4, smc-3684-20-Reaction conditions, smc-3684-40-Industrial uses, smc-3684-50-Enviro/social/economic issues

CHEMISTRY, M6 2024 HSC 29

150 mL of a 0.20 mol L\(^{-1}\) sodium hydroxide solution is added to 100 mL of a 0.10 mol L\(^{-1}\) sulfuric acid solution.

Calculate the pH of the resulting solution, assuming that the volume of the resulting solution is 250 mL and that its temperature is 25°C.   (4 marks)

--- 10 WORK AREA LINES (style=lined) ---

Show Answers Only

\(12.60\)

Show Worked Solution

\(\ce{H2SO4(aq) + 2NaOH(aq) -> Na2SO4 + 2H2O(l)}\)

\(\ce{n(NaOH)} = 0.20\ \text{mol L}^{-1} \times 0.150\ \text{L} = 0.03\ \text{mol}\)

\(\ce{n(H2SO4)} = 0.10\ \text{mol L}^{-1} \times 0.100\ \text{L} = 0.01\ \text{mol}\)

\(\ce{n(NaOH)}\ \text{required to react with}\ 0.01\ \text{mol of}\ \ce{H2SO4} = 2 \times 0.01 = 0.02\ \text{mol}\).

\(\Rightarrow\ \text{Remaining}\ \ce{NaOH} = 0.01\ \text{mol}\).

\(\ce{[NaOH]} = \dfrac{0.01\ \text{mol}}{0.250\ \text{L}} = 0.04\ \text{mol L}^{-1} = \ce{[OH^-]}\)

\(\ce{pOH} = -\log_{10}\ce{[OH-]} = -\log_{10}(0.04) = 1.40\)

\(\ce{pH} = 14-1.40=12.60\)

Filed Under: Bronsted-Lowry Theory Tagged With: Band 4, smc-3674-15-pH of Mixed Solution

CHEMISTRY, M6 2024 HSC 28

Iodic acid and sulfamic acid are monoprotic acids. A 0.100 mol L\(^{-1}\) solution of iodic acid has a pH of 1.151, as does a 0.120 mol L\(^{-1}\) solution of sulfamic acid.

Show that neither iodic acid nor sulfamic acid dissociates completely in water, and determine which is the stronger acid.   (3 marks)

--- 8 WORK AREA LINES (style=lined) ---

Show Answers Only

  • Calculating the concentration of hydronium ions in solution for a pH of 1.151.
  •   \(\ce{pH}=-\log_{10}\ce{[H3O+]}\)
  •   \(\ce{[H3O+]}=10^{-\ce{pH}}=10^{-1.151}=0.0706\) 
  • As this is less than the concentration of both of the acids, neither acid completely dissociates in water.
  • A smaller concentration of iodic acid (0.100 mol/L compared to 0.120 mol/L sulfamic acid) produces the same pH level. Iodic acid must have a greater extent of ionisation compared to sulfamic acid.
  • Therefore iodic acid is a stronger acid than sulfamic acid.

Show Worked Solution

  • Calculating the concentration of hydronium ions in solution for a pH of 1.151.
  •   \(\ce{pH}=-\log_{10}\ce{[H3O+]}\)
  •   \(\ce{[H3O+]}=10^{-\ce{pH}}=10^{-1.151}=0.0706\) 
  • As this is less than the concentration of both of the acids, neither acid completely dissociates in water.
  • A smaller concentration of iodic acid (0.100 mol/L compared to 0.120 mol/L sulfamic acid) produces the same pH level. Iodic acid must have a greater extent of ionisation compared to sulfamic acid.
  • Therefore iodic acid is a stronger acid than sulfamic acid.

Filed Under: Bronsted-Lowry Theory Tagged With: Band 4, smc-3674-10-Calculations Involving pH, smc-3674-18-Dissociation in Water, smc-3674-20-Strong/Weak Acids & Bases

CHEMISTRY, M8 2024 HSC 27

The following procedure is proposed to test for the presence of lead\(\text{(II)}\) and barium ions in water at concentrations of 0.1 mol L\(^{-1}\).

  1. Add excess 0.1 mol L\(^{-1}\) sodium sulfate solution. If a precipitate is produced, then barium ions are present.
  2. Filter any precipitate produced.
  3. Add excess 0.1 mol L\(^{-1}\) sodium bromide solution to the filtrate. If a precipitate is produced, then lead\(\text{(II)}\) ions are present.

Explain why this procedure gives correct results when only barium ions are present, but not when both barium and lead\(\text{(II)}\) ions are present. Include ONE balanced chemical equation in your answer.   (4 marks)

--- 8 WORK AREA LINES (style=lined) ---

Show Answers Only

Barium and lead\(\text{(II)}\) ions both present:

  • The procedure gives the incorrect results as both of these ions form precipitates with sulfate ions in step one.
  • Although barium sulfate has a lower solubility in water than lead sulfate and would precipitate out of the solution first, there is the potential for all of the lead ions to also precipitate out of solution according to the following chemical equation:
  •    \(\ce{Pb^{2+}(aq) + SO4^{2-}(aq) -> PbSO4(s)}\)
  • At step three, there would be no precipitate formed as all the lead ions would have been precipitated out of the solution during step one, leading to an incorrect conclusion.

Barium ions only present:

  • If only barium ions are present in the original sample, they will precipitate out of the solution in the presence of the sulfate ions in step one but will not form a precipitate in step three in the presence of bromide ions.
  • In this case, the conclusion that only \(\ce{Ba^{2+}\) ions are in the sample is correct.

Show Worked Solution

Barium and lead\(\text{(II)}\) ions both present:

  • The procedure gives the incorrect results as both of these ions form precipitates with sulfate ions in step one.
  • Although barium sulfate has a lower solubility in water than lead sulfate and would precipitate out of the solution first, there is the potential for all of the lead ions to also precipitate out of solution according to the following chemical equation:
  •    \(\ce{Pb^{2+}(aq) + SO4^{2-}(aq) -> PbSO4(s)}\)
  • At step three, there would be no precipitate formed as all the lead ions would have been precipitated out of the solution during step one, leading to an incorrect conclusion.

Barium ions only present:

  • If only barium ions are present in the original sample, they will precipitate out of the solution in the presence of the sulfate ions in step one but will not form a precipitate in step three in the presence of bromide ions.
  • In this case, the conclusion that only \(\ce{Ba^{2+}\) ions are in the sample is correct.

Filed Under: Inorganic Substances Tagged With: Band 4, smc-3682-10-Tests for Ions in Solution

CHEMISTRY, M5 2024 HSC 26

The equilibrium equation for the reaction of iodine with hydrogen cyanide in aqueous solution is given.

\(\ce{I_2(aq) + HCN(aq)\rightleftharpoons ICN(aq) + I^{-}(aq) + H^{+}(aq)}\)

At  \(t=0\) min, \(\ce{I2}\) was added to a mixture of \(\ce{HCN, I^{-}}\) and \(\ce{H^{+}}\), bringing \(\left[ \ce{I2}\right]\) to 2.0 × 10\(^{-5}\) mol L\(^{-1}\). After 3 minutes, the system was at equilibrium, and an analysis of the mixture found that half of the \(\ce{I2}\) had reacted.

  1. On the axes provided, sketch a graph to show how \(\left[\ce{I_2}\right]\) changes in the solution between  \(t=0\) min  and  \(t=6\) min.   (2 marks)

    --- 0 WORK AREA LINES (style=lined) ---


  1. Using collision theory, explain the rate of reaction between  \(t=0\) min  and  \(t=6\) min. Refer to the \(\left[ \ce{I2}\right]\) in your answer.   (3 marks)

    --- 8 WORK AREA LINES (style=lined) ---

Show Answers Only

a.    

b.    Initially, the high \(\ce{[I2]}\) results in a large number of collisions between reactants.

  • This results in an initially high reaction rate for the forward reaction. 
  • Between \(t=0\) and \(t=3\), the concentration of \(\ce{I2}\) decreases. Less collisions between reactant particles occur leading to a decrease in the rate of the forward reaction.
  • Between \(t=0\) and \(t=3\), as the concentration of reactants decrease, the concentration of the products increase. This leads to an increase in the number of successful collisions between product particles and a subsequent increase in the rate of the reverse reaction.
  • Between \(t=3\) and \(t=6\), the concentration of \(\ce{I2}\) remains constant. This is due to the system reaching a state of dynamic equilibrium so the frequency of successful collisions between the reactants is equal to the frequency of successful collisions between the products. i.e. the rates of the forward and reverse reactions are equal. 

Show Worked Solution

a.   


b.    Initially, the high \(\ce{[I2]}\) results in a large number of collisions between reactants.

  • This results in an initially high reaction rate for the forward reaction. 
  • Between \(t=0\) and \(t=3\), the concentration of \(\ce{I2}\) decreases. Less collisions between reactant particles occur leading to a decrease in the rate of the forward reaction.
  • Between \(t=0\) and \(t=3\), as the concentration of reactants decrease, the concentration of the products increase. This leads to an increase in the number of successful collisions between product particles and a subsequent increase in the rate of the reverse reaction.
  • Between \(t=3\) and \(t=6\), the concentration of \(\ce{I2}\) remains constant. This is due to the system reaching a state of dynamic equilibrium so the frequency of successful collisions between the reactants is equal to the frequency of successful collisions between the products. i.e. the rates of the forward and reverse reactions are equal. 
Mean mark (b) 56%.

Filed Under: Factors that Affect Equilibrium Tagged With: Band 4, Band 5, smc-3670-30-Concentration, smc-3670-40-Collision theory, smc-3670-60-Concentration diagrams

CHEMISTRY, M8 2024 HSC 25

The concentration of phosphate ions in washing machine waste water can be determined using colourimetry.

A sample of washing machine waste water was collected and diluted by quantitatively transferring 1.00 mL of the solution to a volumetric flask and making up the volume to 1.000 L with distilled water.

Standard phosphate solutions were prepared and analysed with a colourimeter using an accepted method.

The standard calibration graph is shown.
 

The diluted sample solution was then analysed using the same method as the standard solutions. The absorbance of this solution was found to be 0.64 .

Determine the concentration of phosphate ions in the sample of washing machine waste water, in mol L\(^{-1}\).   (4 marks)

--- 8 WORK AREA LINES (style=lined) ---

Show Answers Only

\(8.2 \times 10^{-3}\ \text{mol L}^{-1}\)

Show Worked Solution

  • Absorbance value of 0.64 = diluted concentration of 0.78 mg L\(^{-1}\).
  • As the sample was originally diluted by a factor of 1000
  •   Original concentration \( =0.78 \times 1000 = 780\ \text{mg L}^{-1} = 0.78\ \text{g L}^{-1}\)
  • \(\ce{MM(PO4^{3-})} = 30.97 + 4(16.00) = 94.97\ \text{g mol}^{-1}\)
  • \(\ce{[PO4^{3-}]} = \dfrac{0.78}{94.97} = 8.2 \times 10^{-3}\ \text{mol L}^{-1}\)

Filed Under: Inorganic Substances Tagged With: Band 4, smc-3682-60-Colourimetry UV-Vis and AAS

CHEMISTRY, M5 2024 HSC 23

Consider the following equilibrium system.

\(\ce{\left[Co \left(H_2O\right)_6\right]^{2+}(aq) + 4Cl^{-} (aq) \rightleftharpoons\left[CoCl_4\right]^{2-}(aq) +6H_2O (l)}\)

\(\ce{\left[Co\left(H_2O\right)_6\right]^{2+}(aq)}\)  is pink and  \(\ce{\left[CoCl_4\right]^{2-}(aq)}\)  is blue. When a solution of these ions and chloride ions is heated, the mixture becomes more blue.

Relate the observed colour change to the change in \(K_{e q}\).   (3 marks)

--- 10 WORK AREA LINES (style=lined) ---

Show Answers Only
  • When the solution is heated and the mixture becomes more blue, it suggests that the concentration of \(\ce{\left[CoCl_4\right]^{2-}(aq)}\) is increasing.
  • The increase in temperature favoured the forward endothermic reaction and shifts the equilibrium position to the products.
  • Therefore the concentrations of \(\ce{\left[Co\left(H_2O\right)_6\right]^{2+}(aq)}\) and \(\ce{Cl^-(aq)}\) will decrease.
  • As  \(K_{eq}=\dfrac{\ce{\left[\left[CoCl4\right]^{2-}\right]}}{\ce{\bigl[\left[Co\left(H2O\right)6\right]^{2+}\bigr]\left[Cl^{-}\right]^4}}\),  \(K_{eq}\) will increase.
Show Worked Solution
  • When the solution is heated and the mixture becomes more blue, it suggests that the concentration of \(\ce{\left[CoCl_4\right]^{2-}(aq)}\) is increasing.
  • The increase in temperature favoured the forward endothermic reaction and shifts the equilibrium position to the products.
  • Therefore the concentrations of \(\ce{\left[Co\left(H_2O\right)_6\right]^{2+}(aq)}\) and \(\ce{Cl^-(aq)}\) will decrease.
  • As  \(K_{eq}=\dfrac{\ce{\left[\left[CoCl4\right]^{2-}\right]}}{\ce{\bigl[\left[Co\left(H2O\right)6\right]^{2+}\bigr]\left[Cl^{-}\right]^4}}\),  \(K_{eq}\) will increase.

Filed Under: Equilibrium Constant Tagged With: Band 4, smc-3671-10-Find K(eq), smc-3671-35-Chemical equation given

CHEMISTRY, M7 2024 HSC 22

Vinyl fluoride can be polymerised.
 

In the box provided, draw the structural formula for a six-carbon section of the polymer formed from the polymerisation of vinyl fluoride.   (2 marks)

--- 0 WORK AREA LINES (style=lined) ---


Show Answers Only

Show Worked Solution

Filed Under: Polymers Tagged With: Band 4, smc-3681-10-Addition Polymers

CHEMISTRY, M6 2024 HSC 16 MC

Which of the following is the overall reaction that takes place when a strong acid is added to a buffer containing equal amounts of acetic acid and acetate ions?

  1. \(\ce{HCOO^{-} +H_3O^{+} \rightarrow HCOOH + H_2O}\)
  2. \(\ce{CH_3COOH +OH^{-} \rightarrow CH_3COO^{-} + H_2O}\)
  3. \(\ce{CH_3COO^{-} +H_3O^{+} \rightarrow CH_3COOH + H_2O}\)
  4. \(\ce{CH_3COOH +H_3O^{+} \rightarrow CH_3C(OH)_2^{+} + H_2O}\)
Show Answers Only

\(C\)

Show Worked Solution
  • A buffer maintains the pH of a solution when a small amount of acid or base is added to it by shifting its equilibrium position to minimise change in the concentration of \(\ce{H3O+}\) or \(\ce{OH-}\) ions.
  • When a strong acid is added to the solution, the \(\ce{[H3O+]}\) is increased, hence the system will react to reduce the increase in \(\ce{[H3O+]}\).
  • Hence, the hydronium ions will react with the weak base of the buffer solution to minimise the change in pH of the solution.
  •    \(\ce{CH_3COO^{-} +H_3O^{+} \rightarrow CH_3COOH + H_2O}\)

\(\Rightarrow C\)

Filed Under: Quantitative Analysis Tagged With: Band 4, smc-3675-60-Buffers

  • « Previous Page
  • 1
  • …
  • 28
  • 29
  • 30
  • 31
  • 32
  • …
  • 114
  • Next Page »

Copyright © 2014–2025 SmarterEd.com.au · Log in