Students conducted a large first-hand investigation into enzyme activity.
The aim in the report is shown.
Aim: To determine the optimum pH of four different enzymes.
How many independent variables were in this first-hand investigation?
- 1
- 2
- 4
- 5
Aussie Maths & Science Teachers: Save your time with SmarterEd
Students conducted a large first-hand investigation into enzyme activity.
The aim in the report is shown.
Aim: To determine the optimum pH of four different enzymes.
How many independent variables were in this first-hand investigation?
\(B\)
→ There are two independent variables, the pH and the selected enzyme. Both are changed in order to measure something, e.g. substrate concentration, in order to determine optimum pH for each of the enzymes individually.
\(\Rightarrow B\)
Analyse the impact of the development of the electron microscope on the understanding of chloroplast structure and function. (7 marks)
--- 14 WORK AREA LINES (style=lined) ---
→ Using light microscopes, scientists were able to view and identify chloroplasts. However, it wasn’t until the development of the electron microscope with its greater magnification and resolution, that scientists were able to view a chloroplast’s internal structure.
→ Structures such as the grana, stroma and thylakoids could then be identified. The role of each in the process of photosynthesis could then be studied.
→ Thylakoids are flattened, hollow discs which are arranged in stacks called grana. The stacking of the layers into grana increases stability and surface area for the capture of light.
→ The membranes of these thylakoids contain chlorophyll and are the site for the light-dependent reactions of photosynthesis.
→ The space outside the thylakoid is called the stroma, which is an aqueous fluid present within the inner membrane of the chloroplast. It contains DNA, ribosomes, lipid droplets and starch granules. This is where the light independent reactions, the Calvin cycle, takes place.
→ The functions described would not have been linked to the internal structures of the chloroplast without the development of an electron microscope.
A household cleaning agent contains a weak base with the formula \( \ce{NaX}\). 1.00 g of this compound was dissolved in water to give 100.0 mL of solution. A 20.0 mL sample of the solution was titrated with 0.100 mol L\(^{-1}\) hydrochloric acid, and required 24.4 mL of the acid for neutralisation.
What is the molar mass of the weak base?
\(A\)
\(\ce{NaX + HCl \rightarrow NaCl + HX}\)
\(n(\ce{HCl}) = 0.100 \times 24.4 \times 10^{-3} = 2.44 \times 10^{-3}\ \text{mol}\)
\(n(\ce{NaX})=2.44 \times 10^{-3}\ \text{mol}\) in 20mL sample.
\(c(\ce{NaX})=\dfrac{2.44 \times 10^{-3}}{20 \times 10^{-3}} =0.122\ \text{molL}^{-1}\)
\(n(\ce{NaX})=0.122 \times 0.1=0.0122\ \text{mol}\) (in 100mL sample)
\(MM(\ce{NaX})=\dfrac{1}{0.0122}=82 \(\text{gmol}^{-1}\)
\(\Rightarrow A\)
A solution contains three cations, \( \ce{Ba}^{2+}, \ce{Cu}^{2+}\) and \(\ce{Pb}^{2+}\). The flow chart indicates the plan used to confirm the identity of these cations.
Write a balanced net ionic equation for the formation of Precipitate 1. (2 marks)
--- 4 WORK AREA LINES (style=lined) ---
\(\ce{Pb^{2+}(aq) + 2Cl-(aq) \rightarrow PbCl2(s)}\)
In the above flow chart, the addition of excess HCl causes one of the cations to precipitate out of the solution. The remaining two are then distinguished through precipitation with excess sulfuric acid \(H2SO4(aq)\). Of the possible salts, only \({PbCl2(s)}\) is insoluble. Therefore Precipitate 1 = Lead (II) Chloride
\(\ce{Pb^{2+}(aq) + 2Cl-(aq) \rightarrow PbCl2(s)}\)
Explain the fact that Group I and Group II metal ions have one oxidation state while the transition metals often have multiple oxidation states. (3 marks)
→ Group I and II metals lose one or two ‘s’ valence shell electrons easily to acquire a noble gas electron configuration.
→ Removal of further electrons is difficult.
→ Thus Group I metals lose one electron and Group II metals lose two electrons to form +1 and +2 cations respectively.
→ Transitions elements lose ‘d’ shell electrons, to obtain a variety of oxidation states.
As altitude increases, the partial pressure of oxygen \( \text{(p} \ce{O_2)}\) in air decreases.
Species A and B are closely related endotherms that live in different habitats in Asia. The minimum \( \text{p} \ce{O_2}\) required for 100% blood oxygen saturation differs in these species because of differences in their haemoglobin structure. Data related to these two species are shown below.
\begin{equation}
\begin{array}{|c|c|c|}
\hline \text { Endotherm species } & \text { Habitat altitude } & \text { Minimum } \mathrm{pO}_2 \text { for } 100 \%\ \mathrm{Hb} \text { saturation } \\
\hline \mathrm{A} & \mathrm{High} & 54 \\
\mathrm{~B} & \text { Low } & 80 \\
\hline
\end{array}
\end{equation}
Explain how the differences in these species could have arisen, using the Darwin/Wallace theory of evolution and your understanding of the adaptive advantage of haemoglobin. (8 marks)
--- 18 WORK AREA LINES (style=lined) ---
→ Haemoglobin is a protein that provides a mechanism for transport of oxygen around the body. As it is a protein, it’s structure is dependant on the individual’s genotype.
→ Species A and Species B are able to reach 100% saturation at differing partial pressures of oxygen, meaning they have different DNA which codes for different haemoglobin structures.
→ Species A and B are likely to have diverged from a common ancestor because of differing environmental pressures resulting in two different species. Within the ancestral population there was variation which resulted from random mutations. One mutation would have resulted in haemoglobin that is able to reach 100% saturation at a lower partial pressure of oxygen.
→ When members of the ancestral species moved to a higher altitude the ability of their haemoglobin to reach saturation at a lower \( \text{p} \ce{O_2}\) gave them a survival advantage. These individuals were then more likely to reproduce and pass on their favourable genes.
→ For individuals living at lower altitudes, there is no survival advantage to being able to reach 100% saturation at lower \( \text{p} \ce{O_2}\) which means this trait was not selected for.
→ Over time, due to the isolation at a higher altitude a new species evolved.
Rennin is an enzyme found in the stomach of young mammals. Rennin curdles the milk drunk by the mammal and allows the milk solids to stay longer in the stomach to be further digested. Students conducted an investigation into rennin activity. They bubbled different volumes of carbon dioxide gas into milk samples. Each sample was 50mL and was kept at a constant temperature. The students then added rennin to each milk sample and recorded the time taken for the milk to curdle.
--- 4 WORK AREA LINES (style=lined) --- --- 8 WORK AREA LINES (style=lined) --- a. Calculating the average: → The outlier (311 seconds) was removed from the data set, then the remaining data points at 300 bubbles of \(\ce{CO_2}\) were averaged. → This was necessary as it is significantly different to other values for time taken to curdle at that \(\ce{CO_2}\) volume and allowed the calculated average to fall within the predetermined trend. b. → As bubbles of \(\ce{CO_2}\) increase, time to curdle decreases. → This scenario is explicitly seen between 100-200 bubbles, where the curdling time reduces by 20 seconds at each interval. → This means increased concentration of \(\ce{CO_2}\) also increases activity of the enzyme. → As \(\ce{CO_2}\) increases acidity of a solution, these results show us that rennin activity increases at reduced pH levels. → The slower increase of enzyme activity after 250 bubbles of \(\ce{CO_2}\) is due to the enzyme being close to its optimum pH where the enzyme activity graph flattens off at the peak of the curve. a. Calculating the average: → The outlier (311 seconds) was removed from the data set, then the remaining data points at 300 bubbles of \(\ce{CO_2}\) were averaged. → This was necessary as it is significantly different to other values for time taken to curdle at that \(\ce{CO_2}\) volume and allowed the calculated average to fall within the predetermined trend. b. → As bubbles of \(\ce{CO_2}\) increase, time to curdle decreases. → This scenario is explicitly seen between 100-200 bubbles, where the curdling time reduces by 20 seconds at each interval. → This means increased concentration of \(\ce{CO_2}\) also increases activity of the enzyme. → As \(\ce{CO_2}\) increases acidity of a solution, these results show us that rennin activity increases at reduced pH levels. → The slower increase of enzyme activity after 250 bubbles of \(\ce{CO_2}\) is due to the enzyme being close to its optimum pH where the enzyme activity graph flattens off at the peak of the curve.
Limestone \(\ce{(CaCO_3)}\) contributes to the hardness of water by releasing \(\ce{Ca^2^+}\) ions. The following chemical equation represents this reaction.
\(\ce{CaCO3($s$) + H_2O($l$) + CO_2($g$) \rightleftharpoons Ca^2^+($aq$) + 2HCO3^-($aq$)}\) \((\Delta H<0)\)
It has been suggested that heating water reduces its hardness.
Explain how this suggestion can be tested accurately, validly and reliably. (9 marks)
--- 30 WORK AREA LINES (style=lined) ---
→ Atomic absorption spectroscopy (AAS) can be used to test if heating reduces water hardness.
→ It does this by calculating the concentrations of metal ions in solutions. AAS can calculate the concentration of \(\ce{Ca^{2+}}\) in heated and non-heated samples of water and any difference in the relative concentrations of \(\ce{Ca^{2+}}\) can be used to verify the suggestion.
→ It should be noted that a reduced concentration of \(\ce{Ca^{2+}}\) indicates that the water hardness is reduced.
Methodology of testing
→ Prepare standard solutions with known concentrations of \(\ce{Ca^{2+}}\) and measure their absorbance. Plot the concentrations against the absorbance of the standard solutions and draw a calibration curve (i.e. a line of best fit).
→ Measure the absorbance of a water sample before heating and another after heating. Using the absorbance and the calibration curve, calculate the concentration of \(\ce{Ca^{2+}}\) in each sample and compare the concentrations between the heated and unheated samples.
→ The AAS should be calibrated, at which point the concentration of calcium ions can be calculated to an accuracy in the parts per million (ppm). To ensure accurate calibration of the AAS, the standard solutions need to be prepared precisely which will involve the accurate weighing of solids and the use of a pipette or a similar instrument to measure solution volumes.
→ Water used in the experiment should be de-ionised (normal drinking water has an abundance of \(\ce{Na+}\) and \(\ce{Ca^{2+}}\)).
→ The margin of experimental error decreases when sufficient calibration samples are used and the measurement of absorbance of these samples is repeated and averaged.
→ The reliability of results increases when many samples of heated and non-heated water are used to confirm that the concentrations of \(\ce{Ca^{2+}}\) in the heated water samples are consistently lower than the concentrations of \(\ce{Ca^{2+}}\) in the unheated water samples.
→ AAS can also be used to test the validity of the results. A hollow cathode lamp for calcium can direct light through the solution. This light has a specific wavelength that will only be absorbed by calcium ions. In this way, accurate measurements are made which can then be compared against the results and provide evidence of the validity of the original suggestion.
In an experiment to investigate the photoelectric effect, a group of students used a piece of equipment containing a metal cathode inside a glass tube. The students were able to accurately measure both the current produced and the maximum energy of electrons in response to light hitting the cathode.
Explain how the choice of independent variable would give rise to different results. Sketch graphs to illustrate your answer. (7 marks)
--- 14 WORK AREA LINES (style=lined) ---
Variables: the frequency of incident light (independent), and the maximum kinetic energy of ejected electrons (dependent).
→ Students would observe that below a certain frequency, no photoelectrons would be ejected. Photons with frequency less than the threshold frequency do not have enough energy to eject an electron.
→ Above this frequency, the students would observe that as the frequency increases, the kinetic energy of ejected electrons would increase linearly. This is because a specific amount of the photon’s energy is required to eject an electron, and any photon energy remaining is transferred to the electrons as kinetic energy, consistent with `K_(max)=hf-Phi`.
Variables: intensity of incident light (independent) and the resultant photocurrent (dependent).
→ The frequency of light would be controlled and would be above the threshold frequency.
→ They would observe as the intensity of light increases the current produced would increase linearly.
→ This is because an increasing intensity of light increases the number of photons. This increases the rate at which photons strike the metal surface which increases the rate of photoelectron emission which in turn increases the photocurrent.
Our understanding of matter is still incomplete and the Standard Model of matter is still being validated and tested. Technology plays a substantial role in this.
Explain the role of technology in developing both the Standard Model of matter and our understanding in ONE other area of physics. (9 marks)
--- 18 WORK AREA LINES (style=lined) ---
Technology and the development of the Standard Model
→ Technology has played a significant role in developing the standard model of matter.
→ Scientists have used the technology of linear accelerators to accelerate a beam of electrons at stationary protons. Technology was then used to analyse the scattering patterns of the electrons which was inconsistent with protons being fundamental particles.
→ It was determined that protons were comprised of both positive and negative internal charges. This led to the discovery of quarks.
→ Further, the Large Hadron Collider (LHC) is technology which accelerates protons to speeds extremely close to the speed of light, and collides them with each other.
→ When these protons collide, their dilated kinetic energy is converted to mass in the form of new particles such as the Higgs Boson. This significantly develops our understanding of the standard model of matter.
Technology and Special Relativity
→ Another area of physics in which technology has played a vital role is special relativity.
→ Einstein’s prediction of time dilation has been validated by the Hafele-Keating experiment. Technology such as atomic clocks and high speed aeroplanes were used to demonstrate time differences recorded when atomic clocks were flown around the world.
→ In this instance, technology made it possible to validate Einstein’s predictions, improving our understanding of special relativity.
Two parallel conducting rods are connected by a wire as shown and carry current `I`. They are separated by distance `d` and repel each other with a force `F`.
Which graph best shows how the current `I` would need to be varied with distance `d` to keep the force `F` constant?
`D`
→ Using `(F)/(l)=(mu_(0))/(2pi)(I_(1)I_(2))/(r)` where `I_(1)=I_(2)` and `r=d`
→ `(F)/(l)` | `=(mu_(0))/(2pi)(I^2)/(d)` | |
`(I^2)/(d)` | `=(2piF)/(mu_(0)l)` |
→ In this experiment, `I` and `d` are varied while `F` is kept constant. `2pi`, `mu_(0)` and `l` are constants.
→ `(I^2)/(d)` | `=k` | |
`I` | `=sqrt(kd)` |
→ Hence, the graph will be a square root function.
`=>D`
The diagram shows a rural coastal area and the towns, rivers and associated industry for each of the townships.
An epidemic of a disease has broken out in Nanavale. The symptoms are stomach ache, vomiting and tiredness. Many families in Nanavale have only one member with the disease, therefore it appears to be non-infectious. The symptoms are worse in infants than in adults.
Isolated cases of this disease have occurred in the nearby towns of Dairyville and Beefville. No cases have been reported on Gull Island.
Design an epidemiological study to investigate the origin of the disease. Refer to features of validity and reliability in your answer. (7 marks)
--- 16 WORK AREA LINES (style=lined) ---
→ When planning an epidemiological study it is important to first analyse all the initial evidence to better construct an effective study.
→ The disease is most likely infectious as an outbreak that affects many people is very unlikely to be due to a previously masked non-infectious disease.
→ The fact that the disease is not present on gull island also supports this and may indicate that the disease is not waterborne and may spread through physical touch, close proximity, food or radioactive toxic elements.
→ The disease also affects children more severely. This fact must be addressed in the study and measures taken to protect and monitor this vulnerable group.
→ The study should survey affected families to try to pinpoint the transmission of the disease.
→ Appropriate fact finding questions should include
→ These results should be analysed for common factors and then compared to results from the same set of questions asked of unaffected families, thus increasing the study’s validity.
→ The more people that can be reached and questioned, the more accurate the findings of the study will be.
→ Geiger readings, screening and soil extraction may pinpoint whether the disease is caused by a carcinogen on the coastal area.
→ Common factors found in the study may also reveal an antidote or treatment for affected individuals.
How effective is renal dialysis in compensating for the loss of kidney function? (7 marks)
--- 15 WORK AREA LINES (style=lined) ---
Normal kidney function
→ The kidneys are the main components of the mammalian urinary system. They are organs which filter blood and maintain water, pH, ion and salt concentration in the body through varying concentrations of each in excreted urine dependent on the body’s needs.
→ Each kidney contains 1 million nephrons, the main unit responsible for filtration.
→ Each one also contains a Bowman’s capsule, proximal and distal tubules as well as the Loop of Henle which acts as a site for selective re-absorption of certain components of the blood. This is controlled by both passive diffusion of unwanted substances through a concentration gradient (e.g. urea) or by hormonal control.
→ Aldosterone and ADH are hormones secreted by the hypothalamus which increase the permeability of the distal convoluted tubule to salt and water respectively.
Kidney disfunction and dialysis
→ Kidney function can however be impaired by diseases or disorders (such as polycystic kidney disease), many of which can kill affected individuals in a number of months if left untreated.
→ When kidney function drops below 80%, haemodialysis is an effective treatment to replace kidney function.
→ Haemodialysis involves the removal of blood from the body into the dialysis machine, which will clean the blood before returning it to the body. This is achieved by running a fluid known as dialysate, countercurrent to the blood.
→ The dialysate contains a similar composition to the blood with low urea and toxins to allow the passive diffusion of the substances via the concentration gradient into the dialysate. This is then removed and constantly replenished during a session. The countercurrent direction also improves effectiveness of this process. The dialysate can also be altered to have varying amounts of salt and ions depending on the concentration in the patients body.
→ Haemodialysis can provide an effective treatment for individuals until death or an effective transplant can be found, however the process often requires 3-4 sessions per week each of which is 4 hours long.
→ Without haemodialysis loss of kidney function is often fatal, but this life-saving technology is extremely effective in preventing many deaths despite its inconvenience.
--- 5 WORK AREA LINES (style=lined) ---
“
a.
b. Process creating wide variety of gametes
→ Independent assortment is the process by which homologous pairs are separated during meiosis into daughter cells.
→ During this process, daughter cell orientation and the cell they are separated into is random and not dependent on any factors.
→ This leads to a great variety in gametes due to the numerous combinations of chromosomes.
Explain how the analysis of quantitative observations contributed to the development of the concept that certain matter and energy are quantised. (9 marks)
--- 18 WORK AREA LINES (style=lined) ---
Experiments such as Millikan’s oil drop experiment and others testing the photoelectric effect have demonstrated that certain quantities of matter and energy are quantised which means they are multiples of some fundamental value.
Millikan’s Oil Drop Experiment
→ Millikan’s oil drop experiment was able to show that charge is quantised.
→ Millikan levitated oil drops in an electric field by balancing the electric and gravitational forces on them. This allowed him to find the electric force acting on each oil drop, and using the mass of the oil drop he found its charge.
→ Analysing his results, he found that the charge on every oil drop was an integer multiple of `1.602 xx10^(-19) C`. This was determined to be the fundamental charge on an electron.
→ Further, with Thompson’s later discovery of the charge to mass ratio of an electron, its mass could be determined.
Photoelectric Effect
→ Photoelectric effect experiments showed the quantum properties of light which seemingly contradicted the view of light as a wave.
→ It was found that there was a minimum frequency (energy) of light that would cause photoemission when it was incident upon a metal plate, and no photoemission occurred with light lower than this frequency, regardless of intensity.
→ As one photon would strike one electron on the metal surface, the electron would receive a discrete amount of energy from that photon determined by its frequency `E=hf`. If a photon didn’t have enough energy, an electron couldn’t be removed.
→ This experimental evidence changed the conceptual understanding of energy within physics and provided a basis for the quantisation of the energy of light.
Other quantitative experiments that could be explored include:
→ Bohr’s analysis of emission spectra to demonstrate the existence of quantised energy levels in atoms.
→ Cathode ray experiments showing the particle nature of electrons.
→ Blackbody radiation experiments.
Leo took $72 to the 2nd hand book shop and bought a number of books.
All the books cost the same amount.
Leo paid for all the books and had no money left.
Which of these could be the amount that one book cost?
`$11` | `$9` | `$7` | `$5` |
|
|
|
|
`$9`
`$72 ÷ 8 = $9`
`text($9 is the only amount that can be evenly)`
`text(divided into $72 with no remainder.)`
The text below summarises some recent scientific experiments.
With reference to genetics and gene technologies, explain these experiments and their implications. (7 marks)
--- 15 WORK AREA LINES (style=lined) ---
“
→ The XIST gene is a gene which can ‘switch off’ whole chromosomes. This occurs naturally in females, where one X chromosome is shut off to prevent over-function.
→ With modern genetic technologies, this chromosome is able to be cut out of female embryos using restriction enzymes, then multiplied to produce adequate copies by PCR or recombinant DNA gene cloning in bacteria. It is then able to silence any chromosome it is then inserted into.
→ This has potential to be a new form of gene therapy for people with conditions involving trisomy, where an individual is born with an extra chromosome. This includes diseases such as Down syndrome (trisomy 21) and Klinefelter syndrome (XXY), which result in decreased quality of life, as well as shorter life span.
→ If successful, the XSIT gene will provide sufferers of these diseases with a normal phenotype by silencing one of their extra chromosomes. This will facilitate a longer lifespan and a normal quality of life as if no abnormal gene was present for people with trisomy conditions, as well as being an effective gene therapy method in reducing international incidence of trisomies.
--- 2 WORK AREA LINES (style=lined) ---
--- 6 WORK AREA LINES (style=lined) ---
“
i. Translation
ii. Formation of a functional enzyme from polypeptide chains
→ A polypeptide will fold in a certain three-dimensional shape dependent on the amino acids, such as a sheet or a coil.
→ Multiple polypeptide chains will then link together to form a more specific shape. This shape will then go on to do a specific task as a protein.
Note: The following point is old syllabus knowledge.
→ One type of protein is an enzyme, which acts as a biological catalyst on certain substrates, primarily in metabolic reactions. The certain shape an enzyme makes due to the polypeptide chains within it is what dictates which substrate it will act on.
The image shows the microstructure of brass.
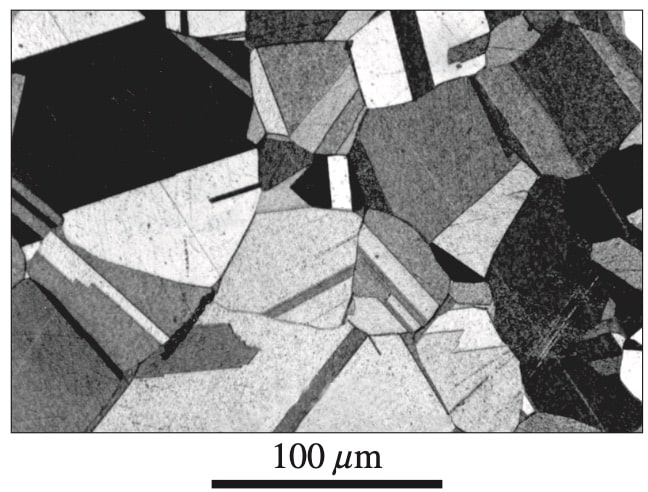
What type of grain structure does this image represent?
`C`
→ All grains are relatively equiaxed, without any major deformities or stresses.
`=>C`
A compound lever system is shown.
What is the velocity ratio of this lever system?
`D`
→ This question is solved by splitting the compound lever system into 2 parts, ‘cutting’ it through the vertical beam, and finding the VR of both sections.
→ VR is equal to the distance of the effort over the distance of the load.
→ For the right hand side, VR=200/100=2, and for the left hand side, VR=300/100=3.
→ The total VR is equal to these multiplied together, therefore the VR is 6:1.
`=>D`
The following graph shows the results of a tensile test on a metal sample.
What is the approximate 0.2% proof stress for this metal sample?
`C`
→ To determine proof stress, draw a line parallel to the straight section of the curve, starting at 0.2% strain (on the x-axis).
→ The point where this line intersects the graph is the value for 0.2% proof stress and in this case is approximately 140 MPa.
`=>C`
In which of the following does an impervious oxide surface layer provide corrosion resistance for the base metal?
`D`
→ B is incorrect as carbon fibre is not a base metal.
→ A and C may form protective layers, however they are the result of a base metal being coated with a different anodic metal.
→ D is the correct answer as Nickel-based alloys form an impervious oxide layer to prevent corrosion without the need to coat them with a different metal.
`=>D`
Which drawing shows the correct AS 1100 standard representation of a Ø10 non-structural bolt head?
`A`
The thickness of a bolt head is equal to 0.7 times the diameter, and the width of a bolt head (across peaks) is equal to 1.8 times the diameter.
`=>A`
The table compares the `\text{CO}_2` emissions of three transport systems - car, train and aircraft.
For each transport system shown in the `\text{CO}_2` emissions table, explain how an engineering innovation in that transport system has affected the environment. (7 marks)
--- 16 WORK AREA LINES (style=lined) ---
Innovations in car transport include:
→ Fuel injection, turbo engines, power to weight ratio, tyre variants, engine management systems, ABS breaks, regenerative braking and reduction in drive train losses.
Innovations in car transport include:
→ Fuel injection, turbo engines, power to weight ratio, tyre variants, engine management systems, ABS breaks, regenerative braking and reduction in drive train losses.
Environmental Impacts
→ Improved power to weight ratios have led to greater fuel efficiency (less consumption).
→ This has resulted from innovations in the strength of aluminium alloys and the use of carbon fibre composite components both of which make the car lighter.
→ Cars with more aerodynamic shapes are also being routinely produced, which reduces drag.
→ Therefore, modern cars that are more aerodynamically designed and built with lighter materials, have considerably less drag, and thus CO2 emissions are reduced.
Innovations in rail transport include:
→ Turbo driven diesel engines, magnetic levitation braking, disc brakes, electric trains with AC versus DC motors and efficient track alignment.
Environmental Impacts
→ The use of AC motors in the drive train, rather than DC, has been the most positive modern innovation in rail transport.
→ VVVF (variable voltage variable frequency) drives, control the voltage and torque on modern AC machines, creating greater efficiencies, as DC machines lose electricity as heat.
→ Regenerative braking can be employed by AC machines as a train descends or slows down.
→ These improved efficiencies result in less diesel fuel on country trains and less electricity on city trains, leading to a reduction in CO2 emissions.
Innovations in air transport include:
→ The use of composites to create more aerodynamic shapes and reduced weight, improved efficiency in turbofans, reduced drag and the removal of rivet-induced turbulence through the use of adhesives.
Environmental Impacts
→ Fuel efficiency is greatly improved through the use of modern turbofan engines that optimise the entrainment of by bypass air, which produces 90% of the total thrust of the engine.
→ The use of flow control devices and winglets on wings, minimise wing tip vortices, improving lift and reducing drag.
→ Efficiency is therefore improved leading to reduced fuel consumption and a consequent reductions in CO2 emissions.
Environmental Impacts
→ Improved power to weight ratios have led to greater fuel efficiency (less consumption).
→ This has resulted from innovations in the strength of aluminium alloys and the use of carbon fibre composite components both of which make the car lighter.
→ Cars with more aerodynamic shapes are also being routinely produced, which reduces drag.
→ Therefore, modern cars that are more aerodynamically designed and built with lighter materials, have considerably less drag, and thus CO2 emissions are reduced.
Innovations in rail transport include:
→ Turbo driven diesel engines, magnetic levitation braking, disc brakes, electric trains with AC versus DC motors and efficient track alignment.
Environmental Impacts
→ The use of AC motors in the drive train, rather than DC, has been the most positive modern innovation in rail transport.
→ VVVF (variable voltage variable frequency) drives, control the voltage and torque on modern AC machines, creating greater efficiencies, as DC machines lose electricity as heat.
→ Regenerative braking can be employed by AC machines as a train descends or slows down.
→ These improved efficiencies result in less diesel fuel on country trains and less electricity on city trains, leading to a reduction in CO2 emissions.
Innovations in air transport include:
→ The use of composites to create more aerodynamic shapes and reduced weight, improved efficiency in turbofans, reduced drag and the removal of rivet-induced turbulence through the use of adhesives.
Environmental Impacts
→ Fuel efficiency is greatly improved through the use of modern turbofan engines that optimise the entrainment of by bypass air, which produces 90% of the total thrust of the engine.
→ The use of flow control devices and winglets on wings, minimise wing tip vortices, improving lift and reducing drag.
→ Efficiency is therefore improved leading to reduced fuel consumption and a consequent reductions in CO2 emissions.
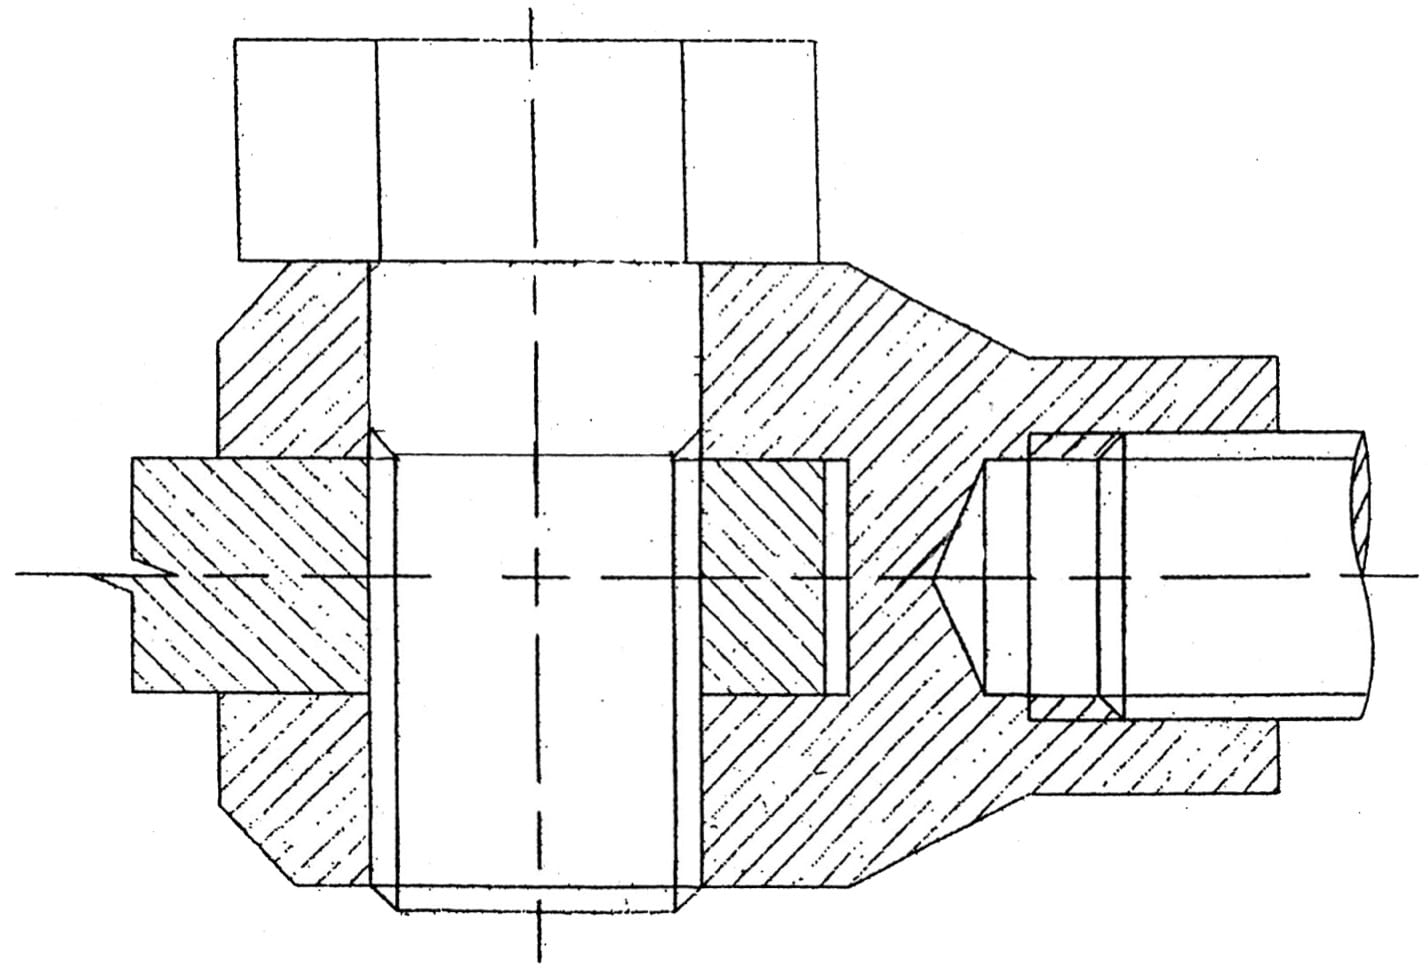
An electrical connector is screwed onto a threaded rod. A flat plate is then secured to the connector by a bolt screwed into a threaded hole.
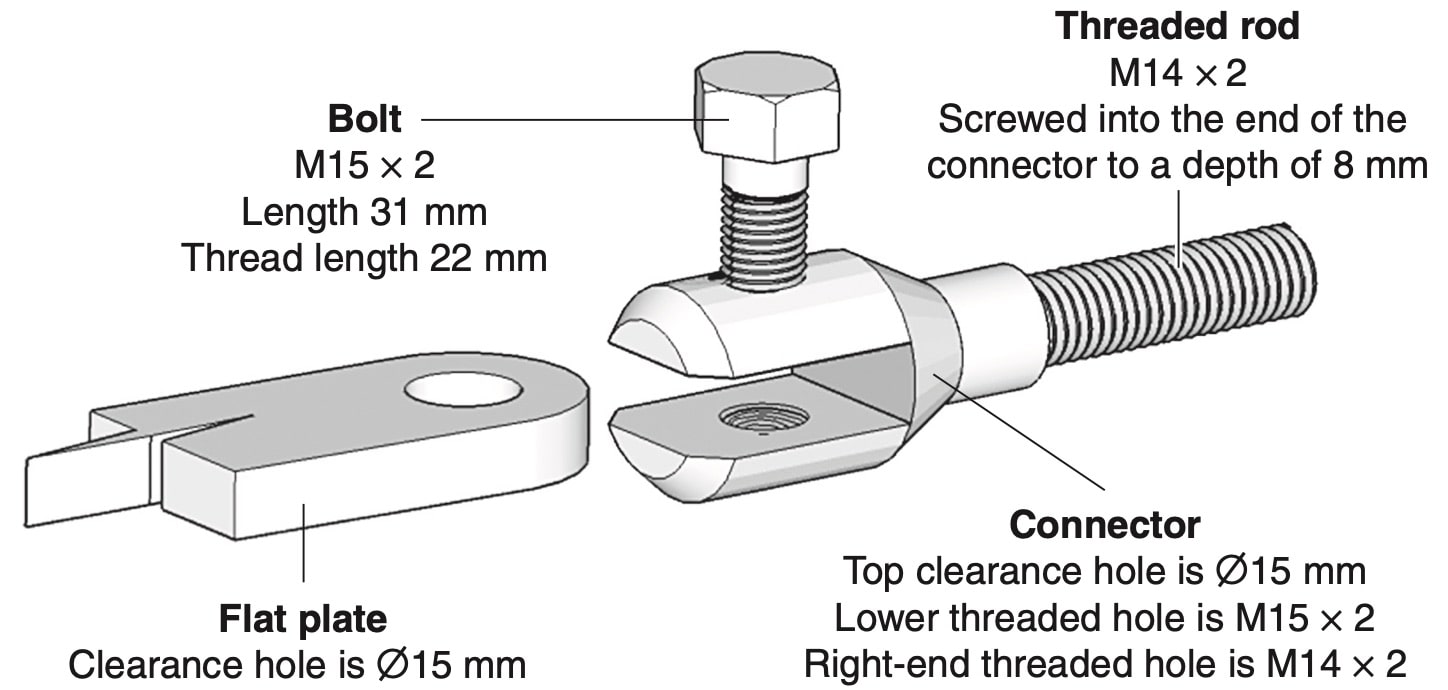
Complete the scaled sectioned front view with the parts assembled. (6 marks)
--- 0 WORK AREA LINES (style=lined) ---
The image below should be adjusted to the appropriate scale.
Key points for this drawing:
Four output graphs from an oscilloscope are shown.
Which graph(s) represent direct current (DC)?
`C`
→ For the current to be DC, the output has to be only positive or only negative, not a mix of both, as this represents alternating current.
→ Hence graphs 2, 3 and 4 represent DC.
`=>C`
A small truck chassis rail has been made from rectangular hollow section (RHS) steel. The RHS has been cold formed from an alloy steel with a yield strength of 500 MPa. A manufacturer's sign on the chassis rail is shown below.
--- 6 WORK AREA LINES (style=lined) ---
--- 5 WORK AREA LINES (style=lined) ---
i. Welding
→ The chassis rail steel becomes molten when welded at temperatures exceeding the A1 temperature.
→ Columnar grains may form on some parts of the weld upon cooling.
→ Martensite may form on cooling, creating a brittle, hard microstructure with less strength than that of the steel chassis (500 MPa).
Drilling
→ Stress raisers are produced by drilling the flanges.
→ Fatigue failure is initiated by surface roughness that can occur around the drill hole.
The top view of a fidget spinner is shown.
What force Q is required to overcome the 20 N resistance force shown? (3 marks)
--- 6 WORK AREA LINES (style=lined) ---
`2.86\ text{N}`
A line specified in AS 1100 is shown.
Which feature is this line typically used to indicate?
`B`
→ Although similar to a centre line, cutting planes can be identified by the thick dark ends.
`=>B`
The top and front views of a transition piece in an aircraft air conditioning duct are shown.
Complete a half-pattern development of the transition piece, starting from the line `a`-1 given below. (6 marks)
--- 0 WORK AREA LINES (style=blank) ---
An engineering team has been contracted to design a multi-function lifting device for a coastal container wharf.
The table shows some of the engineering design elements for this lifting device.
Explain how the lifting device can be tested and evaluated to determine if the criteria for the listed engineering elements are met. (6 marks)
--- 10 WORK AREA LINES (style=lined) ---
In modern aircraft, the external skin is riveted to the frame using solution treated and quenched aluminium 4% copper alloy rivets. These rivets are used immediately to attach the external skin of the aircraft to the frame.
Describe the changes that occur to the structure and properties of these rivets after installation. (3 marks)
--- 6 WORK AREA LINES (style=lined) ---
Changes to structure and properties of the rivet
→ The microstructure of the rivet, after quenching, is a solid unstable solution of copper dissolved in aluminium.
→ On reaching room temperature, the heat energy created initiates the copper’s precipitation out of solid solution as finely distributed precipitates \(\ce{(CuAl2)} \), which strengthens the alloy considerably.
→ Work hardening is produced by cold working the metal when the rivet head is formed.
→ The rivet is significantly strengthened due to the installation, and its hardness will increase until precipitation hardening is finalised.
→ Corresponding decreases in the ductility of the metal will also be evident.
The digital TV receiver uses zener diodes.
Compare the operation of zener diodes with common diodes used in electrical circuits. (3 marks)
--- 6 WORK AREA LINES (style=lined) ---
Common diodes
→ Allows current to flow in a forward direction.
→ If exposed to a sufficiently large voltage, common diodes break down.
→ Produced by doping silicon.
→ When subjected to a reverse voltage, common diodes can leak current.
→ Used for rectification.
Zener diodes
→ Semiconductor device that allows current to flow in either a forward or reverse direction.
→ Produced by doping silicon using a different method to that of common diodes.
→ Used for voltage regulation.
→ When breakdown voltage is exceeded they provide a stable reference voltage over a large range of currents when connected in reverse in a circuit.
→ Reverse currents don’t damage zener diodes.
Explain how a carbon fibre bicycle frame is manufactured. (3 marks)
--- 8 WORK AREA LINES (style=lined) ---
→ A mould that is either a ‘bladder’ (deflated when frame cured) or a smooth steel mould is used.
→ Pre-impregnated carbon fibres are wrapped around the mould.
→ Fibre wrapping can utilise pre-manufactured sheets, hand laid over the mould or via roll-wrapping.
→ Alternatively, carbon fibre can be applied directly to the mould using filament-winding.
→ The frame is then put inside a pressure chamber (may be a heated autoclave) in a vacuum-proof bag.
→ A catalyst that may be UV light or heat sensitive, is then used to activate the resin.
Gears used in automotive engines can be manufactured using ferrous alloys.
--- 6 WORK AREA LINES (style=lined) ---
i. Sandcasting
→ Weaker dimensional stability than powder metallurgy.
→ If not poured correctly, grains can be columnar.
→ Fatigue can be initiated through poor surface finish.
Powder metallurgy
→ Greater dimensional stability.
→ A variety of gears that cannot be made using conventional methods can be produced using powder metallurgy.
→ A custom component can be initially produced as close as possible to the final shape of the product (near net shape forming).
→ Alloys can be produced with pores (self-lubricating).
ii. Case hardening
→ Gears are heated to red heat in a nitrogen and/or carbon environment.
→ Nitrogen and carbon disperse into the steel’s surface at these high temperatures, increasing the carbon content to a level where it is hardened by quenching.
→ Martensite is formed when the steel is quenched.
→ Hence, the inside remains soft and tough whilst the outer case becomes wear resistant and hard.
→ The outer casing may be tempered back for improved surface toughness or the gear can be used with the martensite casing.
i. Sandcasting
→ Weaker dimensional stability than powder metallurgy
→ If not poured correctly, grains can be columnar
→ Fatigue can be initiated through poor surface finish.
Powder metallurgy
→ Greater dimensional stability
→ A variety of gears that cannot be made using conventional methods can be produced using powder metallurgy
→ A custom component can be initially produced as close as possible to the final shape of the product (near net shape forming)
→ Alloys can be produced with pores (self-lubricating).
ii. Case hardening
→ Gears are heated to red heat in a nitrogen and/or carbon environment.
→ Nitrogen and carbon disperse into the steel’s surface at these high temperatures, increasing the carbon content to a level where it is hardened by quenching.
→ Martensite is formed when the steel is quenched.
→ Hence, the inside remains soft and tough whilst the outer case becomes wear resistant and hard.
→ The outer casing may be tempered back for improved surface toughness or the gear can be used with the martensite casing.
Normalised high-tensile steel has been chosen for the manufacture of a wing support beam.
--- 0 WORK AREA LINES (style=lined) ---
--- 4 WORK AREA LINES (style=lined) ---
i. Microstructures
ii. → The strength of the steel is markedly increased.
→ Normalising produces finer and more uniform grains.
i. Microstructures
ii. → The strength of the steel is markedly increased.
→ Normalising produces finer and more uniform grains.
Alzheimer's disease causes destruction of brain tissue, dementia and eventually death.
The gene with the greatest known effect on the risk of developing late-onset Alzheimer's disease is called APOE. It is found on chromosome 19.
The APOE gene has multiple alleles, including e2, e3 and e4 .
--- 4 WORK AREA LINES (style=lined) ---
--- 10 WORK AREA LINES (style=lined) ---
i. → Alleles are the different variations of the same gene.
→ While most genes only have two alleles, dominant and recessive, some genes have 3 or more versions of itself. This phenomena is referred to as the gene having “multiple alleles”.
ii. Analysis of data
→ The table indicates that the alleles follow a hierarchy and have influence over the risk of Alzheimer’s, with certain combinations masking effects of others or amplifying them.
→ The e2 allele in both a homozygous genotype and coupled with e3 reduces the risk of Alzheimer’s by 40%. This suggests that the e2 allele is the one which reduces the risk of Alzheimer’s and can mask the effect of e3.
→ However, when coupled with e4, the risk of developing Alzheimer’s is 2.6 times more likely. This suggests that e4 is the more dominant allele.
→ The e4/e3 genotype also makes Alzheimer’s 3.2 times more likely in those individuals, and the e4/e4 genotypes makes it 14.9 times more likely. We can then make the conclusion that the e4 allele makes Alzheimer’s much more common in any genotype where it is present.
→ The e3 allele seems to be completely neutral and almost completely masked by both e2 and e4. In its homozygous genotype, it has no effect on the risk of developing Alzheimer’s, and when heterozygous with either e2 or e4, has little to no effect on the risk in comparison the e2 and e4’s homozygous genotypes.
→ It would then be accurate to conclude that the allele hierarchy is e3<e2<e4, with e3 being neutral and having no known effect, e2 reducing the risk of Alzheimer’s and e4 greatly increasing the risk of developing Alzheimer’s.
The bracket and lock pin assembly shown is used to attach the repeater transmitters to the tower.
Using the data given, determine the minimum lock pin diameter to use. (3 marks)
--- 6 WORK AREA LINES (style=lined) ---
`text{7 mm}`
`E = 210\ text{GPa, FoS = 5 , Total Load = 3.5 kN}`
`text{Shear Strength of Pin}\ (sigma_s) = 240\ text{MPa}`
`text{Allowable}\ sigma_s = 240/5 = 48`
`sigma_s` | `=P/(2A)\ \ text{(double shear)}` | |
`2A` | `=P/(sigma_s)` | |
`A` | `=3500/(2 xx 48)` | |
`=36.4583\ text{mm}^2` |
`A` | `=(pi xx d^2)/4` | |
`d` | `=sqrt((4A)/pi)` | |
`=sqrt((4 xx 36.4583)/pi)` | ||
`=6.813\ text{mm}` |
`text{∴ Pin diameter would be 7 mm (next available > 6.813 mm)}`
A simple circuit diagram of the AM radio receiver is shown.
--- 7 WORK AREA LINES (style=lined) ---
“
iii. → An external power source is not used to power this radio.
→ The signal picked up by the aerial powers the speakers.
→ If the impedance (resistance) is high an audible signal can be generated by the speaker at a low current.
→ Because the earphone impedance is high, the sensitivity of the coil improves, resulting in a more accurately tuned signal.
→ The sound would be inaudible if the impedance is low, as the power to the earpiece would also be low.
The rabies virus is a single-stranded RNA virus. It contains and codes for only five proteins. The diagrams show the structure and reproduction of the virus.
--- 5 WORK AREA LINES (style=lined) ---
--- 12 WORK AREA LINES (style=lined) ---
i. Rabies virus cannot be a singular pathogen:
→ This pathogen contains only a single strand of RNA which only codes for five proteins.
→ Cellular pathogens such as bacteria contain a much larger genome in the form of DNA that allows the pathogen to perform complex processes without relying on a host.
ii. The Role of Viral RNA
→ The viral RNA polymerase (which is made from L and P proteins) is responsible for the production of the viral proteins and RNA, components of the rabies viruses.
→ RNA polymerase is responsible for transcription of viral RNA into mRNA, which is then used by the host’s ribosomes to produce respective viral proteins.
→ RNA polymerase is also responsible for the replication of the viral RNA. In this process, a complementary RNA strand is produced from the original RNA strand. This strand is then used as a template for RNA polymerase to rapidly produce more RNA, complementary to the template. The new RNA will therefore be identical to the original.
→ In this way, RNA polymerase is essential in producing viral proteins and new RNA strands which form new rabies virus particles.
i. Rabies virus cannot be a singular pathogen:
→ This pathogen contains only a single strand of RNA which only codes for five proteins.
→ Cellular pathogens such as bacteria contain a much larger genome in the form of DNA that allows the pathogen to perform complex processes without relying on a host.
ii. The Role of Viral RNA
→ The viral RNA polymerase (which is made from L and P proteins) is responsible for the production of the viral proteins and RNA which are components of the rabies viruses.
→ RNA polymerase is responsible for transcription of viral RNA into mRNA, which is then used by the host’s ribosomes to produce viral proteins.
→ RNA polymerase is also responsible for the replication of the viral RNA. In this process, a complementary RNA strand is produced from the original RNA strand. This strand is then used as a template for RNA polymerase to rapidly produce more RNA, complementary to the template. The new RNA will therefore be identical to the original.
→ In this way, RNA polymerase is essential in producing viral proteins and new RNA strands which form new rabies virus particles.
The diagram shows some dimensions and forces associated with a telecommunications tower.
By considering any necessary reaction, calculate the magnitude of the forces in members `M` and `N`. State the nature of each force. Ignore the weight of the tower. (6 marks)
--- 12 WORK AREA LINES (style=lined) ---
“
Forces at Joint `A`
Horizontal forces `=0`
`:.` To calculate vertical force at `A ` → use moments.
\({\circlearrowright}\)`+SigmaM_C` | `=0` | |
`0` | `=-(12xx4)+(R_Axx12)-(10xx7)-(3xx18)` | |
`12R_A` | `=48+70+54` | |
`R_A` | `=172/12` | |
`=14.33\ text{kN}↑` |
Forces in Member `N` → method of joints at `A`
→ No horizontal forces
→ Member `AC` redundant and carrying no load
→ `F_(up) = F_(down)`
`:.` Member `AB` in compression (the force acting down on joint `A` from member `AB` is 14.33 kN)
`:.` Force in N = 14.33 kN (compression)
Using Method of Sections → take moments about Joint `H`
Find the perpendicular distance `d`
`BH^2` | `=18^2+6^2` | |
`BH` | `=sqrt{360}` | |
`sin\ 40.6º` | `=d/(sqrt{360})` | |
`d` | `=sqrt{360}xx sin\ 40.6º` | |
`d` | `=12.348\ text{m}` |
\({\circlearrowright}\)`+SigmaM_H` | `=0` |
`0` | `=+(12xx2)+(Mxx12.348)-(7xx4)` |
`12.348M` | `=-24+28` |
`M` | `=4/12.348` |
`M` | `=0.324\ text{kN (tension)}` |
`:.\ ` | `M` | `=0.324\ text{kN (tension)}` |
`N` | `=14.33\ text{kN (compression)}` |
A webbed flange is shown.
Which image correctly represents section A–A?
`C`
By Elimination:
→ Webs do not get sectioned (eliminate `B` and `D`)
→ The upright cylinder itself must be sectioned (eliminate `A`)
`=>C`
Using computer-aided drawing (CAD) software a new outline was produced 18.32 mm away from the original outline of an item as shown.
Which CAD command can produce this result most efficiently?
`B`
→ Although there is some disparity between certain CAD programs, this is generally achieved using the offset tool.
`=>B`
--- 4 WORK AREA LINES (style=lined) ---
--- 12 WORK AREA LINES (style=lined) ---
i. `12`
ii. `A=25\ text{kN in compression}`
i. Let the total weight of the concrete blocks `= x`
`50x` | `=9.23xx65` | |
`50x` | `=600` | |
`x` | `=600/50` | |
`=12\ text{kN ↓}` | ||
`=12\ 000\ text{N ↓}` | ||
`m` | `=1200\ text{kg}` |
∴ 12 × 100 kg concrete blocks are needed for the counterweight.
ii. Magnitude and nature of internal reaction
\( \circlearrowright+\Sigma M_R \) | `=0` | |
`0` | `=-(6xx5.5)+(R_Lxx1)+(10xx6)-(10.4xx7)` | |
`R_L` | `=45.8\ text{kN}↑` |
Taking the horizontal section shown:
\( \circlearrowright + \Sigma M_P \) | \(= 0\) | |
`0` | `=(Axx1)+(45.8xx1)-(10.4xx2)` | |
`A` | `=-25\ text{kN}` |
∴ `A=25\ text{kN in compression}`
Assess the impact of THREE advances in knowledge about particles and forces on the understanding of the atomic nucleus. (6 marks)
--- 0 WORK AREA LINES (style=lined) ---
Three of many possible developments are included below.
Advance One:
→ The discovery of the neutron allowed scientists to understand the masses of the nuclei.
→ This discovery enabled scientists to better identify trends in both the periodic table.
Advance Two:
→ Knowledge of the strong nuclear force helps us to explain the interaction between protons and neutrons in the nucleus, and how this force can overcome the electrostatic force of repulsion.
→ This discovery helps to explain why certain isotopes are unstable.
Advance Three:
→ Knowledge that protons and neutrons are made from different combinations of two types of quarks.
→ This helped to unify our understanding of subatomic particles, informing our base knowledge of quantum physics through the development of the Standard Model.
Describe how the distribution of stars on a Hertzsprung-Russell diagram relates to the processes that occur during their evolution. (6 marks)
--- 12 WORK AREA LINES (style=lined) ---
→ An H-R diagram distributes stars into different groupings that relate to the processes that occurred during their evolution.
→ Hydrogen fusion is the primary source of energy of stars on the main sequence.
→ Hydrogen fusion is replaced by helium fusion as the main source of energy in the star’s next evolutionary phase. This grouping of stars is also known as red giants.
→ After helium fusion, the next evolutionary stage for most stars involves gravitational collapse. At this stage, the surface of the star recedes and gravitational potential energy is converted to radiant energy. This grouping is known as white dwarfs.
→ A star’s transition between evolutionary phases occurs quickly relative to time spent in each group.
→ This transition speed results in fewer stars being distributed in areas outside of these groups on the H-R diagram.
Other possible answers could include:
→ Reference to other groups such as protostars, supergiants
→ Sketch of H-R diagram
→ Reference to properties of stars related to their distribution within particular groups
→ Globular and open clusters.
The graph shows the expected life span (the age to which people are expected to live in years) for people of different ages during the 20th century in one country.
There have been many biological developments that have contributed to our understanding of the identification, treatment and prevention of disease.
Evaluate the impact of these developments on the expected life span. In your answer, include reference to trends in the data provided. (8 marks)
--- 18 WORK AREA LINES (style=lined) ---
→ For all ages listed in the graph, life expectancy increased during the 20th century.
→ The lifespan from birth has increased more significantly than other ages ~ 48 to 74 years.
→ The smallest increase being for 60 year olds at ~ 5 years.
→ The ability to understand pathogens and the causes of infectious disease (Koch and Pasteur) has led to early identification and treatment of childhood illnesses such as rubella, polio and whooping cough.
→ Koch and Pasteur established germ theory, culture techniques and a set of postulates to follow in order to create the link between a particular pathogen and disease.
→ Vaccines to combat childhood illnesses were developed through a knowledge of germ theory.
→ The infant/childhood mortality rate has improved significantly, and hence life expectancy, due to the immunity provided by vaccines.
→ An understanding of inherited disorders has also improved lifespans with early diagnosis and prenatal genetic screening for genetic disorders and illnesses.
→ Antibiotic remedies were developed to combat bacterial diseases such as Staphylococcus aureus, due to an understanding of the difference between prokaryotic and eukaryotic cells.
→ With the use of antibiotics many diseases were then no longer life threatening, leading to improved mortality rates across all ages.
→ However, bacterial resistance has resulted with the overuse of antibiotics, so some diseases are now unresponsive to antibiotic treatment.
→ Epidemiology studies involving intricate planning and design, control groups and large scale analysis of data have lead to improvements in the treatment of non-infectious diseases such as cancer.
→ For example the discovery of links between smoking and lung cancer, sun exposure and melanoma, obesity and type II diabetes, has lead to widespread public health campaigns to inform people of the health risks and lowered the associated mortality rates.
→ Improved hygiene, food storage and preservation, and water filtration also occurred in the 20th century leading to fewer preventable diseases and hence increased life spans for all age groups.
→ Improved quarantine requirements have helped prevent the spread of plant, animal and human diseases via international travel.
→In conclusion, developments in biology have lead to increased life expectancy across all age groups, with the biggest improvements for babies and children.
→ These benefits are not necessarily a worldwide phenomenon as poor living conditions and access to medical treatment is not available in many poor socioeconomic communities.
The diagram models the process of meiosis.
--- 5 WORK AREA LINES (style=lined) ---
--- 12 WORK AREA LINES (style=lined) ---
a. Interphase:
→ In preparation for cell division, DNA is replicated during interphase with the cell.
→ During replication the bonds between the hydrogen bases are broken and the DNA strands (double helix) are unwound into separate strands.
→ Polymerase enzymes add complementary nucleotides to each strand until the strands are identical DNA copies.
→ Half of the original strand is contained in each copy.
b. The first division of meiosis:
→ Homologous chromosomes are represented in the model as the same size.
→ Different shading is used to distinguish between paternal or maternal origins.
→ Individual chromosomes form homologous pairs during the first division of meiosis.
→ These pairs have the same genes but the alleles are not identical.
→ Pairing results in crossing over and an exchange in genetic material between non-sister chromatids takes place.
→ The shading in the diagram illustrates these new combinations.
→ Half the number of chromosomes are possessed by the two resultant daughter cells (diploid cells ⇒ haploid cells).
→ These are randomly assigned, one from each homologous pair.
→ Therefore, when they return to the diploid number, new combinations of chromosomes and greater genetic variation results.
--- 1 WORK AREA LINES (style=lined) ---
--- 5 WORK AREA LINES (style=lined) ---
b. Independent Assortment
→ A random alignment of homologous chromosomes takes place during meiosis.
→ The possible number of chromosome combinations is consequently increased.
→ Therefore, the genetic variation of offspring increases.
An experiment was planned to investigate the effect of the enzyme, amylase, on starch.
The following combination of test tubes was considered.
Two drops of iodine will be added to each test tube.
Which combination of test tubes would ensure that the experiment is valid?
`A`
→ `W` and `Y` only differ by the addition of the amylase, so the experiment is valid.
`=>A`
Students conducted preliminary experiments across different species to analyse their DNA base composition.
The table shows the experimental data collected.
--- 1 WORK AREA LINES (style=lined) ---
--- 6 WORK AREA LINES (style=lined) ---
a.
b. As % Adenine increases, the % Guanine decreases.
c. Explanation of data relationship:
→ Adenine and Thymine are complementary base pairs. Likewise with Guanine and Cytosine.
→ It would therefore be expected that as the percentage of adenine increases, the percentage of thymine would also increase.
→ Adenine + Thymine + Cytosine + Guanine = 100%
→ It follows that as adenine increases the amount of guanine should decrease.
Refer to the following information to answer Questions 19 and 20.
Question 19
What can be inferred from the scientists' discovery?
Question 20
The effect of the melanoma vaccine is to stimulate
Q19. `A`
Q20. `C`
Q19.
→ The vaccine can create an immune response against the cancer cells if self-antigens are not present in the cells.
`=>A`
Q20.
→ Lymphocyte development would be promoted by the vaccine.
`=>C`
Refer to the following information to answer Questions 13 and 14.
The diagram shows some chromosomes during some stages of meiosis.
Question 13
When does the segregation of homologous chromosomes occur?
Question 14
The chromosomes shown carry
Q13. `B`
Q14. `C`
Q13.
→ Stage 1 shows homologous chromosomes, therefore segregation occurs between stages 1 and 2 (meiosis).
`=>B`
Q14.
→ The chromosomes carry the same genes as they are homologous, however, an exchange of alleles has taken place.
`=>C`
Over the last 50 years, scientists have recorded increases in the following:
Analyse the factors that affect the equilibrium between carbon dioxide in the air and carbon dioxide in the oceans. In your answer, make reference to the scientists' observations and include relevant equations. (7 marks)
--- 14 WORK AREA LINES (style=lined) ---
Fossil fuel combustion:
→ Combustion of fossil fuels releases \(\ce{CO2}\) and heat energy, both of which are released into the atmosphere.
→ Increased burning of fossil fuels will contribute to further rises in atmospheric \(\ce{CO2}\), as described in the equation for the combustion of octane
\(\ce{2C8H18 + 25O2 -> 16CO2 + 18H2O\qquad \triangle H –ve}\)
Carbon dioxide and other climate interactions:
→ \(\ce{CO2}\) combines with water according to the following equilibrium in an exothermic reaction.
\(\ce{CO2(g) + H2O(l) \rightleftharpoons H2CO3(aq) \rightleftharpoons H+(aq) + HCO^3-(aq)\qquad \triangle H –ve}\)
→ This is an equilibrium and by Le Chatelier’s principle when a system is changed, the system will adjust to oppose the change.
→ Factors that affect equilibrium in this system are temperature, pressure and concentration of reactants and products.
→ The increase of \(\ce{CO2}\) in the air due to the combustion of fossil fuels described above, increases the pressure due to \(\ce{CO2}\) in the system. By Le Chatelier’s principle, the system will oppose this by absorbing more \(\ce{CO2}\) into the oceans.
→ Scientists have been measuring the level of \(\ce{CO2}\) in oceans due to this effect and confirmed the increase in \(\ce{CO2}\).
→ However, this equilibrium is exothermic and as it causes temperature rises, by Le Chatelier’s principle, the reverse reaction may be subsequently favoured. This would have the effect of decreasing the amount of \(\ce{CO2}\) dissolving in the oceans.
→ In summary, if global temperatures continue to rise and \(\ce{CO2}\) in the atmosphere becomes stable or reduces, the system may adjust so that oceans may release \(\ce{CO2}\) rather than absorbing it.
The concentration of hydrochloric acid in a solution was determined by an acid base titration using a standard solution of sodium carbonate.
--- 5 WORK AREA LINES (style=lined) ---
--- 6 WORK AREA LINES (style=lined) ---
--- 5 WORK AREA LINES (style=lined) ---
a. → \(\ce{Na2CO3}\) is a stable compound.
→ \(\ce{Na2CO3}\) is a pure solid that will not readily absorb water from the atmosphere.
→ An accurate weight of \(\ce{Na2CO3}\) can therefore be obtained in the experiment’s measurements.
b. 0.2425 mol L–¹
c. → This is a strong acid / weak base titration.
→ Its equivalence point will occur at a pH less than seven and phenolphthalein changes colour in the pH range 10 – 8.3.
→ Phenolphthalein indicator would therefore signal the end point before equivalence (i.e. with a lower volume of acid).
→ The calculated concentration of \(\ce{HCl}\) would be higher than the correct concentration.
a. → \(\ce{Na2CO3}\) is a stable compound.
→ \(\ce{Na2CO3}\) is a pure solid that will not readily absorb water from the atmosphere.
→ An accurate weight of \(\ce{Na2CO3}\) can therefore be obtained in the experiment’s measurements.
b. \(\ce{Na2CO3(aq) + 2HCl(aq) -> 2NaCl(aq) + H2O(l) + CO2(g)}\)
\[\ce{Average titre = \frac{21.65 + 21.70 + 21.60}{3} = 21.65 mL}\]
\[\ce{n(Na2CO3) = c \times V = 0.1050 \times 0.0250 = 0.002625 mol}\]
\(\ce{n(HCl) = 2 \times n(Na2CO3) = 0.005250 mol}\)
\[\ce{[HCl] = \frac{n}{V} = \frac{0.005250}{0.02165} = 0.2425 mol L^{-1}}\]
c. → This is a strong acid / weak base titration.
→ Its equivalence point will occur at a pH less than seven and phenolphthalein changes colour in the pH range 10 – 8.3.
→ Phenolphthalein indicator would therefore signal the end point before equivalence (i.e. with a lower volume of acid).
→ The calculated concentration of \(\ce{HCl}\) would be higher than the correct concentration.
The graph shows four possible relationships between ambient temperature and body temperature.
Which line on the graph represents the relationship between ambient temperature and body temperature for an endotherm in a terrestrial environment?
`B`
→ Endotherms are animals which perform complex processes to maintain a constant internal body temperature over a variety of external temperatures.
`=>B`
A solution of hydrochloric acid was standardised by titration against a sodium carbonate solution using the following procedure.
The titration was performed and the hydrochloric acid was found to be 0.200 mol L¯1.
--- 5 WORK AREA LINES (style=lined) ---
• A 0.145 g sample of the seashell was placed in a conical flask.
• 50.0 mL of the standardised hydrochloric acid was added to the conical flask.
• At the completion of the reaction, the mixture in the conical flask was titrated with 0.250 mol L¯1 sodium hydroxide.
--- 8 WORK AREA LINES (style=lined) ---
a. → Distilled water.
→ This should be used to rinse the conical flask as this will not change the number of moles of \(\ce{Na2CO3}\) placed in it.
b. 54.3%
a. → Distilled water.
→ This should be used to rinse the conical flask as this will not change the number of moles of \(\ce{Na2CO3}\) placed in it.
b. \(\ce{HCl(aq) + NaOH(aq) -> NaCl (aq) + H2O(l)}\)
\(\ce{n(NaOH) = c \times V = 0.250 \times 0.0295 = 7.375 \times 10^{-3} mol}\)
\(\ce{n(HCl)_{after} = n(NaOH) = 7.375 \times 10^{-3} mol}\)
\(\ce{n(HCl)_{orig} = c \times V = 0.200 \times 0.0500 = 0.010 mol}\)
\(\ce{(HCl)_{used} = 0.0100-7.375 \times 10^{-3} = 2.625 \times 10^{-3} mol}\)
\(\ce{2HCl(aq) + CO3^2-(aq) -> CO2(g) + 2Cl-(aq)}\)
\[\ce{n(CO3)^2- = \frac{1}{2} \times 2.625 \times 10^{-3} = 1.3125 \times 10^{-3} mol}\]
\(\ce{m(CO3^2-) = 1.3125 \times 10^{-3} \times (12.01 + 3 \times 16.00) = 0.07876 g}\)
\[\therefore \ce{\text{%}(CO3^2-) = \frac{0.07876}{0.145} \times 100 = 54.3\text{%}}\]
This apparatus was set up to produce methyl butanoate.
--- 2 WORK AREA LINES (style=lined) ---
--- 10 WORK AREA LINES (style=lined) ---
--- 5 WORK AREA LINES (style=lined) ---
a. Flame could ignite one of reagents which is flammable.
b.
c. → Esterification is a relatively slow reaction.
→ Heating the reaction makes it go faster. However, the low boiling points of the reactants make them volatile as they readily convert into gas.
→ The cooling condenser `X` prevents the gas reactants from escaping the experiment by condensing them back into the reaction mixture. This process allows the reaction to proceed at higher temperatures.
What is the IUPAC name of the following compound?
`D`
By Elimination:
→ Halogen substituents must be in alphabetical order (eliminate B and C)
→ Numbers are allocated using the first point of difference rule (eliminate A)
`=>D`