SmarterEd

Aussie Maths & Science Teachers: Save your time with SmarterEd

  • Login
  • Get Help
  • About

Statistics, STD2 S5 2013 HSC 29b

Ali’s class sits two Geography tests. The results of her class on the first Geography test are shown.

`58,\ \ 74,\ \ 65,\ \ 66,\ \ 73,\ \ 71,\ \ 72,\ \ 74,\ \ 62,\ \ 70`

The mean was 68.5 for the first test. 

  1. Calculate the standard deviation for the first test. Give your answer correct to one decimal place.   (1 mark)

    --- 1 WORK AREA LINES (style=lined) ---

  2. On the second Geography test, the mean for the class was 74.4 and the standard deviation was 12.4.


    Ali scored 62 on the first test. Calculate the mark that she needed to obtain in the second test to ensure that her performance relative to the class was maintained.   (3 marks)

    --- 6 WORK AREA LINES (style=lined) ---
Show Answers Only

a.    `5.2\ \ \ text{(to 1 d.p.)}`

b.    `text(Ali needs to score 58.9)`

Show Worked Solution
♦ Mean mark (a) 39%
COMMENT: Make sure you are confident with this function on your calculator!

a.    `sigma=5.2201…=5.2\ text{(to 1 d.p.)}`

b.    `z =(x-mu)/sigma`

`z text{-score (1st test)}` `= (62-68.5)/5.2`
  `=-1.25`

 
`text(2nd test has)\ z text(-score of)\ \-1.25 :`

♦♦ Mean mark (b) 21%.
MARKER’S COMMENT: When “performance relative to the class is maintained”, `z text(-scores)` are the same in each test.
`-1.25` `= (x-74.4)/12.4`
`x-74.4` `=-15.5`
`x` `=58.9`

  
`:.\ text(Ali needs to score 58.9)`

Filed Under: DS5/6 - Normal Distribution and Sampling, Measures of Centre and Spread, Normal Distribution, S5 The Normal Distribution (Y12), Summary Statistics - No Graph, The Normal Distribution (Y12) Tagged With: Band 5, common-content, smc-6312-50-Std Dev (by Calc), smc-6919-10-Single z-score, smc-6919-30-Comparisons of Data Sets, smc-819-10-Single z-score, smc-819-30-Comparisons of Data Sets, smc-824-50-Std Dev (by calc), smc-995-10-Single z-score, smc-995-30-Comparisons of Data Sets

Algebra, STD2 A1 2013 HSC 29a

Sarah tried to solve this equation and made a mistake in Line 2. 

`(W+4)/3-(2W-1)/5` `=1` `text(... Line 1)`
`5W+ 20-6W-3` `=15` `text(... Line 2)`
`17-W` `=15` `text(... Line 3)`
`W` `=2` `text(... Line 4)`

 
Copy the equation in Line 1 and continue your solution to solve this equation for `W`.

Show all lines of working.   (2 marks)

--- 5 WORK AREA LINES (style=lined) ---

Show Answers Only
`(W+4)/3-(2W-1)/5` `=1` `text(… Line 1)`
`5W+ 20-6W+ 3` `=15` `text(… Line 2)`
`23-W` `=15` `text(… Line 3)`
`W` `=8` `text(… Line 4)`
Show Worked Solution
♦♦ Mean mark 27%
STRATEGY: The RHS of the equation increases from 1 to 15, indicating both sides must have been multiplied by 15.
`(W+4)/3-(2W-1)/5` `=1` `text(… Line 1)`
`5W+ 20-6W+3` `=15` `text(… Line 2)`
`23-W` `=15` `text(… Line 2)`
`W` `=8` `text(… Line 4)`

Filed Under: Algebraic Fractions, Linear and Other Equations, Substitution and Other Equations, Substitution and Other Equations, Substitution and Other Equations, Substitution and Other Equations Tagged With: Band 5, num-title-ct-pathc, num-title-qs-hsc, smc-1116-40-Find the Mistake, smc-4402-40-Multiple fractions, smc-6234-40-Find the Mistake, smc-6508-40-Find the Mistake, smc-789-40-Find the Mistake

Measurement, 2UG 2013 HSC 28c

A ship sails due South from Channel-Port-aux-Basques, Canada,  `47^@ text(N)\ 59^@ text(W)`  to Barbados, `13^@ text(N)\ 59^@ text(W)`.

How far did the ship sail, to the nearest kilometre? Assume that the radius of Earth is 6400 km.  (2 marks)

Show Answers Only

 `3798\ text{km (nearest km)}`

Show Worked Solution
♦ Mean mark 50%
`text(Angular difference in latitude)` `=47-13`
  `=34^@`
`text{(No difference in longitude)}`
`text(Distance)` `=34/360` `xx 2 pi r`
  `=34/360` `xx 2` `xx pi` `xx 6400`
  `= 3797.836…`
  `= 3798` `text{km   (nearest km)}`

Filed Under: MM6 - Spherical Geometry Tagged With: Band 5

Statistics, STD2 S4 2013 HSC 28b

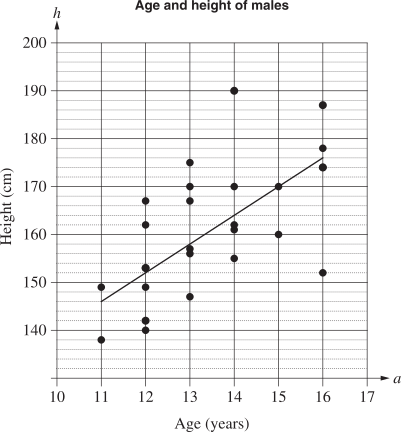
Ahmed collected data on the age (`a`) and height (`h`) of males aged 11 to 16 years.

He created a scatterplot of the data and constructed a line of best fit to model the relationship between the age and height of males.
 

  1. Determine the gradient of the line of best fit shown on the graph.   (1 mark)

    --- 2 WORK AREA LINES (style=lined) ---

  2. Explain the meaning of the gradient in the context of the data.   (1 mark)

    --- 2 WORK AREA LINES (style=lined) ---

  3. Determine the equation of the line of best fit shown on the graph.   (2 marks)

    --- 5 WORK AREA LINES (style=lined) ---

  4. Use the line of best fit to predict the height of a typical 17-year-old male.   (1 mark)

    --- 1 WORK AREA LINES (style=lined) ---

  5. Why would this model not be useful for predicting the height of a typical 45-year-old male?   (1 mark)

    --- 2 WORK AREA LINES (style=lined) ---

Show Answers Only

a.    `text(Gradient = 6)`

b.    `text(Males should grow 6 cm per year between the ages 11-16.)`

c.    `h = 6a + 80`

d.    `text(182 cm)`

e.    `text(People slow and eventually stop growing after they become adults.)`

Show Worked Solution

a.    `text{Gradient}\ =(176-146)/(16-11)=30/5=6`
 

b.    `text{Males should grow 6cm per year between the ages 11–16.}`
 

♦♦ Mean marks of 38%, 26% and 25% respectively for parts (a)-(c).

c.    `text{Gradient = 6,  Passes through (11, 146)}`

`y-y_1` `=m(x-x_1)`
`h-146` `=6(a-11)`
`h` `=6a-66+146`
  `=6a + 80`


d.   `text{Substitute}\ \ a=17\ \ \text{into equation from part (c):}`

`h=(6 xx 17) +80=182`

`:.\ text{A typical 17 year old is expected to be 182cm.}`
 

e.    `text(People slow and eventually stop growing after they become adults.)`

Filed Under: Bivariate Data Analysis, Bivariate Data Analysis (Y12), Life Expectancy, Other Linear Modelling, S3 Further Statistical Analysis (Y12), S4 Bivariate Data Analysis (Y12) Tagged With: Band 4, Band 5, common-content, smc-1001-10-Line of Best Fit, smc-1001-50-Gradient Interpretation, smc-1001-60-Limitations, smc-1113-10-Line of Best Fit, smc-1113-50-Gradient, smc-1113-60-Limitations, smc-6934-10-Line of Best Fit, smc-6934-50-Gradient Interpretation, smc-6934-60-Limitations, smc-785-10-Line of Best Fit, smc-785-50-Gradient Interpretation, smc-785-60-Limitations

Measurement, STD2 M6 2013 HSC 28a

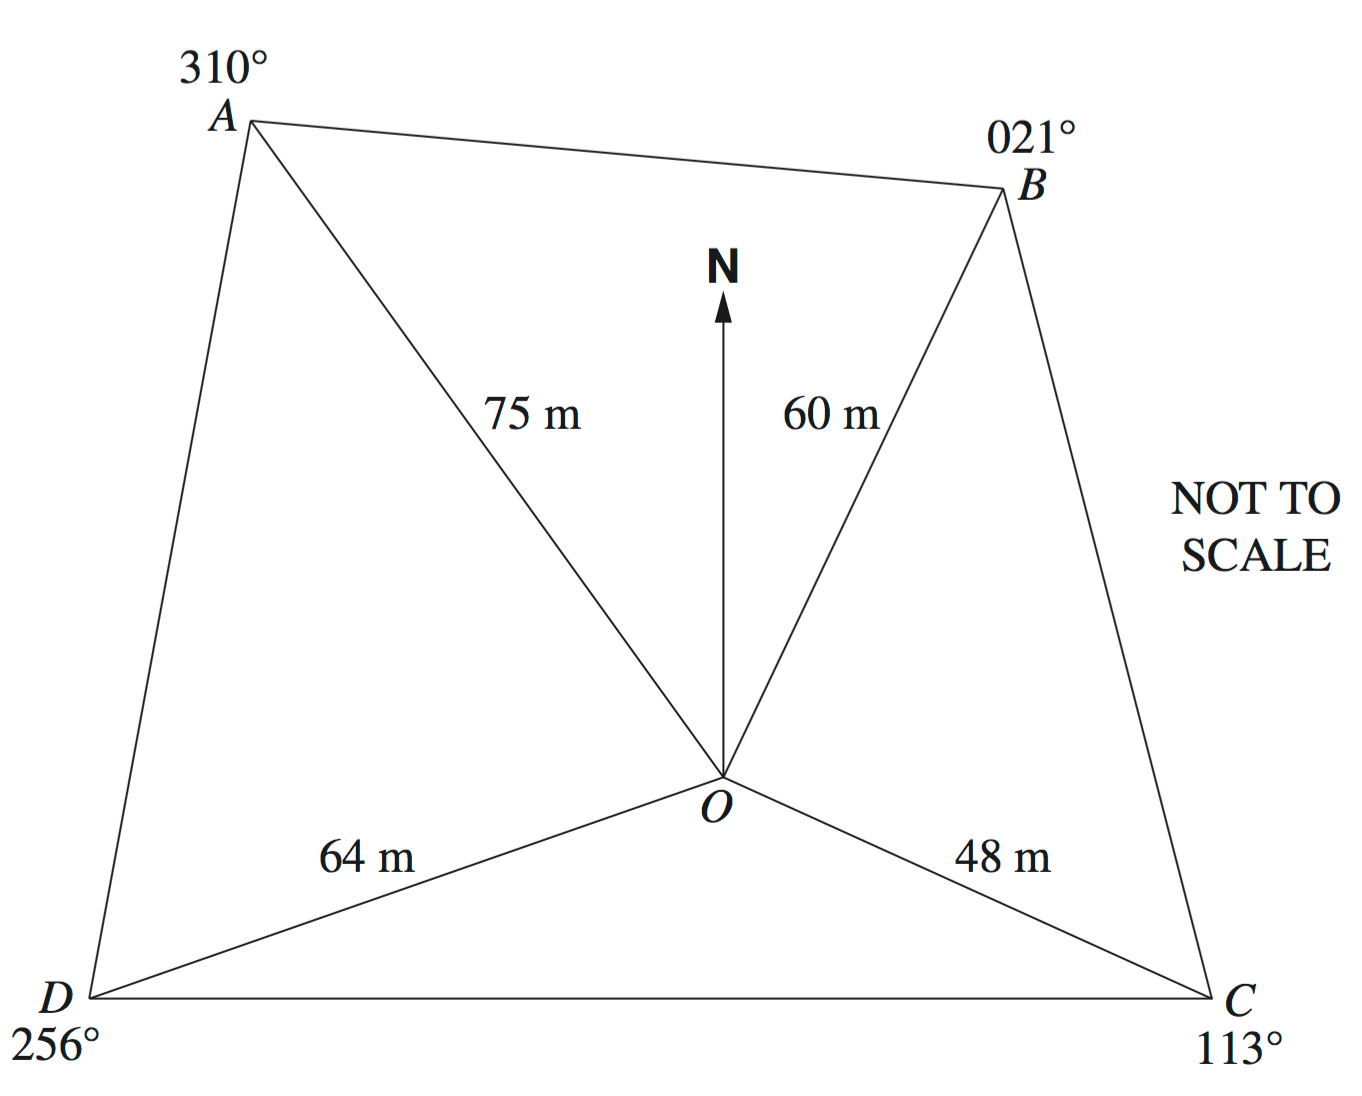
A compass radial survey of the field `ABCD` has been conducted from `O`.
 

2013 28a
 

Find the area of the section `ABO`, to the nearest square metre.   (2 marks)

--- 4 WORK AREA LINES (style=lined) ---


Show Answers Only

 `2127\ text(m)^2`

Show Worked Solution
♦ Mean mark 50%

`/_AOB=21 + (360-310)=71^@`
  

`text(Using Area) = 1/2 ab sinC`

`text(Area)` `=1/2xx 60xx 75xx sin71^@`
  `=2127.4167…=2127 text(m)^2\ \ (text(nearest m)^2)`

Filed Under: Bearings & Field Surveys, Bearings and Radial Surveys, Bearings and Radial Surveys Tagged With: Band 5, smc-6930-20-Radial Surveys, smc-803-20-Radial Surveys

Measurement, STD2 M1 2013 HSC 27d

A rectangular wooden chopping board is advertised as being 17 cm by 25 cm, with each side measured to the nearest centimetre.

  1. Calculate the percentage error in the measurement of the longer side.   (1 mark)

    --- 2 WORK AREA LINES (style=lined) ---

  2. Between what lower and upper limits does the actual area of the top of the chopping board lie?     (2 marks)

    --- 4 WORK AREA LINES (style=lined) ---

Show Answers Only
  1. `text(2%)`
  2. `404.25\ text{cm}^2 and 446.25\ text{cm}^2`
Show Worked Solution

i.    `text(Longer side) = 25\ text(cm)`

♦♦ Mean mark 23%
MARKER’S COMMENT: Be aware that measurements accurate to the nearest cm have an absolute error for calculation purposes of 0.5 cm.

`text{Absolute error}\ =1/2 xx text{precision}\ = 1/2 xx 1 = 0.5\ text{cm}`

`text{% error}` `=\ frac{text{absolute error}}{text{measurement}} xx 100%`  
  `=0.5/25 xx 100%`  
  `=2%`  


ii.   `text(Area) = l xx b`

♦ Mean mark 35%
`text{Area (upper)}` `=25.5 xx 17.5`
  `=446.25\ text{cm}^2`


`text{Area (lower)}` `=24.5 xx 16.5`
  `=404.25\ text{cm}^2`

 
`:.\ text{Area is between 404.25 cm}^2\ text{and 446.25 cm}^2.`

Filed Under: Areas and Volumes (Harder), Numbers of Any Magnitude, Simpson's Rule/Measurement Error, Units and Measurement Error, Units and Measurement Error Tagged With: Band 5, num-title-ct-corea, num-title-qs-hsc, smc-1120-10-Measurement Error, smc-4232-10-Measurement error, smc-797-10-Measurement Error

Financial Maths, STD2 F1 2013 HSC 27b

The table shows the tax payable to the Australian Taxation Office for different taxable incomes.

2013 27b

Peta has a gross annual salary of  `$84\ 000`. She has tax deductions of `$1000` for work-related travel and `$500` for stationery. The Medicare levy that she pays is calculated at 1.5% of her taxable income.

Peta has already paid `$18\ 500` in tax.

Will Peta receive a tax refund or will she owe money to the Australian Taxation Office? Justify your answer by calculating the refund or amount owed.   (4 marks)

--- 8 WORK AREA LINES (style=lined) ---

Show Answers Only

 `text(Peta owes the tax office $1209.50.)`

Show Worked Solution

`text(Total Deductions)=1000+500=$1500`

`text(Taxable Income)` `= text(Gross Income)-text(Total Deductions)`
  `= 84\ 000-1500= $82\ 500`

`text(Using the tax table:)`

♦ Mean mark 44%
IMPORTANT: Note that ‘Tax’ and the ‘Medicare Levy’ are calculated separately using the ‘Taxable Income’ figure and added together to find the amount owed to the ATO.
`text(Tax)` `= 17\ 547+ 0.37 xx (82\ 500-80\ 000)`
  `= 17\ 547 +925= $18\ 472`

`text(Medicare owing)=\ text(1.5%) xx 82\ 500= $1237.50`

`text(Owed to ATO)= 18\ 472+1237.50=$19\ 709.50`

`text(Tax paid)= $18\ 500`

`text(Difference owing)=19\ 709.50-18\ 500`

`:.\ text(Peta owes the tax office $1209.50.`

Filed Under: FM3 - Taxation, Tax and Percentage Increase/Decrease, Tax and Percentage Increase/Decrease, Taxation, Taxation Tagged With: Band 5, smc-1125-10-Tax Tables, smc-1125-40-Medicare Levy, smc-6277-10-Tax Tables, smc-6277-20-Medicare Levy, smc-6516-10-Tax Tables, smc-6516-20-Medicare Levy, smc-831-10-Tax Tables, smc-831-40-Medicare Levy

Statistics, STD2 S1 2013 HSC 26f

Jason travels to work by car on all five days of his working week, leaving home at 7 am each day. He compares his travel times using roads without tolls and roads with tolls over a period of 12 working weeks.

He records his travel times (in minutes) in a back-to-back stem-and-leaf plot.
 

2013 26f
 

  1. What is the modal travel time when he uses roads without tolls?  (1 mark)

    --- 1 WORK AREA LINES (style=lined) ---

  2. What is the median travel time when he uses roads without tolls?   (1 mark)

    --- 1 WORK AREA LINES (style=lined) ---

  3. Describe how the two data sets differ in terms of the spread and skewness of their distributions.   (2 marks)

    --- 5 WORK AREA LINES (style=lined) ---

Show Answers Only

a.    `52\ text(minutes)`

b.    `50.5\ text(minutes)`

c.    `text(Spread)`

`text{Times without tolls have a tighter spread (range = 22)}`

`text{than times with tolls (range = 55).}`

`text(Skewness)`

`text(Times without tolls shows virtually no skewness while`

`text(times with tolls are positively skewed.)`

Show Worked Solution

a.  `text(Modal time) = 52\ text(minutes)`

♦ Mean mark 36%
MARKER’S COMMENT: Finding a median proved challenging for many students. Take note!

  
b.
  `text(30 times with no tolls)`

`text(Median)` `=\ text(Average of 15th and 16th)`
  `=(50 + 51)/2= 50.5\ text(minutes)`


♦ Mean mark 39%
  

 c.  `text(Spread)`

`text{Times without tolls have a much tighter}`

`text{spread (range = 22) than times with tolls}`

`text{(range = 55).}`

`text(Skewness)`

`text(Times without tolls shows virtually no skewness)`

`text(while times with tolls are positively skewed.)`

Filed Under: Bar Charts, Histograms and Other Graphs, Data Analysis, Displaying Data - Other Charts, Displaying Data - Other Charts, Other Chart Types, Other Charts, Stem & Leaf, Box & Whisker Tagged With: Band 4, Band 5, num-title-ct-core, num-title-qs-hsc, smc-1128-24-Stem and Leaf, smc-4224-15-Mode, smc-4224-20-Median, smc-4224-35-Describing datasets, smc-4224-40-Stem and Leaf, smc-6311-20-Back-to-Back Stem-and-Leaf, smc-6531-20-Back-to-Back Stem-and-Leaf, smc-822-30-Back-to-Back Stem and Leaf, smc-998-30-Back-to-Back Stem and Leaf

Financial Maths, STD2 F4 2013 HSC 26e

Kimberley has invested $3500.  

Interest is compounded half-yearly at a rate of 2% per half-year.

2013 26e

Use the table to calculate the value of her investment at the end of 4 years.  (2 marks)

--- 4 WORK AREA LINES (style=lined) ---

Show Answers Only

 `$4102`

Show Worked Solution
♦ Mean mark 44%
COMMENT: Structure your answer: 1-Find the interest rate per compounding period (same in this case). 2-Find the number of compounding periods.

`r =\ text(2% per half-year)`

`n = 8 \ \ \ \  text{(8 half-years in 4 years)}`

`=>\ text(Table Factor = 1.172)`

`text(Investment)` `= 3500` ` xx 1.172`
  `= $4102`


`:.\ text(After 4 years, investment value is $4102)`

Filed Under: Compound Interest and Shares, F2 Investment (Y12), FM2 - Investing, Modelling Investments and Loans Tagged With: Band 5, common-content, smc-1002-10-Compounded Value of $1 Table, smc-1108-40-Compounded Value of $1, smc-817-10-Compounded Value of $1 Table

Measurement, STD2 M1 2013 HSC 26d

A section of Jim’s electricity bill is shown.

2013 26d

  1. What is the value of `A`?   (1 mark)

    --- 1 WORK AREA LINES (style=lined) ---

  2. How much will Jim save if he uses 154 kWh of energy at the Off-peak rate rather than at the Peak rate?   (2 marks)

    --- 4 WORK AREA LINES (style=lined) ---

Show Answers Only

a.    `1084.4`

b.    `$ 58.78\ \ \ (text(nearest cent) )`

Show Worked Solution
a.     `A` `=\ text(Last reading + Energy used)`
    `= 560.9 + 523.5= 1084.4`
♦ Mean mark
part (a) 43%
part (b) 46%.


b.     `text(C)text(ost at off-peak)` `= 154 xx 9.6`
    `= 1478.4\ text(cents)`


`text(C)text(ost at peak)` `=154 xx 47.77`
  `= 7356.58\ text(cents)`


`:.\ text(Saving)` `=7356.58-1478.4`
  `=5878.18= $58.78\ text{(nearest cent)}`

Filed Under: Energy and Mass, FS Resources, M4 Rates (Y12), Rates Tagged With: Band 5, smc-1104-25-Energy, smc-6932-20-Energy, smc-799-20-Electricity

Probability, STD2 S2 2013 HSC 26c

The probability that Michael will score more than 100 points in a game of bowling is `31/40`. 

  1. A commentator states that the probability that Michael will score less than 100 points in a game of bowling is  `9/40`.


    Is the commentator correct? Give a reason for your answer.   (1 mark)

    --- 2 WORK AREA LINES (style=lined) ---

  2. Michael plays two games of bowling. What is the probability that he scores more than 100 points in the first game and then again in the second game?   (1 mark)

    --- 1 WORK AREA LINES (style=lined) ---

Show Answers Only

a.    `text{Incorrect. Less than “or equal to 100” is correct.}`

b.    `961/1600`

Show Worked Solution
♦♦♦ Mean mark (a) 11%

a.    `text(The commentator is incorrect. )`

`text(The correct statement is)\ Ptext{(score} <=100 text{)} =9/40`

`text{(i.e. less than “or equal to 100” is the correct statement)}`


♦ Mean mark (b) 34%

b.    `P(text{score >100 in both})= 31/40 xx 31/40= 961/1600`

Filed Under: Fundamental understanding, Fundamental Understanding, Fundamental Understanding, Multi-stage Events, Multi-Stage Events, Multi-Stage Events, Single and Multi-Stage Events, Single and Multi-Stage Events Tagged With: Band 5, Band 6, num-title-ct-corea, num-title-qs-hsc, smc-1135-20-Other Multi-Stage Events, smc-4238-20-Independent events, smc-4238-70-Complementary events, smc-6935-04-Fundamental Understanding, smc-6935-20-P(A and B)=P(A) x P(B), smc-6935-25-Other Multi-Stage Events, smc-829-20-Other Multi-Stage Events

Measurement, STD2 M6 2010 HSC 24d

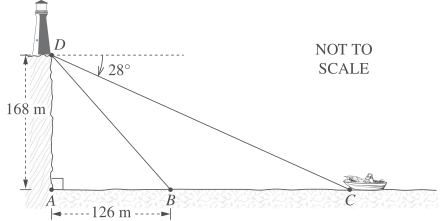
The base of a lighthouse, `D`, is at the top of a cliff 168 metres above sea level. The angle of depression from `D` to a boat at `C` is 28°. The boat heads towards the base of the cliff, `A`, and stops at `B`. The distance `AB` is 126 metres.
 

  1. What is the angle of depression from `D` to `B`, correct to the nearest degree?   (3 marks)

    --- 6 WORK AREA LINES (style=lined) ---
  2. How far did the boat travel from `C` to `B`, correct to the nearest metre?   (2 marks)

    --- 4 WORK AREA LINES (style=lined) ---

Show Answers Only

a.    `53^circ`

b.    `190\ text(m)`

Show Worked Solution
♦♦ Mean mark (a) 31%
a.     `tan/_ADB` `=126/168`
  ` /_ADB` `=36.8698…=36.9^circ\ \ \ \ text{(to 1 d.p)}`

 
`/_text(Depression)\ D\ text(to)\ B=90-36.9=53^circ\ text{(nearest degree)}`


b.    `text(Find)\ CB:`

♦♦ Mean mark (b) 31%
MARKER’S COMMENT: The most efficient solution uses right-angled trigonometry.
`/_ADC+28` `=90`
 `/_ADC` `=62^circ`
`tan 62^circ` `=(AC)/168`
`AC` `=168xxtan 62^circ=315.962…`

 
`CB=AC-AB=315.962…-126=189.962…=190\ text(m (nearest m))`

Filed Under: 2-Triangle and Harder Examples, M3 Right-Angled Triangles (Y12), Pythagoras and Right-Angled Trig, Pythagoras and Right-angled Trig, Right-angled Triangles (Y12), Right-Angled Trig Tagged With: Band 5, num-title-ct-coreb, num-title-qs-hsc, smc-1103-20-Right-angled Trig, smc-1103-30-Angle of Depression, smc-4552-40-Real world applications, smc-4552-45-2-triangles, smc-4552-50-Angle of depression, smc-6834-20-Trigonometry, smc-6834-30-Angle of Depression, smc-6928-20-Right-Angled Trig, smc-6928-30-Angle of Depression, smc-802-20-Right-Angled Trig, smc-802-30-Angle of Depression, smc-804-40-2-Triangle

Statistics, STD2 S5 2010 HSC 24c

The marks in a class test are normally distributed. The mean is 100 and the standard deviation is 10.

  1. Jason's mark is 115. What is his  `z`-score?   (1 mark)

    --- 2 WORK AREA LINES (style=lined) ---

  2. Mary has a `z`-score of 0. What mark did she achieve in the test?   (1 mark)

    --- 1 WORK AREA LINES (style=lined) ---

  3. What percentage of marks lie between 80 and 110?


    You may assume the following:


    • 68% of marks have a `z`-score between –1 and 1


    • 95% of marks have a `z`-score between  –2 and 2


    • 99.7% of marks have a `z`-score between –3 and 3.   (2 marks) 

    --- 4 WORK AREA LINES (style=lined) ---

Show Answers Only

a.    `1.5`

b.    `100`

c.    `81.5%`

Show Worked Solution

a.    ` text(Given) \ \ mu=100,\ \ sigma=10`

MARKER’S COMMENT: Too may students had calculator errors in this question, giving away easy marks. BE CAREFUL!

`text(If mark is 115,)`

`ztext(-score)` `=(115-mu)/sigma`
  `=(115-100)/100=1.5`

  
b.
    `z text(-score = 0 when mark equals the mean)`

`:.\ text(Mary’s score was)\ 100`


♦ Mean mark 42%
c.    `ztext(-score of)\ 110` `=(110-100)/10=1`
`ztext(-score of)\ 80` `=(80-100)/10=–2`

  
`text(68% of marks lie between)\ z=-1 \ text(and)\  1`

 `=>text(34%  lie between)\ z= 0\ text(and)\ 1`

`text(95%  of marks lie between)\ z=-2 \ text(and)\  2`

 `=> text(47.5%  lie between)\ z=-2\ text(and)\ 0`


`:.\ text(% marks between 80 and 110`

`=\ text(34% + 47.5%)=\ text(81.5%)`

Filed Under: DS5/6 - Normal Distribution and Sampling, Normal Distribution, S5 The Normal Distribution (Y12), The Normal Distribution (Y12) Tagged With: Band 4, Band 5, common-content, smc-6919-10-Single z-score, smc-6919-20-z-score Intervals, smc-819-10-Single z-score, smc-819-20-z-score Intervals, smc-995-10-Single z-score, smc-995-20-z-score Intervals

Algebra, STD2 A4 2010 HSC 24b

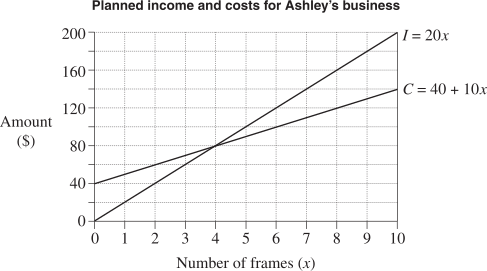
Ashley makes picture frames as part of her business. To calculate the cost,  `C`, in dollars, of making  `x`  frames, she uses the equation  `C=40+10x`.

She sells the frames for $20 each and determines her income,  `I`, in dollars, using the equation  `I=20x`.
 

Use the graph to solve the two equations simultaneously for  `x`  and explain the significance of this solution for Ashley's business.   (2 marks)

--- 4 WORK AREA LINES (style=lined) ---

Show Answers Only

`x=4`

Show Worked Solution

`text(From the graph, intersection occurs at)\ x=4`

♦ Mean mark 36%.
MARKER’S COMMENT: The intersection on the graph is the same point at which the two simultaneous equations are solved for the given value of `x`.

`=>\ text(Break-even point occurs at)\ x=4`

`text(i.e. when 4 frames sold)`

`text(Income)` `=20xx4=$80\ \ text(is equal to)`
`text(C)text(osts)` `=40+(10xx4)=$80`


`text(If)\ <4\ text(frames sold)=>\ text(LOSS for business)`

`text(If)\ >4\ text(frames sold)=>\ text(PROFIT)`

Filed Under: A3 Types of Relationships (Y12), Breakeven and Financial modelling, Simultaneous Equations and Applications, Simultaneous Linear Equations, Simultaneous Linear Equations Tagged With: Band 5, smc-1099-10-Cost/Revenue, smc-6839-10-Cost/Revenue, smc-6920-10-Cost/Revenue, smc-794-10-Cost/Revenue

Probability, STD2 S2 2010 HSC 20 MC

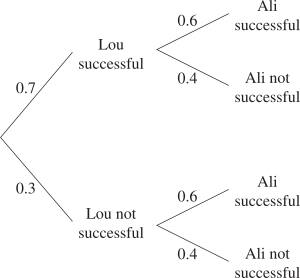
Lou and Ali are on a fitness program for one month. The probability that Lou will finish the program successfully is 0.7 while the probability that Ali will finish successfully is 0.6. The probability tree shows this information


What is the probability that only one of them will be successful ?

  1. `0.18`
  2. `0.28`
  3. `0.42`
  4. `0.46`
Show Answers Only

`D`

Show Worked Solution

`text(Let)\ \ Ptext{(Lou successful)}=P(L) = 0.7, \ P(\text{not}\ L) = 0.3`

`text(Let)\ \ Ptext{(Ali successful)}=P(A) = 0.6, \ P(\text{not}\ A) = 0.4`

`P text{(only 1 successful)}` `=P(L)xxP(text(not)\ A)+P(text(not)\ L)xxP(A)`
  `=(0.7xx0.4)+(0.3xx0.6)`
  `=0.28+0.18=0.46`

 
`=>  D`

♦ Mean mark 48%.

Filed Under: Multi-stage Events, Multi-Stage Events, Multi-Stage Events, Single and Multi-Stage Events, Single and Multi-Stage Events Tagged With: Band 5, num-title-ct-corea, num-title-qs-hsc, smc-1135-10-Probability Trees, smc-4238-20-Independent events, smc-4238-50-Probability trees, smc-6935-10-Probability Trees, smc-829-10-Probability Trees

Statistics, STD2 S1 2010 HSC 16 MC

This back-to-back stem-and-leaf plot displays the test results for a class of 26 students.
 

2010 Q16 MC  

What is the median test result for the class?

  1. 44
  2. 46
  3. 48
  4. 49
Show Answers Only

`B`

Show Worked Solution
♦♦ Mean mark 35%

`text(26 results given in the data)`

  `=>text(Median is average of)\ 13^text(th)\ text(and)\ 14^text(th)`

`:.\ text(Median)=(45+47)/2=46`

`=>B`

Filed Under: Bar Charts, Histograms and Other Graphs, Data Analysis, Displaying Data - Other Charts, Displaying Data - Other Charts, Other Chart Types, Other Charts, Stem & Leaf, Box & Whisker Tagged With: Band 5, num-title-ct-core, num-title-qs-hsc, smc-1128-26-Back-to-back Stem and Leaf, smc-4224-20-Median, smc-4224-40-Stem and Leaf, smc-6311-20-Back-to-Back Stem-and-Leaf, smc-6531-20-Back-to-Back Stem-and-Leaf, smc-822-30-Back-to-Back Stem and Leaf, smc-998-30-Back-to-Back Stem and Leaf

Financial Maths, STD2 F4 2009 HSC 24e

Jay bought a computer for $3600. His friend Julie said that all computers are worth nothing (i.e. the value is $0) after 3 years.

  1. Find the amount that the computer would depreciate each year to be worth nothing after 3 years, if the straight line method of depreciation is used.   (1 mark)

    --- 3 WORK AREA LINES (style=lined) ---

  2. Explain why the computer would never be worth nothing if the declining balance method of depreciation is used, with 30% per annum rate of depreciation. Use suitable calculations to support your answer.   (2 marks)

    --- 4 WORK AREA LINES (style=lined) ---

Show Answers Only

a.    `$1200`

b.    `text(See Worked Solutions.)`

Show Worked Solution
a.    `S` `= V_0-Dn`
  `0` `= 3600-D xx 3`
  `3D` `= 3600`
  `D` `= 3600/3= 1200`

 
`:.\ text(Annual depreciation = $1200`


♦ Mean mark (b) 45%

b.    `text(Using)\ \ S = V_0 (1-r)^n`

`text(where)\ r = text(30%)\ \ text(and)\ \ V_0 = 3600`
  

`S` `=3600 (1-30/100)^n`  
  `= 3600 (0.7)^n`  

 
`(0.7)^n > 0\ text(for all)\ n`

`:.\ text(Salvage value is always)\ >0`

Filed Under: Depreciation, Depreciation, Depreciation - Declining Balance, Depreciation - Declining Balance, Depreciation / Running costs Tagged With: Band 3, Band 5, smc-1139-50-Declining Balance vs Straight Line, smc-6845-50-Declining Balance vs Straight-line, smc-6925-50-Declining Balance vs Straight-line, smc-813-50-Declining Balance vs Straight Line

Algebra, STD2 A2 2009 HSC 24d

A factory makes boots and sandals. In any week

• the total number of pairs of boots and sandals that are made is 200
• the maximum number of pairs of boots made is 120
• the maximum number of pairs of sandals made is 150.

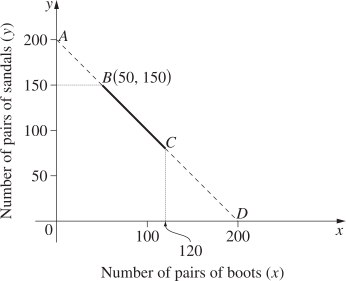
The factory manager has drawn a graph to show the numbers of pairs of boots (`x`) and sandals (`y`) that can be made.


  1. Find the equation of the line `AD`.   (1 mark)

    --- 2 WORK AREA LINES (style=lined) ---

  2. Explain why this line is only relevant between `B` and `C` for this factory.   (1 mark)

    --- 3 WORK AREA LINES (style=lined) ---

  3. The profit per week, `$P`, can be found by using the equation  `P = 24x + 15y`.


    Compare the profits at `B` and `C`.   (2 marks)

    --- 5 WORK AREA LINES (style=lined) ---

Show Answers Only
  1. `x + y = 200`
  2. `text(S)text(ince the max amount of boots = 120)`


    `=> x\ text(cannot)\ >120`


    `text(S)text(ince the max amount of sandals = 150`


    `=> y\ text(cannot)\ >150`


    `:.\ text(The line)\ AD\ text(is only possible between)\ B\ text(and)\ C.`

  3. `text(The profits at)\ C\ text(are $630 more than at)\ B.`
Show Worked Solution

a.   `text{We are told the number of boots}\ (x),` 

♦♦♦ Mean mark part (i) 14%. 
Using `y=mx+b` is a less efficient but equally valid method, using  `m=–1`  and  `b=200` (`y`-intercept).

`text{and shoes}\  (y),\ text(made in any week = 200)`

`=>text(Equation of)\ AD\ text(is)\ \ x + y = 200`


b.   `text(S)text(ince the max amount of boots = 120)`

♦ Mean mark 49%

`=> x\ text(cannot)\ >120`

`text(S)text(ince the max amount of sandals = 150`

`=> y\ text(cannot)\ >150`

`:.\ text(The line)\ AD\ text(is only possible between)\ B\ text(and)\ C.`


c.   `text(At)\ B,\ \ x = 50,\ y = 150`

♦ Mean mark 40%.
`=>$P  (text(at)\ B)` `= 24 xx 50 + 15 xx 150`
  `= 1200 + 2250= $3450`

`text(At)\ C,\ \  x = 120 text(,)\ y = 80`

`=> $P  (text(at)\ C)` `= 24 xx 120 + 15 xx 80`
  `= 2880 + 1200= $4080`

  
`:.\ text(The profits at)\ C\ text(are $630 more than at)\ B.`

Filed Under: Applications of Linear Relationships, Applications of Linear Relationships, Applications: Currency, Fuel and Other Problems, Applications: Currency, Fuel and Other Problems, Breakeven and Financial modelling, Linear Applications, Linear Functions, Linear Functions Tagged With: Band 5, Band 6, common-content, num-title-ct-coreb, num-title-qs-hsc, smc-1119-30-Other Linear Applications, smc-4421-70-Other, smc-6214-60-Other Real World Applications, smc-6256-30-Other Linear Applications, smc-6513-30-Other Linear Applications, smc-793-30-Other Linear Applications, smc-793-40-Limitations, smc-985-20-Other Linear Applications

Probability, STD2 S2 2009 HSC 23b

A personal identification number (PIN) is made up of four digits. An example of a PIN is 

2009 23b 

  1. When all ten digits are available for use, how many different PINs are possible?    (1 mark)

    --- 2 WORK AREA LINES (style=lined) ---

  2. Rhys has forgotten his four-digit PIN, but knows that the first digit is either 5 or 6.   
  3. What is the probability that Rhys will correctly guess his PIN in one attempt?   (1 mark)

    --- 2 WORK AREA LINES (style=lined) ---

Show Answers Only
  1. `10\ 000`
  2. `1/2000`
Show Worked Solution
♦ Mean mark 43%
i.  `#\ text(Combinations)` `= 10 xx 10 xx 10 xx 10`
    `= 10\ 000`


♦♦♦ Mean mark 18%
MARKER’S COMMENT: A common error is finding the number of possible combinations but not then calculating the probability.
 ii. `#\ text(Combinations)` `= 2 xx 10 xx 10 xx 10`
    `= 2000`
     
  `P text{(Correct PIN)}` `= text{# Correct PINS}/text(# Combinations)`
    `=1/2000`

Filed Under: # Combinations, Combinations, Combinations and Single Stage Events Tagged With: Band 5, Band 6, smc-1134-20-Number Combinations, smc-828-20-Number Combinations

Measurement, STD2 M6 2009 HSC 23a

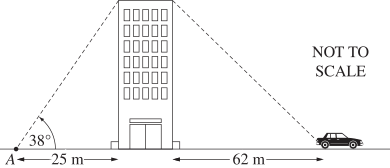
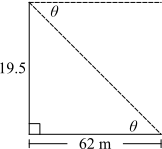
The point `A` is 25 m from the base of a building. The angle of elevation from `A` to the top of the building is 38°.
 

  1. Show that the height of the building is approximately 19.5 m.   (1 mark)

    --- 2 WORK AREA LINES (style=lined) ---

  2. A car is parked 62 m from the base of the building.


    What is the angle of depression from the top of the building to the car?


    Give your answer to the nearest minute.   (2 marks)

    --- 5 WORK AREA LINES (style=lined) ---

Show Answers Only

a.    `text{Proof  (See Worked Solutions)}`

b.    `17^@28^{′}`

Show Worked Solution

a.    `text(Need to prove height (h) ) ~~ 19.5\ text(m)`

`tan 38^@` `= h/25`
`h` `= 25 xx tan38^@`
  `= 19.5321…`
  `~~ 19.5\ text(m)\ \ text(… as required.)`


b.    

`text(Let)\ \ /_ \ text(Elevation (from car) ) = theta`

♦♦ Mean mark 33%
MARKER’S COMMENT: If >30 “seconds”, round to the next “minute”.
`tan theta` `= h/62`
  `= 19.5/62`
  `= 0.3145\ …`
`:. theta` `= 17.459\ …`
  `= 17^@27^{′}33^{″}..`
  `=17^@28^{′}\ \ text{(nearest minute)}`


`:./_ \ text(Depression to car) =17^@28^{′}\ \ text{(alternate to}\ theta text{)}`

Filed Under: M3 Right-Angled Triangles (Y12), Pythagoras and basic trigonometry, Pythagoras and Right-Angled Trig, Pythagoras and Right-angled Trig, Right-angled Triangles (Y12), Right-Angled Trig Tagged With: Band 4, Band 5, num-title-ct-coreb, num-title-qs-hsc, smc-1103-20-Right-angled Trig, smc-1103-30-Angle of Depression, smc-1103-40-Angle of Elevation, smc-4552-40-Real world applications, smc-4552-50-Angle of depression, smc-4552-60-Angle of elevation, smc-6834-20-Trigonometry, smc-6834-30-Angle of Depression, smc-6834-40-Angle of Elevation, smc-6928-20-Right-Angled Trig, smc-6928-30-Angle of Depression, smc-6928-40-Angle of Elevation, smc-802-20-Right-Angled Trig, smc-802-30-Angle of Depression, smc-802-40-Angle of Elevation

Measurement, STD2 M6 2009 HSC 22 MC

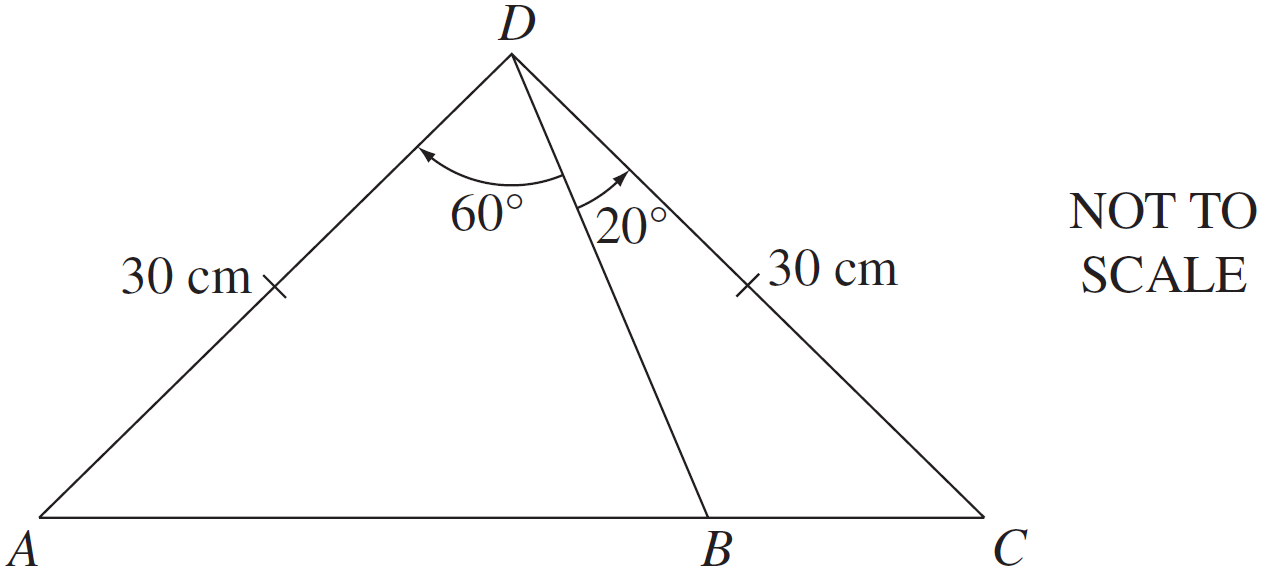
In the diagram, `AD` and `DC` are equal to 30 cm. 
 

2UG-2009-22MC
 

 What is the length of `AB` to the nearest centimetre? 

  1. `28\ text(cm)`
  2. `31\ text(cm)` 
  3. `34\ text(cm)`
  4. `39\ text(cm)` 
Show Answers Only

`A`

Show Worked Solution
♦ Mean mark of 35%

`Delta ADC\ text(is isosceles)`

`/_DAB = /_DCA` `= x^@`
`2x + 80^@` `= 180^@\ \ \ (text{Angle sum of}\ DeltaADC)`
`2x` `= 100^@`
`x` `= 50^@`


`/_ DBA` `= 180\-(50 + 60)\ \ \ (text{Angle sum of}\ Delta ADB)`
  `= 70^@`


`text(Using sine rule:)`

`(AB)/sin60` `= 30/sin70`
`AB` `= (30 xx sin60)/sin70`
  `= 27.648…\ text(cm)`

`=>  A`

Filed Under: 2-Triangle and Harder Examples, Non-Right Angled Trig, Non-right-angled Trig Tagged With: Band 5, smc-6929-20-Sine Rule, smc-6929-40-2-Triangle, smc-804-20-Sine Rule, smc-804-40-2-Triangle

Financial Maths, STD2 F1 2009 HSC 20 MC

Lou bought a plasma TV which was priced at $3499. He paid $1000 deposit and got a loan for the balance that was paid off by 24 monthly instalments of $135.36.

What simple interest rate per annum, to the nearest percent, was charged on his loan?

  1. 11%
  2. 15%
  3. 30%
  4. 46%
Show Answers Only

\(B\)

Show Worked Solution

\(\text{Loan = Price }-\text{ Deposit}= 3499-1000= \$2499\)

\(\text{Total repaid}= 24 \times 135.36= \$3248.64\)

\(\text{Interest paid}= 3248.64-2499= \$749.64\)

♦ Mean mark 34%.
COMMENT: A multi-step question targeting higher bands that can be a time-trap for many students.
\(\text{Simple Interest}\) \(= Prn\)
\(749.64\) \(= 2499 \times r \times 2\)
\(\therefore r\) \(= \dfrac{749.64}{2 \times 2499}= 0.1499\  …\approx 15\%\)

  
\(\therefore B\)

Filed Under: FM4 - Credit and Borrowing, Investment, Investment (Y12), Simple Interest and S/L Depreciation, Simple Interest and S/L Depreciation Tagged With: Band 5, smc-1124-10-Simple Interest, smc-6831-10-Simple Interest, smc-6924-10-Simple Interest, smc-808-10-Simple Interest

Algebra, STD2 A1 2009 HSC 16 MC

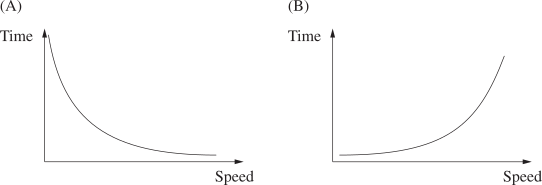
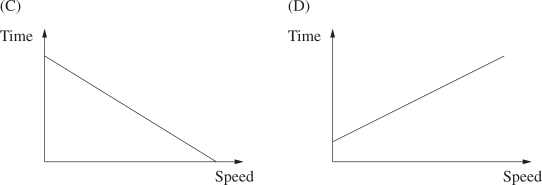
The time for a car to travel a certain distance varies inversely with its speed.

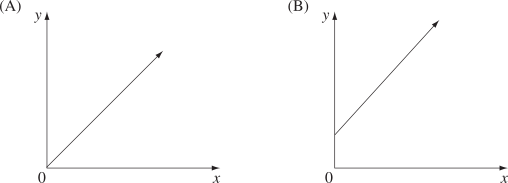
Which of the following graphs shows this relationship?
 

Show Answers Only

`A`

Show Worked Solution

`T prop 1/S\ \ =>\ \ T=k/S`

`text{By elimination:}`

`text(As   S) uarr text(, T) darr => text(cannot be B or D)`

♦ Mean mark 38%

`text(C  is incorrect because it graphs a linear relationship.)`

`=>  A`

Filed Under: Applications: BAC, Medication and D=SxT, Inverse, Linear Equations and Basic Graphs, Non-Linear: Inverse and Other Problems, Reciprocal Relationships, Safety: D=ST & BAC, Variation and Rates of Change Tagged With: Band 5, num-title-ct-patha, num-title-qs-hsc, smc-4239-30-a prop 1/b, smc-6235-20-\(d=s\times t\), smc-6923-20-Identify Graph, smc-791-20-\(D=S\times T\), smc-792-40-Other, smc-795-10-Inverse

Algebra, STD2 A2 2009 HSC 14 MC

If   `A = 6x + 10`, and  `x`  is increased by  2, what will be the corresponding increase in `A` ?

  1. `2x` 
  2. `6x` 
  3. `2` 
  4. `12` 
Show Answers Only

`D`

Show Worked Solution
♦ Mean mark 50%.
STRATEGY: Substituting real numbers into the equation can work well in these type of questions. eg. If `x=0,\ A=10` and when `x=2,\ A=22`.

`A = 6x + 10`

`text(If)\ x\ text(increases by 2)`

`A\ text(increases by)\ 6 xx 2 = 12`

`=>  D`

Filed Under: Linear and Other Equations, Linear Applications, Linear Equations and Basic Graphs, Linear Equations and Basic Graphs, Linear Modelling and Basic Graphs, Linear Modelling and Basic Graphs Tagged With: Band 5, num-title-ct-coreb, num-title-qs-hsc, smc-1118-40-Other problems, smc-6255-40-Other, smc-6512-40-Other, smc-792-40-Other

Algebra, STD2 A2 2009 HSC 13 MC

The volume of water in a tank changes over six months, as shown in the graph.
 

 2UG-2010-13MC

 
Consider the overall decrease in the volume of water.

What is the average percentage decrease in the volume of water per month over this time, to the nearest percent?

  1. 6%
  2. 11%
  3. 32%
  4. 64%
Show Answers Only

`B`

Show Worked Solution
♦ Mean mark 48%
COMMENT: Remember that % decrease requires the decrease in volume to be divided by the original volume (50,000L).

`text(Initial Volume)= 50\ 000\ text(L)`

`text(Final volume)= 18\ 000\ text(L)`

`text(Decrease 6 mths)= 50\ 000-18\ 000= 32\ 000\ text(L)`

`text(Loss per month)=5333.33…\ text(L/month)` 

`text(% loss per month)= (5333.33…)/( 50\ 000)=10.666… %` 

 
`=>  B`

Filed Under: AM2 - Linear Relationships (Prelim), Applications of Linear Relationships, Applications of Linear Relationships, Applications: Currency, Fuel and Other Problems, Applications: Currency, Fuel and Other Problems, MM1 - Units of Measurement, Non-Linear: Inverse and Other Problems Tagged With: Band 5, smc-1119-30-Other Linear Applications, smc-6256-30-Other Linear Applications, smc-6513-30-Other Linear Applications, smc-793-30-Other Linear Applications, smc-795-20-Other Relationship

Probability, 2UG 2009 HSC 7 MC

Two people are to be selected from a group of four people to form a committee.

How many different committees can be formed?

(A)   `6` 

(B)   `8` 

(C)   `12` 

(D)   `16` 

Show Answers Only

`A`

Show Worked Solution
♦ Mean mark 38%
`text(# Committees)` `= (4 xx 3)/(2 xx 1)`
  `=6`

`=>  A`

Filed Under: # Combinations Tagged With: Band 5

Algebra, STD2 A1 2011 HSC 21 MC

A train departs from Town A at 3.00 pm to travel to Town B. Its average speed for the journey is 90 km/h, and it arrives at 5.00 pm. A second train departs from Town A at 3.10 pm and arrives at Town B at 4.30 pm.

What is the average speed of the second train?

  1. 135 km/h
  2. 150 km/h
  3. 216 km/h
  4. 240 km/h
Show Answers Only

`A`

Show Worked Solution

 `text(1st train)`

♦ Mean mark 49%

`text(Travels 2hrs at 90km/h)`

`text(Distance)` `=text(Speed)xxtext(Time)`
  `=90xx2=180\ text(km)`

 
`text(2nd train)`

`text(Travels 180 km in 1 hr 20 min)\ (4/3\ text(hrs))`

`text(Speed)` `=text(Distance)/text(Time)`
  `=180-:4/3=180xx3/4`
  `=135\ text(km/h)`

`=> A`

Filed Under: Applications: BAC, D=SxT and Medication, Applications: BAC, Medication and D=SxT, Applications: BAC, Medicine and D=S x T, Applications: D=SxT and Other, Safety: D=ST & BAC Tagged With: Band 5, smc-1117-20-\(d=s\times t\), smc-6235-20-\(d=s\times t\), smc-6509-20-\(d=s \times t\), smc-791-20-\(D=S\times T\)

Algebra, STD2 A1 2011 HSC 18 MC

Which of the following correctly expresses  `a`  as the subject of  `s= ut+1/2at^2 `?

  1. `a=(2(s-ut))/t^2`
  2. `a=(2s-ut)/t^2`
  3. `a=(1/2(s-ut))/t^2`
  4. `a=(1/2s-ut)/t^2`
Show Answers Only

`A`

Show Worked Solution
`s` `=ut+1/2at^2`
`1/2at^2` `=s-ut`
`at^2` `=2(s-ut)`
`a` `=(2(s-ut))/t^2`

 
`=>A`

Filed Under: Formula Rearrange, Formula Rearrange, Formula Rearrange, Formula Rearrange, Formula Rearrange, Quadratics and Cubics Tagged With: Band 5, num-title-ct-pathc, num-title-qs-hsc, smc-1200-20-Non-Linear, smc-1201-20-Non-Linear, smc-4386-10-Rearrange equation, smc-6236-20-Non-Linear, smc-6511-20-Non-Linear

Measurement, STD2 M1 2010 HSC 17 MC

During a flood 1.5 hectares of land was covered by water to a depth of  17 cm.

How many kilolitres of water covered the land?   (1 hectare = 10 000 m²)  

  1.    2.55 kL
  2.    2550 kL
  3.    255 000 kL
  4.    2 550 000 kL
Show Answers Only

`B`

Show Worked Solution
♦♦ Mean mark 34%
NOTE: The unit conversion 1 m³ = 1000 L  is contained in the Formulae and Data sheet given out in the exam.
`text(Area covered)` `=1.5xx10\ 000`
  `=15\ 000\ text(m)^2`

  
`text(Volume)=Ah=15\ 000xx0.17=2550\ text(m)^3`

  
`text{1 m}^3=1000\ text(L)=1\ text(kL)`

`:.\ text(Volume)=2550\ text(kL)`

`=>B`

Filed Under: Areas and Volumes (Harder), Perimeter, Area and Volume, Volume, Mass and Capacity, Volume, Mass and Capacity Tagged With: Band 5, smc-6304-40-Volume, smc-6304-60-Water Catchment, smc-6521-40-Volume, smc-6521-60-Water Catchment, smc-798-40-Volume, smc-798-60-Water Catchment

Algebra, STD2 A4 2010 HSC 13 MC

The number of hours that it takes for a block of ice to melt varies inversely with the temperature. At 30°C it takes 8 hours for a block of ice to melt.

How long will it take the same size block of ice to melt at 12°C?  

  1. 3.2 hours
  2. 20 hours
  3. 26  hours
  4. 45 hours
Show Answers Only

`B`

Show Worked Solution
♦ Mean mark 50% 

`text{Time to melt}\ (T) prop1/text(Temp) \ \ =>\ \ T=k/text(Temp)`

`text(When) \ T=8, text(Temp = 30 :)`

`8=k/30\ \ =>\ \ k=240`
   

`text{Find}\ T\ text{when  Temp = 12:}`

`T=240/12=20\ text(hours)`

`=>  B`

Filed Under: Inverse, Non-Linear: Inverse and Other Problems, Reciprocal Relationships, Variation and Rates of Change Tagged With: Band 5, num-title-ct-patha, num-title-qs-hsc, smc-4239-30-a prop 1/b, smc-6923-10-\(\large y \propto \frac{1}{x}\), smc-6923-40-Practical Problems, smc-795-10-Inverse, smc-795-40-Proportional

Measurement, STD2 M6 2010 HSC 10 MC

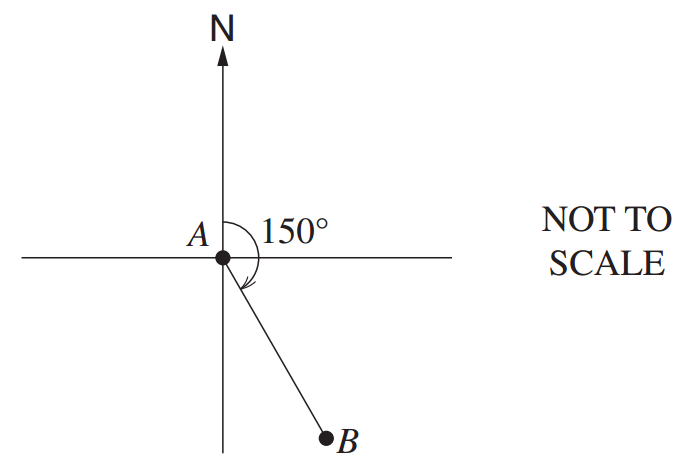
A plane flies on a bearing of  150° from  `A`  to  `B`.
 

Capture3

 
What is the bearing of  `A` from `B`?

  1. `30^@`
  2. `150^@`
  3. `210^@`
  4. `330^@`
Show Answers Only

`D`

Show Worked Solution
♦♦ Mean mark 34%

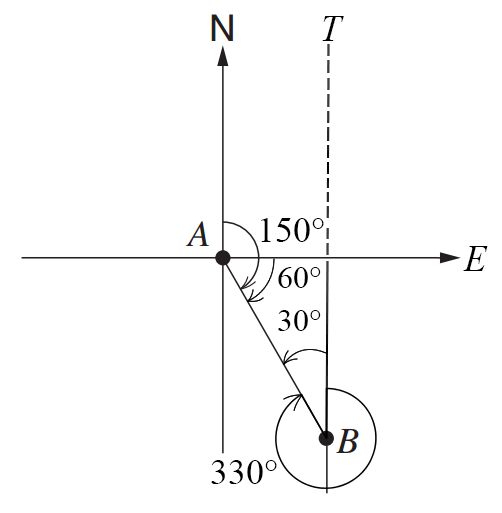
Capture3-i
 

`/_TBA=30^@\ \ \ text{(angle sum of triangle)}`

`:.\ text(Bearing of)\ A\ text{from}\ B`

`=360-30=330^@`

`=>  D`

Filed Under: Bearings & Field Surveys, Bearings and Radial Surveys, Bearings and Radial Surveys, M3 Right-Angled Triangles (Y12), Right-angled Triangles (Y12) Tagged With: Band 5, common-content, smc-1103-60-Bearings, smc-6834-60-Bearings, smc-6930-10-Bearings, smc-803-10-Bearings

Algebra, STD2 A4 2012 HSC 30c

In 2010, the city of Thagoras modelled the predicted population of the city using the equation

`P = A(1.04)^n`.

That year, the city introduced a policy to slow its population growth. The new predicted population was modelled using the equation

`P = A(b)^n`.

In both equations, `P` is the predicted population and `n` is the number of years after 2010.  

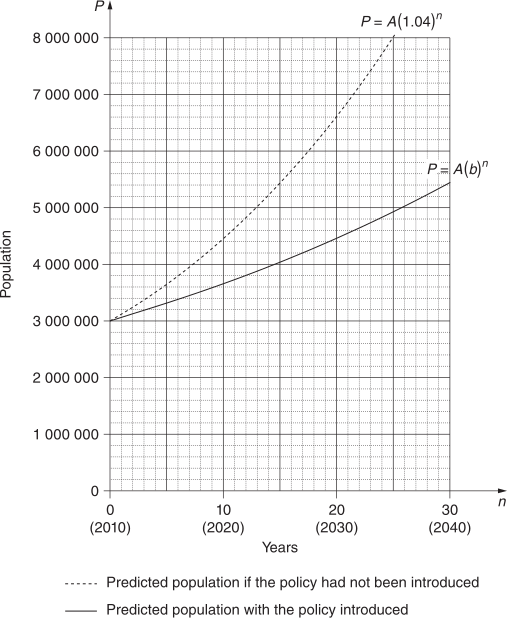
The graph shows the two predicted populations.
 

  1. Use the graph to find the predicted population of Thagoras in 2030 if the population policy had NOT been introduced.   (1 mark)

    --- 1 WORK AREA LINES (style=lined) ---

  2. In each of the two equations given, the value of `A` is 3 000 000.
  3. What does `A` represent?   (1 mark)

    --- 2 WORK AREA LINES (style=lined) ---

  4. The guess-and-check method is to be used to find the value of `b`, in  `P = A(b)^n`.
  5. i.  Explain, with or without calculations, why 1.05 is not a suitable first estimate for `b`.   (1 mark)

    --- 3 WORK AREA LINES (style=lined) ---

  6. ii. With  `n = 20`  and  `P = 4\ 460\ 000`, use the guess-and-check method and the equation  `P = A(b)^n`  to estimate the value of `b` to two decimal places. Show at least TWO estimate values for `b`, including calculations and conclusions.   (2 marks)

    --- 5 WORK AREA LINES (style=lined) ---

  7. The city of Thagoras was aiming to have a population under 7 000 000 in 2050. Does the model indicate that the city will achieve this aim?
  8. Justify your answer with suitable calculations.   (2 marks)

    --- 5 WORK AREA LINES (style=lined) ---

Show Answers Only

a.    `6\ 600\ 000`

b.    `text(The population in 2010.)`

c.i   `\text(See Worked Solution)`

c.ii  `b = 1.03, 1.02`

d.    `text(See Worked Solution)`

Show Worked Solution

a.    `text(2030 occurs at)\ \ n = 20\ \ text(on the)\ x text(-axis.)`

`text(Expected population (no policy) ) = 6\ 600\ 000`
 

b.    `A\ text(represents the population when)\ \ n=0` 

`text(which is the population in 2010.)`
 

c.i   `P = A(1.05)^n\ text(would be steeper and lie above)`

`P = A(1.04)^n\ text(since)\ 1.05 > 1.04`
 

c.ii  `text(Let)\ \ b = 1.03`

`P= 3\ 000\ 000 xx 1.03^20= 5\ 418\ 000`
 

`text(Let)\ \ b = 1.02`

`P= 3\ 000\ 000 xx 1.02^20= 4\ 457\ 800`

`:. b = 1.02`
 

d.    `text(In 2050,)\ n = 40`

`P` `= 3\ 000\ 000 xx 1.02^40`
  `= 6\ 624\ 119\ \ (text(nearest whole))`

 
`text(S)text(ince the population is below 7 million,)`

`text(the model will achieve the aim.)`

Filed Under: Exponential Functions, Exponential/Quadratic (Projectile), Graphs and Applications, Non-Linear: Exponential/Quadratics Tagged With: Band 4, Band 5, Band 6, common-content, smc-6921-10-\(\large y=ka^{x}\), smc-6921-60-Guess and Check, smc-830-30-Exponential, smc-966-10-Exponential graphs, smc-966-20-Population

Measurement, STD2 M6 2012 HSC 29c

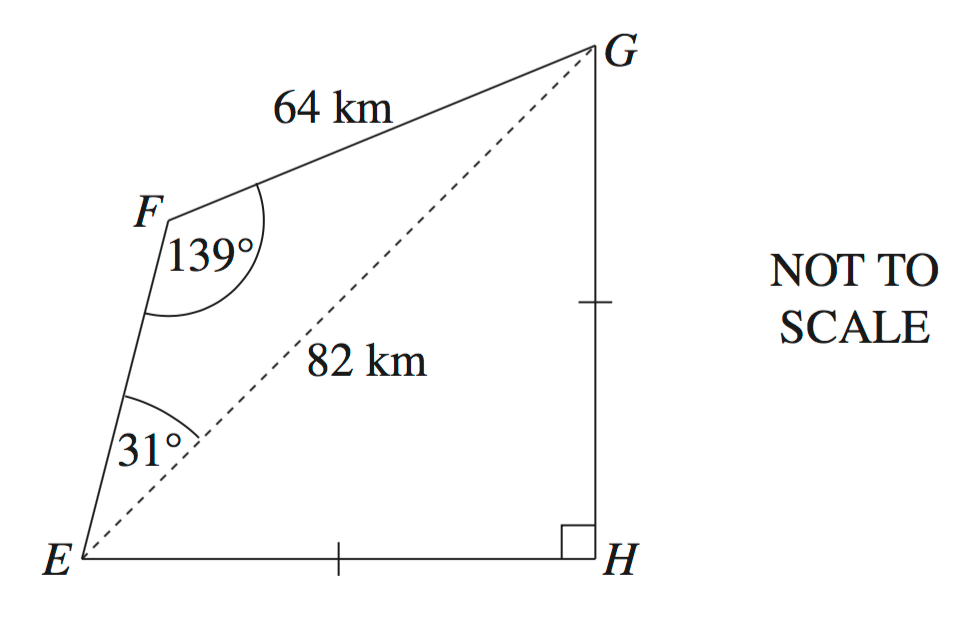
Raj cycles around a course. The course starts at `E`, passes through `F`, `G` and `H` and finishes at `E`. The distances `EH` and `GH` are equal.
  

2012 29c

  1. What is the length of `EF`, to the nearest kilometre?   (2 marks)

    --- 4 WORK AREA LINES (style=lined) ---

  2. What is the total distance that Raj cycles, to the nearest kilometre?   (3 marks)

    --- 6 WORK AREA LINES (style=lined) ---

Show Answers Only

a.    `22\ text{km}`

b.    `202\ text{km}`

Show Worked Solution

a.    `text(Find)\ EF:`

♦ Mean mark 48%.

`/_ FGE= 180\-(139 + 31)= 10^@ \ \ text{(angle sum of}\ Delta EFGtext{)}`

`text(Using Sine rule:)`

`(EF)/sin10^@` `= 82/sin139^@`
`EF` `= (82 xx sin10^@)/sin139^@= 21.70406…= 22\  text{km (nearest km)}`


b.    `text(Let)\ \ d = text(total distance cycled)`

`text(Find)\ EH:`

`text(S)text(ince)\ Delta EGH\ text(is isosceles, and)\ /_EHG = 90^@`

`/_GEH = /_HGE = 45^@`

`text{(angles opposite equal sides in}\ Delta EGHtext{)}`

♦ Mean mark 37%.
MARKER’S COMMENT: Students could also have used Pythagoras or the Sine rule to calculate `GH`.
`sin45^@` `= (GH)/82`
`GH` `= 82 xx sin45^@= 57.983…`


`:. d` `= EF + FG + GH + EH`
  `= 21.704… + 64 + 57.983… + 57.983…`
  `= 201.66…`
  `= 202 \ text{km (nearest km)}`

Filed Under: 2-Triangle and Harder Examples, Non-Right Angled Trig, Non-right-angled Trig Tagged With: Band 5, smc-6929-20-Sine Rule, smc-6929-40-2-Triangle, smc-804-20-Sine Rule, smc-804-40-2-Triangle

Statistics, STD2 S5 2012 HSC 29b

A machine produces nails. When the machine is set correctly, the lengths of the nails are normally distributed with a mean of  6.000 cm  and a standard deviation of  0.040 cm.

To confirm the setting of the machine, three nails are randomly selected. In one sample the lengths are  5.950,  5.983 and  6.140.

The setting of the machine needs to be checked when the lengths of two or more nails in a sample lie more than 1 standard deviation from the mean.

Does the setting on the machine need to be checked? Justify your answer with suitable calculations.   (2 marks)

--- 6 WORK AREA LINES (style=lined) ---

Show Answers Only

`mu = 6.000,\ \sigma = 0.040`

`text{Limits for}\ ±1 \sigma:`

`6.000 + 0.040 = 6.040\ text{(upper)}`

`6.000-0.040 = 5.960\ text{(lower)}`

`text(Chosen nails:)\ \ 5.950` `=>\ text(outside limits)`
`5.983` `=>\ text(inside)`
`6.140` `=>\ text(outside)`


`text{Since 2 nails are outside 1}\ \sigma\ \text{limits}`

`=>\ \ \text{Settings need to be checked.}`

Show Worked Solution
♦ Mean mark 44%

`mu = 6.000,\ \sigma = 0.040`

`text{Limits for}\ ±1 \sigma:`

`6.000 + 0.040 = 6.040\ text{(upper)}`

`6.000-0.040 = 5.960\ text{(lower)}`

`text(Chosen nails:)\ \ 5.950` `=>\ text(outside limits)`
`5.983` `=>\ text(inside)`
`6.140` `=>\ text(outside)`


`text{Since 2 nails are outside 1}\ \sigma\ \text{limits}`

`=>\ \ \text{Settings need to be checked.}`

Filed Under: DS5/6 - Normal Distribution and Sampling, Normal Distribution, S5 The Normal Distribution (Y12), The Normal Distribution (Y12) Tagged With: Band 5, common-content, smc-6919-20-z-score Intervals, smc-819-20-z-score Intervals, smc-995-20-z-score Intervals

Statistics, STD2 S3 2012 HSC 29a*

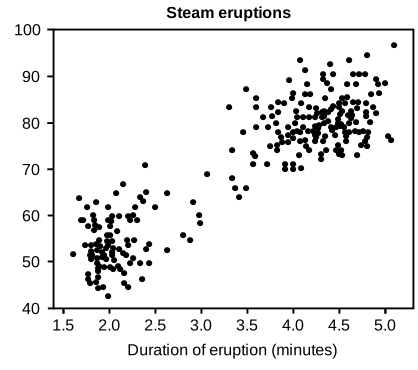
Tourists visit a park where steam erupts from a particular geyser.

The brochure for the park has a graph of the data collected for this geyser over a period of time.

The graph shows the duration of an eruption and the time until the next eruption, timed from the end of one eruption to the beginning of the next.


  1. Tony sees an eruption that lasts 4 minutes. Based on the data in the graph, what is the minimum time that he can expect to wait for the next eruption? (1 mark)

    --- 1 WORK AREA LINES (style=lined) ---

  2. Julia saw two consecutive eruptions, one hour apart. Based on the data in the graph, what was the longest possible duration of the first eruption that she saw?    (1 mark)

    --- 1 WORK AREA LINES (style=lined) ---

  3. What does the graph suggest about the association between the duration of an eruption and the time to the next eruption? (1 mark)

    --- 2 WORK AREA LINES (style=lined) ---

Show Answers Only
  1. `70\ text(minutes)`
  2. `3\ text(minutes)`
  3. `text(It suggests that the longer an eruption lasts for, the longer)`
  4.  

    `text(you will wait until the next one.)`

Show Worked Solution

i.  `70\ text(minutes)\ \ text{(refer to graph)}`


ii.  `text(3 minutes)`

♦ Mean mark (b) 47%

`text(Locate 60 minutes on)\ y text(-axis and look for longest)`

`text{duration (i.e. the largest}\ x text{-axis value)}\ text(for that)`

`text(given)\ y text(-value.)`


iii.  `text(It suggests that the longer an eruption lasts for,)`

`text(the longer you will wait until the next one, or)`

`text(there is a positive correlation between the length)`

`text(of an eruption and the time until the next one.)`

Filed Under: Correlation / Body Measurements, Other Graphs, S3 Further Statistical Analysis (Y12) Tagged With: Band 4, Band 5, smc-1113-30-Correlation

Measurement, STD2 M7 2012 HSC 28c

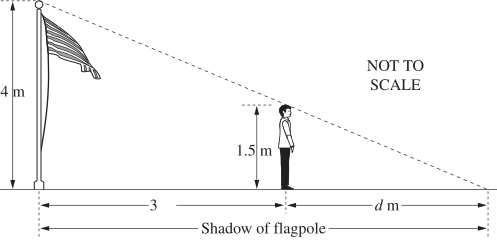
Jacques and a flagpole both cast shadows on the ground. The difference between the lengths of their shadows is 3 metres.
 

What is the value of `d`, the length of Jacques’ shadow?     (3 marks)

--- 6 WORK AREA LINES (style=lined) ---

Show Answers Only

 `d = 1.8\  text(m)`

Show Worked Solution
♦♦ Mean mark 24%

`text{Both triangles have right-angles with a common (ground) angle.}`

`:.\ text{Triangles are similar (equiangular)}`
 

` text{Since corresponding sides are in the same ratio}`

`d/1.5` `= (d+3)/4`
`4d` `= 1.5(d + 3)`
`8d` `= 3(d + 3)`
  `= 3d + 9`
`5d` `= 9`
`:.d` `= 9/5`
  `=1.8\ text(m)`

Filed Under: M5 Scale Drawings (Y12), Ratio and Scale, Similarity, Similarity and Scale Tagged With: Band 5, num-title-ct-pathc, num-title-qs-hsc, smc-1105-30-Similarity, smc-1187-60-Similarity, smc-4746-50-Real world applications

Algebra, 2UG 2012 HSC 28b

Simplify fully  `(18ab)/(3a^2) xx c/b`.   (2 marks)

Show Answers Only

 `(6c)/a`

Show Worked Solution
♦ Mean mark 35%!
`(18ab)/(3a^2) xx c/b` `= (18abc)/(3a^2b)`
  `=(6c)/a`

Filed Under: Index and Log Laws, Indices Tagged With: Band 5, num-title-ct-pathb, num-title-qs-hsc, smc-4228-10-Positive integers

Probability, STD2 S2 2012 HSC 27e

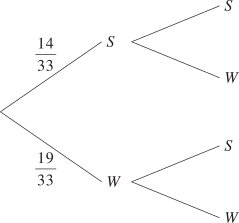
A box contains 33 scarves made from two different fabrics. There are 14 scarves made from silk (S) and 19 made from wool (W).
Two girls each select, at random, a scarf to wear from the box.

  1. Complete the probability tree diagram below.   (2 marks) 


    --- 0 WORK AREA LINES (style=lined) ---

  2. Calculate the probability that the two scarves selected are made from silk.   (1 mark)

    --- 2 WORK AREA LINES (style=lined) ---
  3. Calculate the probability that the two scarves selected are made from different fabrics.   (2 marks)

    --- 4 WORK AREA LINES (style=lined) ---
Show Answers Only

a. 


b.    `P\ text{(2 silk)}= 91/528`

c.    `P\ text{(different fabrics)}= 133/264`

Show Worked Solution

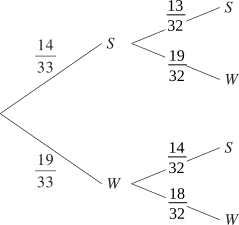
a. 

♦ Mean mark (a) 43%.
b.    `P\ text{(2 silk)}` `= P(S_1) xx P(S_2)`
  `= 14/33 xx 13/32= 91/528`


c.    `P\ text{(different)}` `= P (S_1,W_2) + P(W_1,S_2)`
  `= (14/33 xx 19/32) + (19/33 xx 14/32)`
  `= 532/1056= 133/264`
♦ Mean mark (c) 41%.
MARKER’S COMMENT: In better responses, students multiplied along the branches and then added these two results together

Filed Under: Multi-stage Events, Multi-Stage Events, Multi-Stage Events, Single and Multi-Stage Events, Single and Multi-Stage Events Tagged With: Band 4, Band 5, num-title-ct-corea, num-title-qs-hsc, smc-1135-10-Probability Trees, smc-4238-10-Dependent events, smc-4238-50-Probability trees, smc-6935-10-Probability Trees, smc-829-10-Probability Trees

Measurement, STD2 M6 2012 HSC 27d

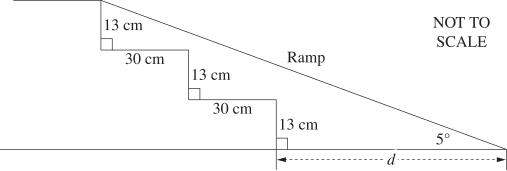
A disability ramp is to be constructed to replace steps, as shown in the diagram.

The angle of inclination for the ramp is to be 5°.   
  

Calculate the extra distance, `d`, that the ramp will extend beyond the bottom step.

Give your answer to the nearest centimetre.   (3 marks)

--- 6 WORK AREA LINES (style=lined) ---
Show Answers Only

 `386\  text(cm)`

Show Worked Solution

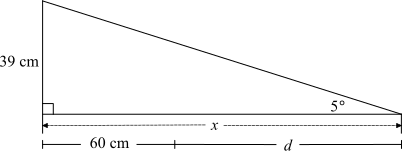
`text(Let the horizontal part of the ramp) = x\ text(cm)`

♦♦ Mean mark 35%
MARKER’S COMMENT:  The better responses used a diagram of a simplified version of the ramp as per the Worked Solution.
`tan5^@` `= 39/x`
`x` `= 39/tan5^@`
  `= 445.772\ …`


`text(S)text(ince)\  \ x` `= 60 + d`
`d` `=445.772-60`
  `=385.772\  text(cm)`
  `=386\ text(cm)\ \ text{(nearest cm)}`

Filed Under: 2-Triangle and Harder Examples, M3 Right-Angled Triangles (Y12), Pythagoras and Right-angled Trig, Pythagoras and Right-Angled Trig, Right-angled Triangles (Y12), Right-Angled Trig Tagged With: Band 5, num-title-ct-corea, num-title-qs-hsc, smc-1103-20-Right-angled Trig, smc-4552-40-Real world applications, smc-4552-45-2-triangles, smc-6834-20-Trigonometry, smc-6928-20-Right-Angled Trig, smc-802-20-Right-Angled Trig

Measurement, STD2 M7 2012 HSC 27c

A map has a scale of  1 : 500 000.

  1. Two mountain peaks are 2 cm apart on the map.


    What is the actual distance between the two mountain peaks, in kilometres?   (1 mark)

    --- 3 WORK AREA LINES (style=lined) ---

  2. Two cities are 75 km apart. How far apart are the two cities on the map, in centimetres?   (1 mark)

    --- 2 WORK AREA LINES (style=lined) ---
Show Answers Only

a.    `text(10 km)`

b.    `text(15 cm)`

Show Worked Solution
♦ Mean mark 37%
MARKER’S COMMENT: Better responses realised that 1 unit on the map represented 1 unit x 500,000 in real life.
a.    `text{Actual distance (2 cm)}` `= 2 xx 500\ 000`
  `= 1\ 000\ 000\ text(cm)`
  `= 10\ 000\ text(m)=10\ text(km)`

  
`:.\ text(The 2 mountain peaks are 10 km apart.)`


♦ Mean mark 44%

b.    `text(Cities are 75 km apart.)`

`text{From part (i), we know 2 cm = 10 km}`

`=>\ text(1 cm = 5 km)`

`=>\ text(On the map,  75 km)= 75/5=15\ text(cm)` 

`:.\ text(Distance on the map is 15 cm.)`

Filed Under: M5 Scale Drawings (Y12), Ratio and Scale, Ratios, Ratios, Similarity, Similarity and Scale Tagged With: Band 5, num-title-ct-corea, num-title-qs-hsc, smc-1105-20-Maps and Scale Drawings, smc-1187-40-Maps and Scale Drawings, smc-4746-60-Scale drawings, smc-6858-10-Maps and Scale Drawings, smc-6931-40-Maps and Scale Drawings

Measurement, STD2 M1 2012 HSC 27b

The sector shown has a radius of 13 cm and an angle of 230°. 
 

 2012 27b
 

 What is the perimeter of the sector to the nearest centimetre?   (2 marks) 

--- 4 WORK AREA LINES (style=lined) ---

Show Answers Only

`text{78 cm (nearest cm)}`

Show Worked Solution
♦ Mean mark 39%
MARKER’S COMMENT: The formula of the length of an arc is given in the formula sheet.

`text(Perimeter)= 2 xx text(radius) + text(arc length)`

`text(Arc length)` `= theta/360 xx 2 xx pi xx r`
  `= 230/360 xx 2 xx pi xx 13`
  `= 52.1853…`

  
`:.\ text(Perimeter)= 2 xx 13 + 52.1853…= 78.1853…=text{78 cm (nearest cm)}`

Filed Under: MM6 - Spherical Geometry, Perimeter and Area, Perimeter and Area, Perimeter and Area, Perimeter, Area and Volume Tagged With: Band 5, smc-1121-20-Perimeter and Area (Circular Measure), smc-6483-40-Perimeter (Circular Measure), smc-6520-40-Perimeter (Circular Measure), smc-798-20-Perimeter and Area (Circular Measure)

Statistics, STD2 S1 2012 HSC 28d

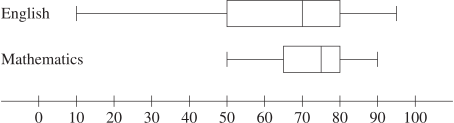
The test results in English and Mathematics for a class were recorded and displayed in the box-and-whisker plots.
 

  1. What is the interquartile range for English?   (1 mark)

    --- 1 WORK AREA LINES (style=lined) ---
  2. Compare and contrast the two data sets by referring to the skewness of the distributions and the measures of location and spread.   (3 marks)

    --- 6 WORK AREA LINES (style=lined) ---
Show Answers Only

a.    `text{IQR}_text{(English)}\ = 80-50=30`

b.    `text(Skewness)`

  • `text(English has greater negative skew)`
  • `text(Maths is more normally distributed)`

`text(Location and Spread)`

  • `text(English has a range of 85, Maths has 40.)`
  • `text{English has larger IQR than Maths (30 vs 15)}`
  • `text{Maths’ median (75) is higher than English (70)}`
  • `text{Same upper quartile marks (80)}`
  • `text(English has highest and lowest individual mark)`
Show Worked Solution

a.    `text{IQR}_text{(English)}\ = 80-50=30`

♦ Mean mark (b) 35%
MARKER’S COMMENT: Markers are looking for students to use the correct language of location and spread such as mean, median, interquartile range, standard deviation and skewness.

b.  `text(Skewness)`

  • `text(English has greater negative skew)`
  • `text(Maths is more normally distributed)`

`text(Location and Spread)`

  • `text(English has a range of 85, Maths has 40.)`
  • `text{English has larger IQR than Maths (30 vs 15)}`
  • `text{Maths’ median (75) is higher than English (70)}`
  • `text{Same upper quartile marks (80)}`
  • `text(English has highest and lowest individual mark)`

Filed Under: Stem & Leaf, Box & Whisker, Summary Statistics - Box Plots, Summary Statistics - Box Plots, Summary Statistics - Box Plots Tagged With: Band 4, Band 5, common-content, smc-1000-20-Parallel Box-Plots, smc-6313-20-Parallel Box Plots, smc-825-20-Parallel Box-Plots

Financial Maths, STD2 F4 2011* HSC 10 MC

A television was purchased for $2100 on 12 April 2011 using a credit card. Compound interest was charged daily at a rate basis 19.71% per annum for purchases on this credit card. There were no other purchases on this credit card account.

There was no interest-free period. The period for which interest was charged included the date of purchase and the date of payment.

What amount was paid when the account was paid in full on 20 May 2011?

  1. $2143.09
  2. $2143.53
  3. $2144.23
  4. $2144.68
Show Answers Only

`D`

Show Worked Solution
♦♦ Mean mark 32%
COMMENT: Make sure you know how to adjust an annual rate to a daily rate, as shown in the Worked Solutions.

`text(Days for interest)\ (n) =19+20=39`

`text(Daily interest rate)\ (r) = 0.1971/365 = 0.00054`

`text{Total paid}\ (FV)` `= PV (1+r)^n`
  `=2100(1.00054)^39=$2144.68`

  
`=>D`

Filed Under: Credit Cards, Credit Cards, Credit Cards, FM4 - Credit and Borrowing, Loans and Credit Cards Tagged With: Band 5, smc-6847-10-Interest on Purchases, smc-6927-10-Interest on Purchases, smc-814-10-Credit Cards

Statistics, STD2 S1 2011 HSC 7 MC

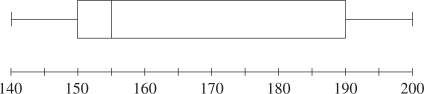
A set of data is displayed in this box-and-whisker plot.
 

Which of the following best describes this set of data?

  1. Symmetrical
  2. Positively skewed
  3. Negatively skewed
  4. Normally distributed
Show Answers Only

`B`

Show Worked Solution

`text{Since the median (155) is closer to the}`

`text{lower quartile (150) and range low (140)}`

`text{than the upper quartile (190) and range}` 

`text{high (200), it is positively skewed.}`

`=>B`

♦ Mean mark 47%.

Filed Under: Box Plots and 5-Number Summary, Stem & Leaf, Box & Whisker, Summary Statistics, Summary Statistics - Box Plots, Summary Statistics - Box Plots, Summary Statistics - Box Plots, Summary Statistics - Box Plots Tagged With: Band 5, common-content, num-title-ct-corea, num-title-qs-hsc, smc-1000-10-Single Box-Plots, smc-1131-35-Box Plots, smc-5021-50-Box plot (single), smc-5021-70-Skew, smc-6313-10-Single Box Plots, smc-6533-10-Single Box Plots, smc-825-10-Single Box-Plots

Algebra, STD2 A4 2011 HSC 6 MC


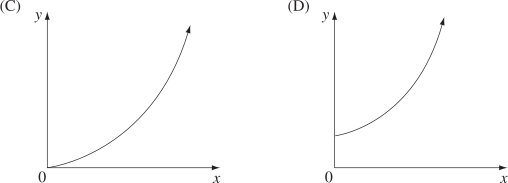
Which of the following graphs best represents the equation `y = a^x`, where `a` is a positive number greater than 1?
  

Show Answers Only

`D`

Show Worked Solution
 
♦ Mean mark 48%

`text(At) \ x=0,\ y=1`

`text(As)\ x uarr, \ \ y ↑\ text(exponentially)`

`=>D`

Filed Under: Exponential/Quadratic (Projectile), Exponentials, Non-Linear: Exponential/Quadratics Tagged With: Band 5, num-title-ct-corea, num-title-qs-hsc, smc-4444-10-Identify graphs, smc-830-10-Identify Graphs

Algebra, STD2 A1 2010 HSC 7 MC

If  `M=-9`, what is the value of   `(3M^2+5M)/6`

  1. `-250.5`
  2. `-48`
  3. `\ \ \ 33`
  4. `\ \ \ 235.5`
Show Answers Only

`C`

Show Worked Solution
 ♦♦ Only 31% of students answered correctly!
`(3M^2+5M)/6` `=(3xx(–9)^2+5xx(–9))/6`
  `=((3xx81)-45)/6`
  `=33`

`=>  C`

Filed Under: AM1 - Algebra (Prelim), Substitution and Other Equations, Substitution and Other Equations, Substitution and Other Equations, Substitution and Other Equations Tagged With: Band 5, smc-1116-10-Substitution, smc-6234-10-Substitution, smc-6508-10-Substitution, smc-789-10-Substitution

Financial Maths, STD2 F1 2010 HSC 2 MC

A new phone was purchase for $725 which included 10% GST.

What was the price of the phone without GST, correct to the nearest cent? 

  1.    $65.91
  2.    $72.50
  3.    $652.50
  4.    $659.09
Show Answers Only

`D`

Show Worked Solution
♦ Mean mark 44%.
COMMENT: A surprise this was so poorly answered. Ensure you understand this tax!
`text(Phone price)\ +\ text(10% GST)` `=725`
`text(110%)\ xx\ text(Phone price)` `=725`
`:.\ text(Phone price)` `=725/1.1`
  `=$659.09`

`=>  D`

Filed Under: FM3 - Taxation, Purchasing Goods, Purchasing Goods, Tax and Percentage Increase/Decrease, Tax and Percentage Increase/Decrease Tagged With: Band 5, smc-1125-20-GST, smc-6278-20-GST/VAT, smc-6517-20-GST/VAT, smc-831-20-GST

Measurement, STD2 M7 2012 HSC 26f

The capture-recapture technique was used to estimate a population of seals in 2012.

•   60 seals were caught, tagged and released.

•   Later, 120 seals were caught at random.

•   30 of these 120 seals had been tagged.

The estimated population of seals in 2012 was 11% less than the estimated population for 2008. 

What was the estimated population for 2008?   (2 marks)

--- 4 WORK AREA LINES (style=lined) ---
Show Answers Only

`text{270 seals (nearest whole)}`

Show Worked Solution

`text(Let population in 2012 =)\ P(2012)`

COMMENT: Std2 sample exam questions from NESA included capture/recapture as examinable content within M7 Rates and Ratios.

`text(Capture)`

`=> 60/{P(2012)} `

`text(Recapture)`

`=> 30/120 = 1/4`

`60/{P(2012)}` `=1/4`
`:. P(2012)` `= 60 xx 4 =240`


♦♦ Mean mark 26%
MARKER’S COMMENT: The most successful approach was to use the ‘unitary method’ (i.e. calculate what 1% is worth, then multiply it by 89), as shown in the Worked Solution.

`text(We know)\ P(2008)\ text(less 11% = 240)`

`text{(100% – 11%)} xx  P(2008)` `= 240`
`text(89%) xxP(2008)` `=240`
`:. text(1%) xxP(2008)` `=240/89=2.6966…`
`P(2008)` `= 100xx2.6966…`
  `= 269.6629…`
  `=270\ \ text{(nearest whole)}`

  
`:.\ text{2008 population estimate = 270 seals}`

Filed Under: DS5/6 - Normal Distribution and Sampling, Ratio and Scale, Ratios Tagged With: Band 5, smc-1187-30-Capture/Recapture, smc-6931-30-Capture/Recapture

Financial Maths, STD2 F4 2012* HSC 26c

Heather used her credit card to purchase a plane ticket valued at $1990 on 28 January 2011. She made no other purchases on her credit card account in January. She paid the January account in full on 19 February 2011. 

The credit card account has no interest free period. Compound interest is charged daily at the rate of 21.9% per annum, including the date of purchase and the date the account is paid.

How much interest did she pay, to the nearest cent?   (2 marks)

--- 4 WORK AREA LINES (style=lined) ---
Show Answers Only

 `$27.64`

Show Worked Solution

`text(Days of interest)\ (n) = 4+19=23`

`text(Daily interest rate)\ (r) = 0.219/365=0.0006`

♦ Mean mark 38%
MARKER’S COMMENT: Too many students calculated the # days as 22 instead of 23!  
`text(Total Paid)\ (FV)` `= PV(1+r)^n`
  `= 1990(1.0006)^23`
  `=2017.644…=$2017.64`

  
`:.\ text(Interest Paid)=2017.64-1990=$27.64`

Filed Under: Credit Cards, Credit Cards, Credit Cards, FM4 - Credit and Borrowing, Loans and Credit Cards Tagged With: Band 5, smc-6847-10-Interest on Purchases, smc-6927-10-Interest on Purchases, smc-814-10-Credit Cards

Probability, STD2 S2 2012 HSC 26a

Postcodes in Australia are made up of four digits eg 2040.  

  1. How many different postcodes beginning with a 2 are possible?  (1 mark)

    --- 2 WORK AREA LINES (style=lined) ---
Peta remembers that the first two digits of a town’s postcode are 2 and then 4. She is unable to remember the rest of the postcode.
 

2012 26a

  1. What is the probability that Peta guesses the correct postcode? (1 mark)

    --- 2 WORK AREA LINES (style=lined) ---

Show Answers Only
  1. `1000`
  2. `P\ (text(Correct)) =\ 1/100`
Show Worked Solution

i.  `text(Different postcodes begining with)\ 2`

♦ Mean marks of 43% and 41% for parts (i) and (ii) respectively.

`=1 xx 10 xx 10 xx 10`

`=1000`


ii.  `text(Number of postcodes beginning with)\ 2,4`

`= 1 xx 1 xx 10 xx 10`

`=100`

`:. P\ (text(Correct)) = 1/100`  

Filed Under: # Combinations, Combinations, Combinations and Single Stage Events Tagged With: Band 5, smc-1134-20-Number Combinations, smc-828-20-Number Combinations

Probability, STD2 S2 2012 HSC 17 MC

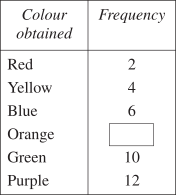
A spinner with different coloured sectors is spun 40 times. The results are recorded in the table.

 What is the relative frequency of obtaining the colour orange? 

  1. `3/20`  
  2. `1/5`  
  3. `6`  
  4. `8` 
Show Answers Only

`A`

Show Worked Solution
♦♦ Mean mark 34%
COMMENT: Note that relative frequency is the frequency of an event divided by the total frequencies (i.e. the probability).
`text(Total frequency)` `= 40\ text(spins)`
`text(Orange freq.)` `= 40-(2 + 4 + 6 + 10 +12)`
  `=6`
`:.\ text(Relative freq.)` `= 6/40 = 3/20`

 
`=>  A`

Filed Under: Data, Expected/Relative Frequency, Probability, Relative Frequency, Relative Frequency, Relative Frequency, Relative Frequency Tagged With: Band 5, common-content, num-title-ct-core, num-title-qs-hsc, smc-1133-20-Games of Chance, smc-4225-35-Relative frequency, smc-6805-40-Games of Chance, smc-6888-20-Games of Chance, smc-6888-35-Relative Frequency, smc-827-20-Games of Chance, smc-990-20-Games of Chance

Probability, STD2 S2 2012 HSC 12 MC

Two unbiased dice, each with faces numbered 1, 2, 3, 4, 5, 6, are rolled. 

What is the probability of a 6 appearing on at least one of the dice? 

  1. `1/6`  
  2. `11/36` 
  3. `25/36`  
  4. `5/6`  
Show Answers Only

`B`

Show Worked Solution

`text(Method 1: Using an array`

`P text{(at least 1 six)}=11/36`

\begin{align}
\textbf{Die B }
\begin{array}{c}
\textbf{Die A}  \\
\begin{array}{c|c|c|c|c|c|c}
\ & 1 & 2 & 3 & 4 & 5 & 6  \\
\hline
\ 1 & 1,1  & 1,2 & 1,3 & 1,4 & 1,5 & \fcolorbox{red}{white}{1,6} \\
\hline
\ 2 & 2,1 & 2,2 & 2,3 & 2,4 & 2,5 & \fcolorbox{red}{white}{2,6}  \\
\hline
\ 3 & 3,1 & 3,2 & 3,3 & 3,4 & 3,5 & \fcolorbox{red}{white}{3,6}  \\
\hline
\ 4 & 4,1 & 4,2 & 4,3 & 4,4 & 4,5 & \fcolorbox{red}{white}{4,6}  \\
\hline
\ 5 & 5,1 & 5,2 & 5,3 & 5,4 & 5,5 & \fcolorbox{red}{white}{5,6}  \\
\hline
\ 6 & \fcolorbox{red}{white}{6,1} & \fcolorbox{red}{white}{6,2} & \fcolorbox{red}{white}{6,3} & \fcolorbox{red}{white}{6,4} & \fcolorbox{red}{white}{6,5} & \fcolorbox{red}{white}{6,6}  \\
\end{array}
\end{array}
\end{align}


`text(Method 2: Using )P text{(E)} = 1-P\text{(not E)}`
  

`P text{(at least 1 six)}`

`=1-P text{(no six)} xx P text{(no six)} `

`=1-5/6 xx 5/6=11/36`

`=>  B`

♦♦♦ Mean mark 25%
COMMENT: The term “at least” should flag that calculating the probability of `1-P text{(event not happening)}` is likely to be the most efficient way to solve.

Filed Under: Multi-stage Events, Multi-Stage Events, Single and Multi-Stage Events, Single and Multi-Stage Events, Single and Multi-Stage Events Tagged With: Band 5, num-title-ct-pathb, num-title-qs-hsc, smc-1135-20-Other Multi-Stage Events, smc-1135-30-\(P(\text{E})=1-P(\text{not E})\), smc-4238-70-Complementary events, smc-4238-80-"at least", smc-6887-50-Other Multi-stage Events, smc-6887-80-Arrays, smc-6935-25-Other Multi-Stage Events, smc-6935-30-\(P\text{(E)} = 1-P\text{(not E)}\), smc-829-20-Other Multi-Stage Events, smc-829-30-P(E) = 1 - P(not E)

Statistics, STD2 S4 2012 HSC 11 MC

Which of the following relationships would most likely show a negative correlation?

  1. The population of a town and the number of hospitals in that town. 
  2. The hours spent training for a race and the time taken to complete the race. 
  3. The price per litre of petrol and the number of people riding bicycles to work. 
  4. The number of pets per household and the number of computers per household. 
Show Answers Only

\(B\)

Show Worked Solution

\(\text{Increased hours training should reduce the time}\)

\(\text{to complete a race.}\)

\(\Rightarrow B\)

♦ Mean mark 43%.

Filed Under: Bivariate Data, Bivariate Data Analysis, Bivariate Data Analysis (Y12), Correlation / Body Measurements, S3 Further Statistical Analysis (Y12), S4 Bivariate Data Analysis (Y12) Tagged With: Band 5, common-content, num-title-ct-coreb, num-title-qs-hsc, smc-1001-30-Correlation, smc-1113-30-Correlation, smc-5022-30-Correlation, smc-5022-35-Causality, smc-6934-30-Correlation, smc-785-30-Correlation

Financial Maths, STD2 F4 2012 HSC 9 MC

Tracy invests some money for 2 years at 4% per annum, compounded quarterly. 

2012 9 mc

Which figure from the table should Tracy use to calculate the value of her investment at the end of 2 years?

  1.   1.020 
  2.   1.082
  3.   1.083
  4.   1.369
Show Answers Only

`C`

Show Worked Solution
♦♦♦ Mean mark 24%. The lowest MC mean mark in the 2012 exam.
COMMENT: A process to follow: 1-convert the annual rate to the rate per compounding period. 2-calculate the number of compounding periods.

`text(4% annual)`

`=>\ text(4%)/4=text(1% compounded each quarter)`

`=>n=8\ \ \ \ \ \ text{(8 quarters in 2 years)}`


`:.\ text{Factor = 1.083   (from table)}`

`=>  C`

Filed Under: Compound Interest and Shares, F2 Investment (Y12), FM2 - Investing, Modelling Investments and Loans Tagged With: Band 5, common-content, smc-1002-10-Compounded Value of $1 Table, smc-1108-40-Compounded Value of $1, smc-817-10-Compounded Value of $1 Table

Algebra, STD2 A2 2012 HSC 5 MC

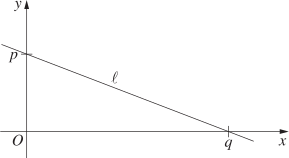
The line  `l`  has intercepts  `p`  and  `q`,  where  `p`  and  `q`  are positive integers. 
  

What is the gradient of line  `l ` ? 

  1. `-p/q`  
  2. `-q/p`  
  3. `p/q`  
  4. `q/p`  
Show Answers Only

`A`

Show Worked Solution
 
♦ Mean mark 45%
`text(Gradient)` `= text(rise)/text(run)`
  `= -p/q`

`=>  A`

Filed Under: AM2 - Linear Relationships (Prelim), Cartesian Plane, Linear Equations and Basic Graphs, Linear Equations and Basic Graphs, Linear Modelling and Basic Graphs, Linear Modelling and Basic Graphs Tagged With: Band 5, num-title-ct-pathc, num-title-qs-hsc, smc-1118-10-Gradient, smc-4422-20-Gradient, smc-6255-10-Find Gradient/Intercept, smc-6512-10-Find Gradient/Intercept, smc-792-10-Gradient

Probability, 2UG 2012 HSC 3 MC

A pair of players is to be selected from 6 people.

How many different pairs of players can be selected?

(A)   `6`

(B)  `12`  

(C)  `15` 

(D)  `30` 

Show Answers Only

`C`

Show Worked Solution
♦ Mean mark 40%
COMMENT: Calculating #combinations involving unordered pairs has proven very challenging to a majority of students in past exams. Ensure you understand this concept.

`text(Arrangements of)\ \ 2 = 2 xx 1 = 2`

`text(# Different pairs)\ \ = (6xx5)/(2xx1) = 15`

`=>  C`


Filed Under: # Combinations Tagged With: Band 5

Measurement, STD2 M1 2013 HSC 25 MC

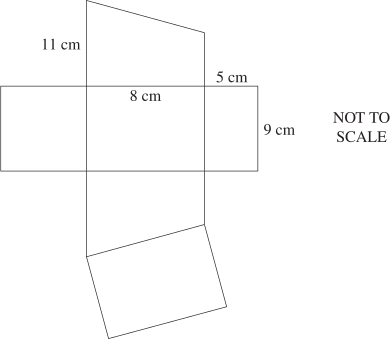
A net is made using four rectangles and two trapeziums. It is folded to form a solid.
  

 What is the volume of the solid, in cm3 ?

  1. `360\ text(cm)^3`
  2. `434\ text(cm)^3`
  3. `440\ text(cm)^3`
  4. `576\ text(cm)^3`
Show Answers Only

`D`

Show Worked Solution

`text(Volume)=Ah,text(where)\ A\ text(is the area of a trapezium)`

♦ Mean mark 35%
COMMENT: Note that `h` in the “area” formula is different to the `h` used in the “volume” formula.
`A` `=1/2 h(a+b)`
  `=1/2xx8(11+5)=64\ text(cm)^2`

  
`:.V=Ah=64xx9=576\ text(cm)^3`

`=>  D`

Filed Under: MM2 - Perimeter, Area and Volume (Prelim), Perimeter and Area, Perimeter, Area and Volume, Volume, Mass and Capacity Tagged With: Band 5, smc-6304-40-Volume, smc-798-40-Volume

Measurement, STD2 M6 2013 HSC 24 MC

What is the value of  `theta`,  to the nearest degree?

2013 24 mc

  1.    `21^@`
  2.    `32^@`
  3.    `43^@`
  4.    `55^@`
Show Answers Only

`C`

Show Worked Solution
`a/sinA` `=b/sinB`
`82/sinA` `=100/sin26`
`sin A` `=(82 xx sin26)/100`
  `=0.35946…`
`/_A` `=21^@\ \ \ \ text{(nearest degree)}`

 
`text(S)text(ince)\   180^@\ text(in)\ Delta:`

`90+26+(theta+21)` `=180`
`theta` `=43^@`

 
`=>  C`

Filed Under: 2-Triangle and Harder Examples, Non-Right Angled Trig, Non-right-angled Trig Tagged With: Band 5, smc-6929-20-Sine Rule, smc-6929-40-2-Triangle, smc-804-20-Sine Rule, smc-804-40-2-Triangle

Algebra, STD2 A1 2013 HSC 21 MC

Which equation correctly shows  `r`  as the subject of  `S=800(1-r)`?

  1. `r=(800-S)/800`
  2. `r=(S-800)/800`
  3. `r=800-S`
  4. `r=S-800`
Show Answers Only

`A`

Show Worked Solution
♦♦♦ Mean mark 27%
`S` `=800(1-r)`
`1-r` `=S/800`
`r` `=1-S/800`
  `=(800-S)/800`

 
`=>\ A`

Filed Under: Formula Rearrange, Formula Rearrange, Formula Rearrange, Formula Rearrange, Formula Rearrange, Linear Tagged With: Band 5, num-title-ct-pathc, num-title-qs-hsc, smc-1200-10-Linear, smc-1201-10-Linear, smc-4362-20-Formula rearrange, smc-6236-10-Linear, smc-6511-10-Linear

Probability, STD2 S2 2013 HSC 18 MC

Two unbiased dice, each with faces numbered  1, 2, 3, 4, 5, 6,  are rolled.

What is the probability of obtaining a sum of 6?

  1. `1/6`
  2. `1/12`
  3. `5/12`
  4. `5/36`
Show Answers Only

`D`

Show Worked Solution

`text(Total outcomes)=6xx6=36`

`text{Outcomes that sum to 6}=text{(1,5) (5,1) (2,4) (4,2) (3,3)} =5`

`:.\ P\text{(sum of 6)} =5/36`

`=> D`

♦♦ Mean mark 35%.

Filed Under: Multi-stage Events, Multi-Stage Events, Multi-Stage Events, Single and Multi-Stage Events, Single and Multi-Stage Events, Single and Multi-Stage Events Tagged With: Band 5, num-title-ct-corea, num-title-qs-hsc, smc-1135-20-Other Multi-Stage Events, smc-4238-20-Independent events, smc-6887-50-Other Multi-stage Events, smc-6935-25-Other Multi-Stage Events, smc-829-20-Other Multi-Stage Events

  • « Previous Page
  • 1
  • …
  • 82
  • 83
  • 84
  • 85
  • Next Page »

Copyright © 2014–2026 SmarterEd.com.au · Log in