SmarterEd

Aussie Maths & Science Teachers: Save your time with SmarterEd

  • Login
  • Get Help
  • About

Financial Maths, STD2 EQ-Bank 20

Kimberley uses a buy now, pay later payment option to make a purchase of $100. Her repayments are split across 4 equal payments over 6 weeks. No interest is charged.

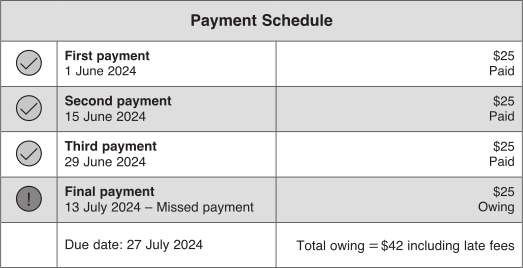
Kimberley misses her final payment and is charged a late fee of $17. Kimberley’s payment schedule is shown, with her balance totalling $42.
 

  1. Find the total amount Kimberley pays for her purchase if repaying in full on 27 July 2024.   (1 mark)

    --- 3 WORK AREA LINES (style=lined) ---

  2. Kimberley’s bank offers short-term loans where simple interest is charged at 18% per annum.
  3. Suppose Kimberley had borrowed $100 from the bank to make this purchase on 1 June 2024 and repaid it in full 8 weeks later.
  4. How much would Kimberley have saved using this approach instead of the buy now, pay later option?   (2 marks)

    --- 7 WORK AREA LINES (style=lined) ---

Show Answers Only

a.    \($117\)

b.    \($14.24\)

Show Worked Solution

a.    \(\text{If total owing paid on 27 July:}\)

\(\text{Total paid} = 25+25+25+42=$117\)
 

b.    \(r=18\%=0.18,\ \ n=\dfrac{8 \times 7}{365} = \dfrac{56}{365}\)

\(I=Prn=100 \times 0.18 \times \dfrac{56}{365} = 2.761… = $2.76 \)

\(\text{Amount saved} = 17-2.76=$14.24\)

Filed Under: Loans Tagged With: Band 3, Band 4, smc-6926-10-Buy Now Pay Later, syllabus-2027

Networks, STD2 EQ-Bank 3 MC

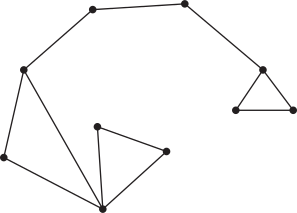
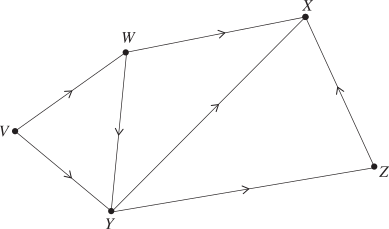
A network of pipes is shown.
 

Which vertex in this network represents the sink?

  1. \(V\)
  2. \(X\)
  3. \(Y\)
  4. \(Z\)
Show Answers Only

\(B\)

Show Worked Solution

\(\text{The sink is the vertex where all flow finishes and no flow leaves.}\)

\(\Rightarrow B\)

Filed Under: Network Flow (Y12) Tagged With: Band 3, smc-6915-40-Other Directed Flows

Statistics, STD2 EQ-Bank 5 MC

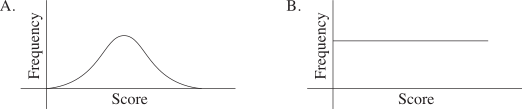
Which graph represents a negatively skewed distribution?


Show Answers Only

\(D\)

Show Worked Solution

\(\text{Negatively skewed graphs have a long tail to the left.}\)

\(\Rightarrow D\)

Filed Under: Measures of Centre and Spread Tagged With: Band 3, smc-6312-45-skew

Financial Maths, STD1 F1 EQ-Bank 12

Ethan has a weekly net income of $580 from his part-time job at JB Hi-Fi. He has created the following budget:

Item Weekly amount
Rent $220
Food $120
Transport $60
Other expenses $50
Savings $130

 
Ethan is saving for an overseas trip that will cost $4680.

  1. How many weeks will it take Ethan to save enough for the trip if he sticks to this budget?   (1 mark)

    --- 2 WORK AREA LINES (style=lined) ---

  2. Ethan decides to save more by reducing his "Food" by $20 per week and reducing his "Other expenses" to $20 per week.
  3. Determine how many fewer weeks it will now take Ethan to save for the trip.   (2 marks)

    --- 6 WORK AREA LINES (style=lined) ---

Show Answers Only

a.    \(\text{36 weeks}\)

b.    \(\text{10 fewer weeks}\)

Show Worked Solution

a.    \(\text{Calculate weeks to save:}\)

\(\text{Weeks}=\dfrac{4680}{130}=36\ \text{weeks}\)


b.    \(\text{Calculate new weekly savings:}\)

\(\text{Food reduction}=\$20\)

\(\text{Other expenses reduction}= 50- 20=\$30\)

\(\text{Extra savings per week}= 20+ 30=\$50\)

\(\text{New weekly savings}= 130+ 50=\$180\)

\(\text{New weeks}=\dfrac{4680}{180}=26\ \text{weeks}\)

\(\therefore\ \text{Fewer weeks}= 36- 26=10\ \text{fewer weeks}\)

Filed Under: Earning Money and Budgeting Tagged With: Band 3, Band 4, smc-1126-30-Budgeting

Financial Maths, STD1 F1 EQ-Bank 12

Daniel earns $32 per hour as a delivery driver. He is also paid a $12 fuel allowance per shift.

How much will he earn from a 5-hour shift?   (2 marks)

--- 4 WORK AREA LINES (style=lined) ---
Show Answers Only

\(\$172\)

Show Worked Solution

\(\text{Wages}=5\times 32=\$160\)

\(\text{Total earnings}= 160+ 12=\$172\)

Filed Under: Earning Money and Budgeting Tagged With: Band 3, smc-1126-10-Wages

Algebra, STD1 EQ-Bank 13

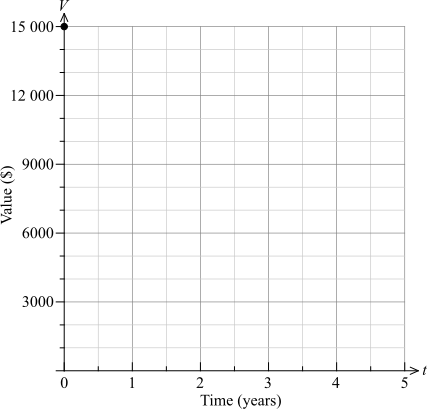
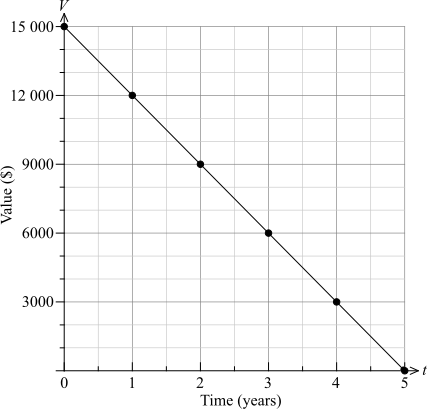
A boat is purchased for $15 000. It depreciates in value by $3000 per year.

Let  \(V\) = Value of the boat in dollars, and  \(t\) = time in years.

  1. Complete the table of values below that models the relationship between the value of the boat and time in years.   (1 mark)
      
    \(\begin{array}{|c|c|c|c|c|c|c|} \hline \vphantom{\dfrac{1}{1}}\quad t \quad & \quad 0 \quad & \quad 1 \quad & \quad 2 \quad & \quad 3 \quad & \quad 4 \quad & \quad 5 \quad \\[6pt] \hline \vphantom{\dfrac{1}{1}}V & 15\,000 &  & 9000 &  & 3000 &  \\[12pt] \hline \end{array}\)

    --- 0 WORK AREA LINES (style=lined) ---

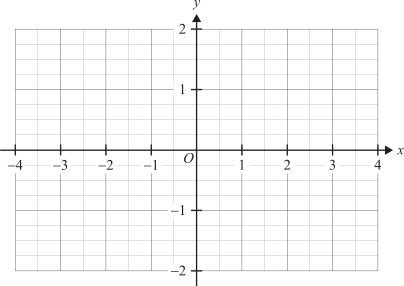
  2. Using the table of values from (a), neatly graph the value of the boat from 0 to 5 years on the grid below.   (2 marks)

    --- 0 WORK AREA LINES (style=lined) ---


  3. Identify ONE limitation of this linear model.   (1 mark)

    --- 3 WORK AREA LINES (style=lined) ---

Show Answers Only

a.    \(\text{Table of values}\)

\begin{array}{|c|c|c|c|c|c|c|} \hline t & 0 & 1 & 2 & 3 & 4 & 5 \\ \hline V & 15\ 000 & \textbf{12 000} & 9000 & \textbf{6000} & 3000 & \ \ \ \ \textbf{0}\ \ \ \  \\ \hline \end{array}

b.  


c.     \(\text{Limitations could include ONE of the following:}\)

    • \(\text{The model predicts the boat has zero value after 5 years, which is}\)
      \(\text{unrealistic as most boats retain some value.}\)
    • \(\text{Beyond 5 years the model would predict a negative value, which is}\)
      \(\text{not possible.}\)
    • \(\text{The model assumes a constant rate of depreciation, but in reality}\)
      \(\text{a boat may depreciate more quickly in early years.}\)
Show Worked Solution

a.    \(\text{Table of values}\)

\begin{array}{|c|c|c|c|c|c|c|} \hline t & 0 & 1 & 2 & 3 & 4 & 5 \\ \hline V & 15\ 000 & \textbf{12 000} & 9000 & \textbf{6000} & 3000 & \ \ \ \ \textbf{0}\ \ \ \  \\ \hline \end{array}

 
b.  


c.     \(\text{Limitations could include ONE of the following:}\)

    • \(\text{The model predicts the boat has zero value after 5 years, which is}\)
      \(\text{unrealistic as most boats retain some value.}\)
    • \(\text{Beyond 5 years the model would predict a negative value, which is}\)
      \(\text{not possible.}\)
    • \(\text{The model assumes a constant rate of depreciation, but in reality}\)
      \(\text{a boat may depreciate more quickly in early years.}\)

Filed Under: Graphs of Practical Situations Tagged With: Band 3, Band 4, smc-6840-05-Linear Graphs, smc-6840-15-Strengths and Limitations

Algebra, STD1 EQ-Bank 11

A farmer in Western Australia observes that the rodent population on his property is doubling every two weeks.

A student claims that a linear model is NOT appropriate to predict the rodent population over time.

Is the student correct? Justify your answer.   (2 marks)

--- 5 WORK AREA LINES (style=lined) ---

Show Answers Only

\(\text{Yes, the student is correct.}\)

\(\text{Correct justification could include ONE of the following:}\)

    • \(\text{The rodent population is doubling every two weeks, which means it}\)
      \(\text{is increasing by a constant multiplier, not a constant amount — this}\)
      \(\text{is exponential growth, not linear.}\)
    • \(\text{A linear model increases by the same amount each time period, but}\)
      \(\text{the rodent population increases by a larger amount each fortnight as}\)
      \(\text{the population grows.}\)
    • \(\text{The graph of the rodent population over time would be an upsloping}\)
      \(\text{exponential curve, not a straight line.}\)
    • \(\text{A linear model would significantly underestimate the rodent population}\)
      \(\text{over time.}\)
Show Worked Solution

\(\text{Yes, the student is correct.}\)

\(\text{Correct justification could include ONE of the following:}\)

    • \(\text{The rodent population is doubling every two weeks, which means it}\)
      \(\text{is increasing by a constant multiplier, not a constant amount — this}\)
      \(\text{is exponential growth, not linear.}\)
    • \(\text{A linear model increases by the same amount each time period, but}\)
      \(\text{the rodent population increases by a larger amount each fortnight as}\)
      \(\text{the population grows.}\)
    • \(\text{The graph of the rodent population over time would be an upsloping}\)
      \(\text{exponential curve, not a straight line.}\)
    • \(\text{A linear model would significantly underestimate the rodent population}\)
      \(\text{over time.}\)

Filed Under: Graphs of Practical Situations Tagged With: Band 3, smc-6840-15-Strengths and Limitations

Algebra, STD1 EQ-Bank 15

A household's monthly water bill consists of a fixed service charge of $45 plus $3 per kilolitre of water used.

Let  \(C\) = monthly cost in dollars, and  \(k\) = water usage in kilolitres.

  1. Complete the table of values below that models the relationship between water usage and monthly cost.   (1 mark)
      
    \(\begin{array}{|c|c|c|c|c|c|c|} \hline \vphantom{\dfrac{1}{1}}\quad k \quad & \quad 0 \quad & \quad 10 \quad & \quad 20 \quad & \quad 30 \quad & \quad 40 \quad & \quad 50 \quad \\[6pt] \hline \vphantom{\dfrac{1}{1}}C &  & 75 & 105 &  & 165 & 195 \\[12pt] \hline \end{array}\)

    --- 0 WORK AREA LINES (style=lined) ---

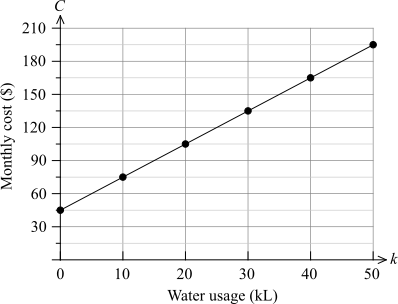
  2. Using the table of values from (a), neatly graph the monthly cost for water usage from 0 to 50 kL on the grid below.   (1 mark)

    --- 0 WORK AREA LINES (style=lined) ---


  3. Using your graph from (b), or otherwise, find the monthly cost when the household uses 35 kL of water.   (1 mark)

    --- 2 WORK AREA LINES (style=lined) ---

Show Answers Only

a.    \(\text{Table of values}\)

\begin{array}{|c|c|c|c|c|c|c|} \hline k & 0 & 10 & 20 & 30 & 40 & 50 \\ \hline C & \textbf{45} & 75 & 105 & \textbf{135} & 165 & 195 \\ \hline \end{array}

b.     

c.    \($120\)

Show Worked Solution

a.    \(\text{Table of values:}\)

\begin{array}{|c|c|c|c|c|c|c|} \hline k & 0 & 10 & 20 & 30 & 40 & 50 \\ \hline C & \textbf{45} & 75 & 105 & \textbf{135} & 165 & 195 \\ \hline \end{array}

 
b.  


c.    \(\text{From the graph, when } k=35,\ \ C=\$120\)

Filed Under: Graphs of Practical Situations Tagged With: Band 3, Band 4, smc-6840-05-Linear Graphs

Algebra, STD1 EQ-Bank 14

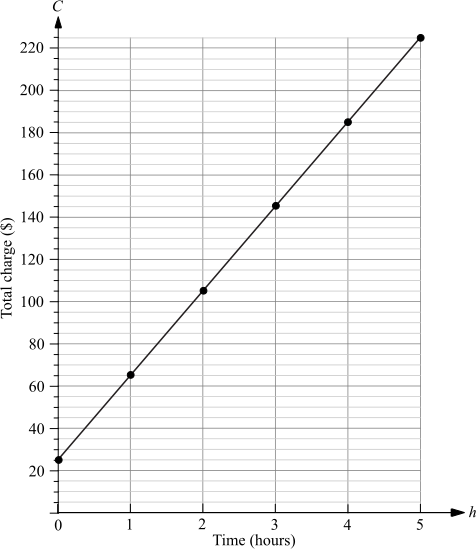
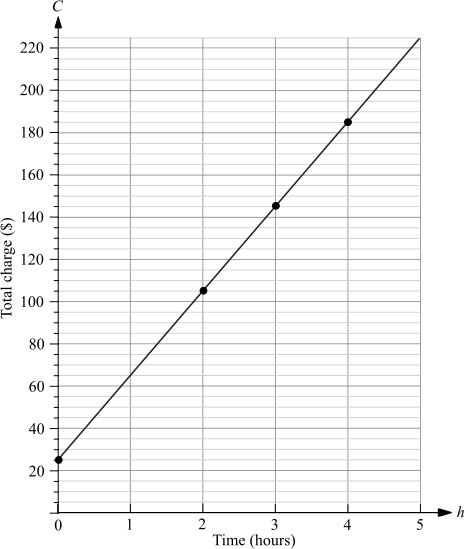
GreenCut Lawn Services charges a fixed call-out fee of $25 plus $40 per hour of work.

Let \(C\) = total charge in dollars, and  \(h\) = number of hours worked.

  1. Complete the table of values below that models the relationship between GreenCut's Lawn Services hours worked and total charge.   (1 mark)

    --- 0 WORK AREA LINES (style=lined) ---

    \begin{array}{|c|c|c|c|c|c|c|}
    \hline
    \quad \rule{0pt}{2.5ex}h\quad  \rule[-1ex]{0pt}{0pt}& \quad 0 \quad & \quad 1 \quad &\quad  2\quad  & \quad 3 \quad & \quad 4 \quad & \quad 5 \quad\\
    \hline
    \rule{0pt}{2.5ex}C & & 65 & 105 \rule[-1ex]{0pt}{0pt}& 145 & & 225 \\
    \hline
    \end{array}

  2. Using the table of values from (a), neatly graph the total charge for work completed from 0 to 5 hours on the grid below.   (1 mark)

    --- 0 WORK AREA LINES (style=lined) ---


  3. Using your graph from (b), or otherwise, find the total charge for 2.5 hours of work.   (1 mark)

    --- 2 WORK AREA LINES (style=lined) ---

  4. A customer has a budget of $160. Using your graph from (b), or otherwise, determine the maximum number of complete hours GreenCut can work within this budget.   (1 mark)

    --- 3 WORK AREA LINES (style=lined) ---

Show Answers Only

a.    \(\text{Table of values:}\)

\begin{array}{|c|c|c|c|c|c|c|}
\hline
\quad \rule{0pt}{2.5ex}h\quad  \rule[-1ex]{0pt}{0pt}& \quad 0 \quad & \quad 1 \quad &\quad  2\quad  & \quad 3 \quad & \quad 4 \quad & \quad 5 \quad\\
\hline
\rule{0pt}{2.5ex}C & \textbf{25}& 65 & 105 \rule[-1ex]{0pt}{0pt}& 145 &\textbf{185} & 225 \\
\hline
\end{array}

 
b.    


c.    \($125\)

d.    \(3\ \text{hours}\)

Show Worked Solution

a.    \(\text{Table of values:}\)

\begin{array}{|c|c|c|c|c|c|c|}
\hline
\quad \rule{0pt}{2.5ex}h\quad  \rule[-1ex]{0pt}{0pt}& \quad 0 \quad & \quad 1 \quad &\quad  2\quad  & \quad 3 \quad & \quad 4 \quad & \quad 5 \quad\\
\hline
\rule{0pt}{2.5ex}C & \textbf{25}& 65 & 105 \rule[-1ex]{0pt}{0pt}& 145 &\textbf{185} & 225 \\
\hline
\end{array}

 
b.  


c.    \(\text{From the graph, when }\ h=2.5, \ C=\$125\)
 

d.    \(\text{From the graph, \$160 lies between } h=3 \text{ and } h=4.\)

\(\therefore\ \text{Maximum complete hours} = 3\ \text{hours}\)

Filed Under: Graphs of Practical Situations Tagged With: Band 3, Band 4, smc-6840-05-Linear Graphs

Algebra, STD1 EQ-Bank 24

Zara is looking for a new mobile phone plan. She has found two plans that suit her needs and wants to work out which plan is cheaper depending on how many minutes she uses.

Plan \(\text{A}\):   $20 per month fixed charge plus $0.10 per minute

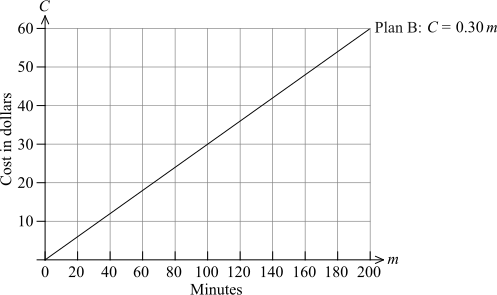
Plan \(\text{B}\):  $0.30 per minute, no fixed charge

Let  \(C\) = total monthly cost in dollars, and  \(m\) = number of minutes used.

  1. Plan \(\text{B}\) can be modelled by the equation  \(C=0.30m\).
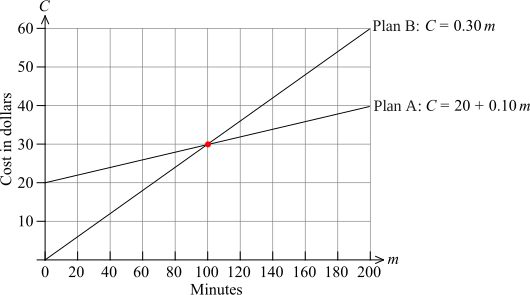
  2. Write an equation for the monthly cost of Plan \(\text{A}\).   (1 mark)

    --- 2 WORK AREA LINES (style=lined) ---

  3. The graph of Plan \(\text{B}\) is provided on the grid below. Use the equation from (a) to add the graph of Plan \(\text{A}\) to the grid.   (2 marks)

    --- 3 WORK AREA LINES (style=lined) ---

      
  4. For how many minutes per month do both plans cost the same amount?   (1 mark)

    --- 5 WORK AREA LINES (style=lined) ---

  5. Zara uses an average of 140 minutes per month.
  6. Which plan she should choose and how much does she save compared to the other plan.   (1 mark)

    --- 4 WORK AREA LINES (style=lined) ---
Show Answers Only

a.    \(\text{Plan A: }C=20+0.10m\)

b.    

c.    \(100\ \text{minutes}\)

d.    \(\text{Plan A, cheaper by } \$8\)

Show Worked Solution

a.    \(\text{Plan A: }\ C=20+0.10m\)
  

b.    \(\text{Table of values}\)

\(\begin{array}{|c|c|c|c|c|c|} \hline m & 0 & 50 & 100 & 150 & 200 \\ \hline \text{Plan A} & 20 & 25 & 30 & 35 & 40 \\ \hline \end{array}\)


c.    \(\text{From the graph, the lines intersect at }\ m=100.\)

\(\therefore\ \text{Both plans cost the same at } 100\ \text{minutes}\)
  

d.    \(\text{Plan A:   }\ C=20+0.10\times140=\$34\)

\(\text{Plan B:   }\ C=0.30\times140=\$42\)

\(\text{Difference} = 42-34=\$8\)

\(\therefore\ \text{Zara should choose Plan A, which is \$8 cheaper than Plan B.}\)

Filed Under: Simultaneous Linear Equations Tagged With: Band 3, Band 4, Band 5, smc-6839-20-Other SE Applications, smc-6839-30-Find Intersection

Algebra, STD1 EQ-Bank 15

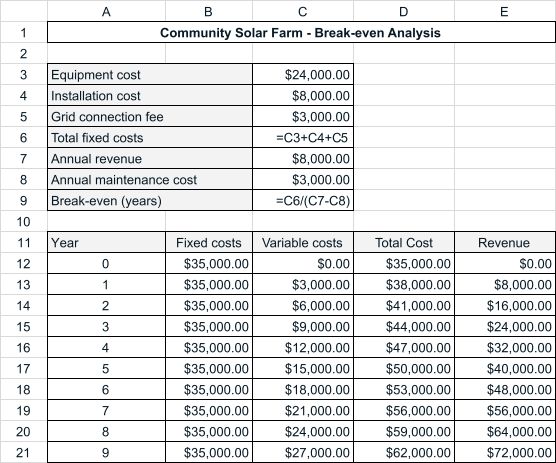
A local council invests in a community solar farm that sells electricity back to the grid.

The solar farm is expected to operate for 12 years. Each year the farm incurs a maintenance cost of $3000.

The council uses a spreadsheet to model the costs and revenue of the project.   

  1. What are the total fixed costs for the solar farm project?   (1 mark)

    --- 2 WORK AREA LINES (style=lined) ---

  2. After how many years does the solar farm break even?   (1 mark)

    --- 2 WORK AREA LINES (style=lined) ---

  3. Calculate the profit the council makes over the full 12-year lifespan of the solar farm.   (2 marks)

    --- 5 WORK AREA LINES (style=lined) ---

Show Answers Only

a.    \($35\,000\)

b.    \(7\ \text{years}\)

c.    \($25\,000\)

Show Worked Solution

a.    \(\text{Total fixed costs}=$24\,000+$8000+$3000=$35\,000\)
    

b.    \(\text{From the spreadsheet, at year}\ 7:\)

\(\text{Total cost}=$56\,000,\ \text{Revenue}=$56\,000\ \checkmark\)

\(\therefore\ \text{Break-even}=7\ \text{years}\)
    

c.    \(\text{Project lifespan}=12\ \text{years}\)

\(\text{Variable cost} =12\times \$3000= $36\,000\)

\(\text{Total costs} =$35\,000+$36\,000= \$71\,000\)

\(\text{Revenue} =12\times \$8000 = \$96\,000\)

\(\therefore\ \text{Profit} = \$96\,000-\$71\,000 = \$25\,000\)

Filed Under: Simultaneous Linear Equations Tagged With: Band 3, Band 4, smc-6839-10-Cost/Revenue, smc-6839-40-Spreadsheets

Algebra, STD1 EQ-Bank 23

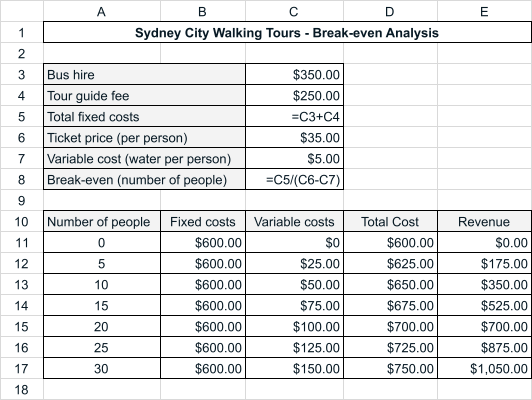
Maya operates Sydney City Walking Tours, a city walking tour business.

The bus she hires holds up to 40 people. Each person on the tour pays $35 and receives a complimentary bottle of water.

Maya uses a spreadsheet to model the costs and revenue for each tour. 
  

  1. What are the total fixed costs for each tour?   (1 mark)

    --- 2 WORK AREA LINES (style=lined) ---

  2. How many people need to attend the tour for Maya to break-even?   (1 mark)

    --- 2 WORK AREA LINES (style=lined) ---

  3. Calculate the profit Maya makes if the tour is fully booked.   (2 marks)

    --- 5 WORK AREA LINES (style=lined) ---

Show Answers Only

a.    \($600\)

b.    \(20\ \text{people}\)

c.    \($600\)

Show Worked Solution

a.    \(\text{Total fixed costs}=$350+$250=$600\)
    

b.    \(\text{From the spreadsheet, Maya’s break-even is when }\)

\(\text{Total cost}=\text{Revenue}=$700\)

\(\therefore\ \text{People to break-even} = 20\)
  

c.    \(\text{Fully booked}=40\ \text{people}\)

\(\text{Variable cost} =40\times \$5= \$200\)

\(\text{Total costs} =$600+$200= \$800\)

\(\text{Revenue} =40\times \$35 = \$1400\)

\(\therefore\ \text{Profit} = \$1400-\$800 = \$600\)

Filed Under: Simultaneous Linear Equations Tagged With: Band 3, Band 4, Band 5, smc-6839-10-Cost/Revenue, smc-6839-40-Spreadsheets

Algebra, STD1 EQ-Bank 16

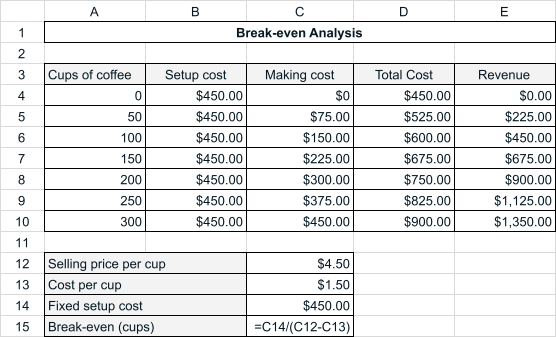
A cafe owner uses a spreadsheet to model the costs and revenue from selling cups of coffee.

The cafe has a fixed setup cost of $450 and a cost per cup 0f $1.50 to make each coffee. The owner sells each coffee for $4.50.

Part of the spreadsheet is shown.
  

  1. What does it mean for the cafe owner to break even?   (1 mark)

    --- 3 WORK AREA LINES (style=lined) ---

  2. Use the spreadsheet to identify the break-even point for the cafe owner.   (1 mark)

    --- 2 WORK AREA LINES (style=lined) ---

  3. If the cafe owner sells 250 cups of coffee, what profit is made?   (2 marks)

    --- 5 WORK AREA LINES (style=lined) ---

Show Answers Only

a.    \(\text{Break-even is when the total cost equals the revenue}\)

\(\text{i.e. the owner makes neither a profit nor a loss.}\)

b.    \(150\ \text{cups}\)

c.    \($300\)

Show Worked Solution

a.    \(\text{Break-even is when the total cost equals the revenue}\)

\(\text{i.e. the owner makes neither a profit nor a loss.}\)
  

b.    \(\text{From the spreadsheet, total cost equals revenue when }\)

\(\text{Cost}=\text{Revenue}=$675\)

\(\therefore\ \text{Cups sold to break-even} = 150\)

\(\text{Confirmed by cell C15:}\)

\(\text{Break-even (cups)}=\dfrac{450}{4.50-1.50}=\dfrac{450}{3}=150 \text{ cups}\)
  

c.    \(\text{At 250 cups (row 9): Revenue} = \$1125,\ \text{Total cost} = \$825\)

\(\therefore\ \text{Profit} = 1125-825 = \$300\)

Filed Under: Simultaneous Linear Equations Tagged With: Band 3, Band 4, smc-6839-10-Cost/Revenue, smc-6839-40-Spreadsheets

Algebra, STD1 EQ-Bank 22

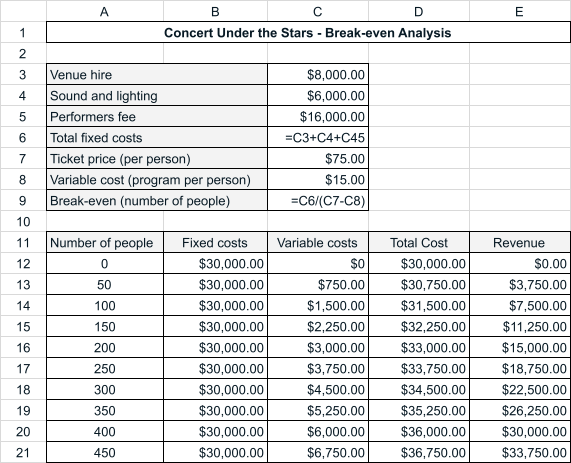
Gemstar Promotions is organising the annual Concert Under the Stars event to take place on the last weekend in January.

The outdoor venue holds up to 800 people. Each ticket holder receives a complimentary souvenir program valued at $15.

Garth from Gemstar Promotions uses a spreadsheet to model the costs and revenue for the concert. 
  

  1. What are the total fixed costs for the concert?   (1 mark)

    --- 2 WORK AREA LINES (style=lined) ---

  2. The promoter will only proceed with the concert if the loss is no more than $3000.   
  3. What is the minimum number of tickets that must be sold for the concert to go ahead?   (2 marks)

    --- 4 WORK AREA LINES (style=lined) ---
  4. Use the formula in cell C9 to calculate the number of tickets that must be sold for the promoter to break even?   (1 mark)

    --- 3 WORK AREA LINES (style=lined) ---

  5. Calculate the profit for Gemstar Promotions if the concert is fully booked.   (1 mark)

    --- 3 WORK AREA LINES (style=lined) ---

Show Answers Only

a.    \($30\,000\)

b.    \(450\ \text{people}\)

c.    \(500\ \text{people}\)

d.    \($18\,000\)

Show Worked Solution

a.    \(\text{Total fixed costs}=$8000+$6000+$16\,000=$30\,000\)
    

b.    \(\text{Maximum allowable loss}=$3000\)

\(\text{From the spreadsheet, at}\ 450\ \text{people}:\)

\(\text{Total cost}=$36\,750,\ \text{Revenue}=$33\,750\)

\(\text{Loss}=$36\,750-$33\,750=$3000\ \checkmark\)

\(\therefore\ \text{Minimum ticket sales}=450\)
  

c.    \(\text{Breakeven = C6/(C7-C8)}\)

\(\text{Breakeven}\ = \dfrac{30\,000}{75.00-15.00}=500\ \text{people}\)
  

d.    \(\text{Venue capacity}=800\ \text{people}\)

\(\text{Variable cost} =800\times \$15= $12\,000\)

\(\text{Total costs} =$30\,000+$12\,000= \$42\,000\)

\(\text{Revenue} =800\times \$75 = \$60\,000\)

\(\therefore\ \text{Profit} = \$60\,000-\$42\,000 = \$18\,000\)

Filed Under: Simultaneous Linear Equations Tagged With: Band 3, Band 4, Band 5, smc-6839-10-Cost/Revenue, smc-6839-40-Spreadsheets

Statistics, STD2 EQ-Bank 27

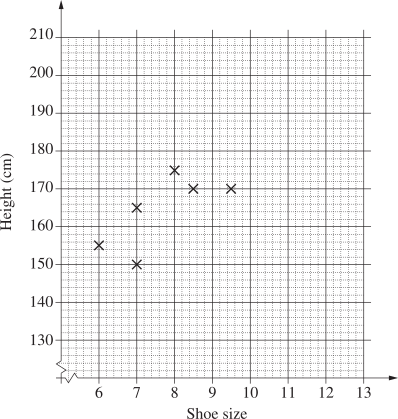
The shoe size and height of ten students were recorded.

\begin{array} {|l|c|c|}
\hline \rule{0pt}{2.5ex} \text{Shoe size} \rule[-1ex]{0pt}{0pt} & \text{6} & \text{7} & \text{7} & \text{8} & \text{8.5} & \text{9.5} & \text{10} & \text{11} & \text{12} & \text{12} \\
\hline \rule{0pt}{2.5ex} \text{Height} \rule[-1ex]{0pt}{0pt} & \text{155} & \text{150} & \text{165} & \text{175} & \text{170} & \text{170} & \text{190} & \text{185} & \text{200} & \text{195} \\
\hline
\end{array}

  1. Identify the dependent variable.   (1 mark)

    --- 1 WORK AREA LINES (style=lined) ---

  2. Complete the scatter plot AND draw a line of fit by eye.   (2 marks)

    --- 0 WORK AREA LINES (style=lined) ---


  3. Use the line of fit to estimate the height difference between a student who wears a size 7.5 shoe and one who wears a size 9 shoe.   (1 mark)

    --- 1 WORK AREA LINES (style=lined) ---

Show Answers Only

a.    `text{Height is the dependent variable (y-axis variable).}`

b.    `text(See Worked Solutions.)`

c.    `13\ text{cm  (or close given LOBF drawn)}`

Show Worked Solution

a.    `text{Height is the dependent variable (y-axis variable).}`

b.    
      2UG 2015 28e Answer

c.    `text{Shoe size 7½ gives a height estimate of 162 cm (see graph).}`

`text{Shoe size 9 gives a height estimate of 175 cm (see graph).}`

`text(Height difference)= 175-162= 13\ text{cm  (or close given LOBF)}`

Filed Under: Bivariate Data Analysis (Y12) Tagged With: Band 3, Band 4, smc-6884-20-Scatterplot from Table

Statistics, STD2 EQ-Bank 29

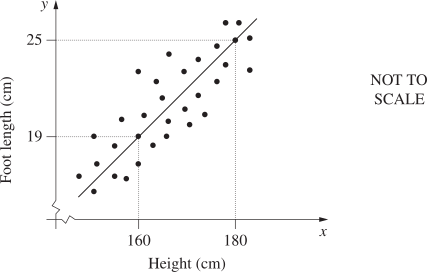
Each member of a group of males had his height and foot length measured and recorded. The results were graphed and a line of fit drawn.
 

  1. Identify the independent variable.   (1 mark)

    --- 1 WORK AREA LINES (style=lined) ---

  2. Why does the value of the `y`-intercept have no meaning in this situation?   (1 mark)

    --- 2 WORK AREA LINES (style=lined) ---

  3. George is 10 cm taller than his brother Harry. Use the line of fit to estimate the difference in their foot lengths.   (1 mark)

    --- 2 WORK AREA LINES (style=lined) ---

Show Answers Only

a.    `text{Height is the independent variable (x-axis variable).}`
 

b.    `text(The y-intercept occurs when)\ x = 0.\ text(It has no meaning to have)`

`text(a height of 0 cm.)`
  

c.    `text(A 20 cm height difference results in a foot length difference of 6 cm.)`

`text(A 10 cm height difference means George should have a 3 cm longer foot.)`

Show Worked Solution

a.    `text{Height is the independent variable (x-axis variable).}`
 

b.    `text(The y-intercept occurs when)\ x = 0.\ text(It has no meaning to have)`

`text(a height of 0 cm.)`
  

c.    `text(A 20 cm height difference results in a foot length difference of 6 cm.)`

`text(A 10 cm height difference means George should have a 3 cm longer foot.)`

Filed Under: Bivariate Data Analysis (Y12) Tagged With: Band 3, Band 4, Band 5, smc-6934-10-Line of Best Fit

ENGINEERING, TE 2025 HSC 27a

Security cameras are becoming more commonly used in society.

Describe the ethical concerns that should be considered when designing and developing telecommunications projects such as security cameras.   (3 marks)

--- 7 WORK AREA LINES (style=lined) ---

Show Answers Only
  • Security cameras raise privacy concerns, as constant surveillance may infringe on individuals’ rights to move and act without being monitored.
  • Data security is a concern, as recorded footage may be vulnerable to unauthorised access, misuse, or data breaches.
  • Facial recognition technology used in camera systems can introduce bias and discrimination, raising concerns about fairness and individual rights.
Show Worked Solution
  • Security cameras raise privacy concerns, as constant surveillance may infringe on individuals’ rights to move and act without being monitored.
  • Data security is a concern, as recorded footage may be vulnerable to unauthorised access, misuse, or data breaches.
  • Facial recognition technology used in camera systems can introduce bias and discrimination, raising concerns about fairness and individual rights.

Filed Under: Scope, Historical and Societal Influences Tagged With: Band 3, smc-3722-60-Ethics

ENGINEERING, CS 2025 HSC 26b

Explain how the introduction of steel beams in bridge construction has affected people's lives.   (3 marks)

--- 7 WORK AREA LINES (style=lined) ---

Show Answers Only
  • Steel beams have high tensile and compressive strength. This allows bridges to span greater distances and support heavier loads than traditional materials.
  • As a result, transport networks have expanded, enabling faster movement of people and goods across regions.
  • This has led to growth in trade and industry, lowering the cost of goods and improving economic opportunities for communities.
Show Worked Solution
  • Steel beams have high tensile and compressive strength. This allows bridges to span greater distances and support heavier loads than traditional materials.
  • As a result, transport networks have expanded, enabling faster movement of people and goods across regions.
  • This has led to growth in trade and industry, lowering the cost of goods and improving economic opportunities for communities.

Filed Under: Historical and Societal Influences Tagged With: Band 3, smc-3713-10-Structures over time, smc-3713-20-Innovation

ENGINEERING, CS 2025 HSC 22a

A building is being partially demolished and replaced. Part of the original structure will be retained.

Outline a method that could be used to recycle a material from the building.   (2 marks)

--- 3 WORK AREA LINES (style=lined) ---

Show Answers Only

Answers could include any ONE of the following:

  • Steel: Steel framing members, such as beams and columns, are salvaged during demolition and sent to a steel mill. They are reprocessed in an electric arc furnace and reformed into new steel products for future construction use.
  • Concrete: Waste concrete from demolished slabs and footings is broken down by mechanical crushing equipment into smaller aggregate pieces. This recycled aggregate is then incorporated into new concrete mixes or used as compacted fill beneath pavements.
  • Glass: Glazing panels removed during demolition are sorted and processed into fine particles known as cullet. This material is fed back into a glass furnace and reformed into new products, or blended into bituminous pavement materials.
Show Worked Solution

Answers could include any ONE of the following:

  • Steel: Steel framing members, such as beams and columns, are salvaged during demolition and sent to a steel mill. They are reprocessed in an electric arc furnace and reformed into new steel products for future construction use.
  • Concrete: Waste concrete from demolished slabs and footings is broken down by mechanical crushing equipment into smaller aggregate pieces. This recycled aggregate is then incorporated into new concrete mixes or used as compacted fill beneath pavements.
  • Glass: Glazing panels removed during demolition are sorted and processed into fine particles known as cullet. This material is fed back into a glass furnace and reformed into new products, or blended into bituminous pavement materials.

Filed Under: Engineering Materials Tagged With: Band 3, smc-3715-68-Other materials/composites

ENGINEERING, TE 2025 HSC 21d

Discuss the effect of ONE telecommunications engineering innovation on people's lives.   (4 marks)

--- 14 WORK AREA LINES (style=lined) ---

Show Answers Only

Innovation: Mobile phone technology

  • [P] Mobile phone technology has significantly transformed how people communicate and access information daily.
  • [E] Smartphones enable instant communication, remote working and access to banking, healthcare and education from anywhere.
  • [Ev] During the COVID-19 pandemic, mobile phones allowed millions to work and study from home, maintaining productivity.
  • [L] On one hand, mobile phones have improved quality of life by keeping people connected and informed at all times.
  • [P] However, mobile phone technology also presents significant challenges for individuals and society.
  • [E] Constant connectivity has contributed to rising rates of anxiety, sleep disruption and reduced face-to-face interaction.
  • [Ev] Studies show excessive screen time is linked to poorer mental health outcomes, particularly in young people.
  • [L] Despite the significant benefits, the negative impact on mental health and social connection must be carefully considered.
Show Worked Solution

Innovation: Mobile phone technology

  • [P] Mobile phone technology has significantly transformed how people communicate and access information daily.
  • [E] Smartphones enable instant communication, remote working and access to banking, healthcare and education from anywhere.
  • [Ev] During the COVID-19 pandemic, mobile phones allowed millions to work and study from home, maintaining productivity.
  • [L] On one hand, mobile phones have improved quality of life by keeping people connected and informed at all times.
  • [P] However, mobile phone technology also presents significant challenges for individuals and society.
  • [E] Constant connectivity has contributed to rising rates of anxiety, sleep disruption and reduced face-to-face interaction.
  • [Ev] Studies show excessive screen time is linked to poorer mental health outcomes, particularly in young people.
  • [L] Despite the significant benefits, the negative impact on mental health and social connection must be carefully considered.

Filed Under: Scope, Historical and Societal Influences Tagged With: Band 3, smc-3728-20-Innovation, smc-3728-30-Historical development

Statistics, MET2 2025 VCAA 3

The time taken for a driver to travel to work each day, in minutes, is modelled by a continuous random variable \(T\) with probability density function

\(f(t)=\left\{\begin{array}{cl}
\dfrac{1}{1\,215\,000}(t-29)(59-t)^3 & 29 \leq t \leq 59 \\
0 & \text {otherwise}
\end{array}\right.\)

    1. Find the mean time taken, in minutes, for the driver to travel to work each day.   (1 mark)

      --- 2 WORK AREA LINES (style=lined) ---

    2. Find the standard deviation of the time taken, in minutes, for the driver to travel to work each day.   (2 marks)

      --- 7 WORK AREA LINES (style=lined) ---

  1. The driver allows \(k\) minutes to travel to work each day. If the journey takes longer than \(k\) minutes, the driver will be late. Whether the driver is late on a particular day is independent of whether they are late on any other day.
    1. If \(k=47\), write a definite integral to show that the probability of the driver being late is 0.08704    (1 mark)

      --- 2 WORK AREA LINES (style=lined) ---

    2. If \(k=47\), find the probability that the driver will be late on at least one day in a five-day working week.
    3. Give your answer correct to four decimal places.   (2 marks)

      --- 3 WORK AREA LINES (style=lined) ---

    4. For \(k=47\), let \(\hat{P}\) be the proportion of days the driver is late in any five-day working week. Find \(\operatorname{Pr}(0.4 \leq \hat{P} \leq 0.6)\) correct to four decimal places.   (2 marks)

      --- 4 WORK AREA LINES (style=lined) ---
    5. Find the integer \(k\) such that the probability, correct to one decimal place, of the driver being late at least once in any five-day working week is 0.2    (2 marks)

      --- 8 WORK AREA LINES (style=lined) ---

  2. At a given traffic light, the wait time is modelled by a normal distribution with a mean of 2.5 minutes and a standard deviation of \(\sigma\) minutes.
    1. If \(\sigma=0.6\), find the probability that the wait time will be less than 3.5 minutes.
    2. Give your answer correct to two decimal places.   (1 mark)

      --- 2 WORK AREA LINES (style=lined) ---

    3. Find the value of \(\sigma\) such that there is a 2% chance of a wait time longer than 3.5 minutes.
    4. Give your answer correct to two decimal places.   (1 mark)

      --- 4 WORK AREA LINES (style=lined) ---
  3. The driver passes through three traffic lights \((A, B\) and \(C)\) on their journey to work. The probability of each traffic light being red is shown in the table below.
  4. \begin{array}{|l|c|c|c|}
    \hline \rule{0pt}{2.5ex}\text {Traffic light} \rule[-1ex]{0pt}{0pt}& \quad A \quad & \quad B \quad & \quad C  \quad\\
    \hline \rule{0pt}{2.5ex} \text {Probability that the traffic light is red} \quad  \rule[-1ex]{0pt}{0pt}& 0.2 & 0.3 & 0.1 \\
    \hline
    \end{array}
  5. Let \(Y\) be the random variable representing the number of traffic lights that are red on the driver's journey to work. Assume that each traffic light being red is independent of any other traffic light being red.
  6. Complete the following table for the probability distribution of \(Y\).    (2 marks)

    --- 0 WORK AREA LINES (style=lined) ---

  7. \begin{array}{|c|c|c|c|c|}
    \hline \rule{0pt}{2.5ex}y \rule[-1ex]{0pt}{0pt}& \ \ \quad 0 \ \ \quad & \ \ \quad 1 \ \ \quad & \ \ \quad 2 \ \ \quad & \ \ \quad 3 \ \ \quad \\
    \hline \rule{0pt}{2.5ex}\operatorname{Pr}(Y=y) \rule[-1ex]{0pt}{0pt}& & & & \\
    \hline
    \end{array}
Show Answers Only

a.i.   \(\displaystyle \int_{29}^{59}(t \times f(t)) d t=39\)
 

a.ii. \(\text{Strategy 1}\)

\(\text{sd}(T)=\sqrt{\displaystyle\int_{29}^{59} t^2 f(t) d t-39^2}=\dfrac{10 \sqrt{14}}{7}\)

\(\text{Strategy 2}\)

\(\text{sd}(T)=\sqrt{\displaystyle\int_{29}^{59}(t-39)^2 f(t)\, d t}=\dfrac{10 \sqrt{14}}{7}\)
 

b.i.  \(P\text{(driver being late)}=\displaystyle\int_{47}^{59} f(t)\, d t=0.08704\)
 

b.ii.  \(P(\text{(driver late at least 1 day in week)}=0.3658 \ \ \text{(4 d.p.)}\)
 

b.iii. \(0.0631 \ \text{(4 d.p.)}\)
 

b.iv. \(k=49\)
 

c.i.  \(P(W<3.5)=0.95\)
 

c.ii   \(\sigma=0.49\)
 

d.

\begin{array}{|c|c|c|c|c|}
\hline \rule{0pt}{2.5ex}y \rule[-1ex]{0pt}{0pt}& \quad 0 \quad & \quad 1 \quad& \quad 2 \quad & \quad 3 \quad \\
\hline \rule{0pt}{2.5ex}\operatorname{Pr}(Y=y) \rule[-1ex]{0pt}{0pt}& \frac{63}{125}=0.504& \frac{199}{500}=0.398 & \frac{23}{250}=0.092 & \frac{3}{500}=0.006 \\
\hline
\end{array}

Show Worked Solution

a.i.   \(\text{Calculate (by CAS):}\)

\(\displaystyle \int_{29}^{59}(t \times f(t)) d t=39\)
 

a.ii. \(\text{Strategy 1}\)

\(\text{sd}(T)=\sqrt{\displaystyle\int_{29}^{59} t^2 f(t) d t-39^2}=\dfrac{10 \sqrt{14}}{7}\)

\(\text{Strategy 2}\)

\(\text{sd}(T)=\sqrt{\displaystyle\int_{29}^{59}(t-39)^2 f(t)\, d t}=\dfrac{10 \sqrt{14}}{7}\)
 

b.i.  \(P\text{(driver being late)}\)

\(=\displaystyle\int_{47}^{59} f(t)\, d t=0.08704\)
 

b.ii.  \(P(\text{(driver late at least 1 day in week)}\)

\(=1-P(\text{never late in 5 days})\)

\(=1-(0.08704)^5\)

\(=0.3658 \ \ \text{(4 d.p.)}\)
 

b.iii. \(\text{Let} \ \ Y \sim \text{Bi}(5,0.08704)\)

\(\operatorname{Pr}(0.4 \leqslant \hat{P} \leqslant 0.6)=\operatorname{Pr}(2 \leqslant Y \leqslant 3)=0.0631 \ \text{(4 d.p.)}\)
 

b.iv. \(\text{Solve for} \ k:\)

\(1-\left(1-\displaystyle \int_k^{59} f(t) d t\right)^5=0.2\)

\(k=49\)
 

c.i.  \(W \sim N\left(\mu, \sigma^2\right) \sim\left(2.5,0.6^2\right)\)

\(\text{Solve (by CAS):}\)

\(P(W<3.5)=0.95\)
 

c.ii   \(\text{Find \(z\)-score when \(P(W>3.5)=0.02\)}\)

\(z \text {-score }=2.0537 \ldots\)

\(\text{Solve for} \ \sigma :\)

\(\dfrac{3.5-2.5}{\sigma}=2.0537 \ldots \ \Rightarrow \ \sigma=0.49\ \text{(2 d.p.)}\)
 

d.

\begin{array}{|c|c|c|c|c|}
\hline \rule{0pt}{2.5ex}y \rule[-1ex]{0pt}{0pt}& \quad 0 \quad & \quad 1 \quad& \quad 2 \quad & \quad 3 \quad \\
\hline \rule{0pt}{2.5ex}\operatorname{Pr}(Y=y) \rule[-1ex]{0pt}{0pt}& \frac{63}{125}=0.504& \frac{199}{500}=0.398 & \frac{23}{250}=0.092 & \frac{3}{500}=0.006 \\
\hline
\end{array}

Filed Under: Normal Distribution, Probability Density Functions Tagged With: Band 3, Band 4, Band 5, smc-637-10-E(X), smc-637-30-Var(X), smc-637-60-Polynomial PDF, smc-719-10-Single z-score

Functions, MET2 2025 VCAA 2

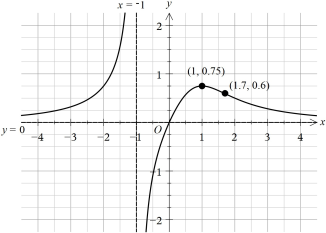
Let  \(f: R \rightarrow R, \ f(x)=\dfrac{x}{2}+7\)  and

\(g: R \rightarrow R, \ g(x)=A e^{k x}\)  where  \(A, k \in R\).

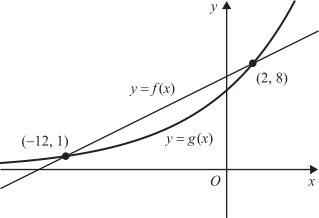
The graphs of  \(y=f(x)\)  and  \(y=g(x)\)  intersect at the points \((-12,1)\) and \((2,8)\), as shown below.


  1. Write down two simultaneous equations in terms of \(A\) and \(k\).
  2. Solve them, using algebra, to show that  \(A=2^{\tfrac{18}{7}}\)  and  \(k=\dfrac{3}{14} \log _e(2)\).   (3 marks)

    --- 12 WORK AREA LINES (style=lined) ---
  3. Find the value of \(b\), where  \(b \in R\), such that \(g(x)\) can be expressed in the form  \(g(x)=A \times 2^{b x}\).   (1 mark)

    --- 3 WORK AREA LINES (style=lined) ---
  4. Use a definite integral to evaluate the area bounded by the graphs of  \(y=f(x)\)  and  \(y=g(x)\), where  \(x \in[-12,2]\).
  5. Give the area correct to two decimal places.   (2 marks)

    --- 5 WORK AREA LINES (style=lined) ---
  6. Let  \(h(x)=f(x)-g(x)\).
    1. Write down an expression for the derivative of \(h(x)\).   (1 mark)

      --- 2 WORK AREA LINES (style=lined) ---
    2. Find the maximum value of \(h(x)\), where  \(x \in[-12,2]\).   (1 mark)
    3. Give your answer correct to two decimal places.

      --- 2 WORK AREA LINES (style=lined) ---
  7. Let \(g^{-1}\) be the inverse of \(g\).
  8. Find the points where the graph of  \(y=g^{-1}(x)\)  intersects with the graph of  \(y=2(x-7)\).   (2 marks)

    --- 5 WORK AREA LINES (style=lined) ---
  9. Let \(F\) be an anti-derivative of \(f\) that passes through \((0, c)\), where \(c \in R\).
    1. Show that it is not possible for the graph of  \(y=F(x)\)  to pass through both \((-12,1)\) and \((2,8)\).   (2 marks)

      --- 9 WORK AREA LINES (style=lined) ---
    2. The graph of  \(y=F(x)\) can be dilated by a factor of \(m\) from the \(x\)-axis such that its image passes through both \((-12,1)\) and \((2,8)\).
    3. Find the values of \(m\) and \(c\).   (2 marks)

      --- 6 WORK AREA LINES (style=lined) ---
Show Answers Only

a.    \(f(x)=\dfrac{x}{2}+7, \ g(x)=A e^{k x}\)

\(\text{Intersection occurs at }(-12,1) \text { and }(2,8):\)

\(A e^{-12 k}\) \(=1\ \ldots\ (1)\)
\(A e^{2 k}\) \(=18\ \ldots\ (2)\)

 
\(\text{Divide:}\ \ (2) ÷ (1)\)

\(e^{2 k-(-12 k)}\) \(=8\)
\(e^{14 k}\) \(=8\)
\(14 k\) \(=\log _e 8\)
\(14 k\) \(=3\log _e 2\)
\(14 k\) \(=\dfrac{3}{14} \log _e 2\)


\(\text{Substitute \(k\) into (1):}\)

\(A e^{-12\left(\tfrac{3}{14} \log _e 2\right)}\) \(=1\)
\(A e^{-\tfrac{18}{7} \log_e2}\) \(=1\)
\(A \times 2^{-\tfrac{18}{7}}\) \(=1\)
\(A\) \(=2^{\tfrac{18}{7}}\)


b.    \(g(x)=2^{\tfrac{18}{7}} \times 2^{\tfrac{3 x}{14}}\)
 

c.    \(\text{Area}=\displaystyle \int_{-12}^2 f(x)-g(x)=15.87 \ \text{u}^2\)
 

d.i.  \(h^{\prime}(x)=\dfrac{1}{2}-\dfrac{6 \log _e 2}{7} \times 2^{\tfrac{3 x}{14}+\tfrac{4}{7}}\)
 

d.ii. \(h(x)_{\text{max}}=1.72\)
 

e.   \(\text{Intersection at}\ (1,-12) \ \text{and} \ (8,2).\)
 

f.i.  \(f(x)=\dfrac{x}{2}+7\)

\(F(x)=\displaystyle \int f(x)\ d x=\dfrac{1}{4} x^2+7 x+c\)
 

\(\text{If} \ F(x) \ \text{passes through} \ (-12,1):\)

\(F(-12)=\dfrac{1}{4}(-12)^2+7(-12)+c=1 \ \ \Rightarrow\ \ c=49\)
 

\(\text{If \(F(x)\) passes through \((2,8)\):}\)

\(F(2)=\dfrac{1}{4}(2)^2+7(2)+c=8 \ \ \Rightarrow \ \ c=-7\)

\(\text{Since \(c\) cannot have 2 values, it cannot pass through both points.}\)
 

f.ii.  \(m=\dfrac{1}{9}, \ c=57\)

Show Worked Solution

a.    \(f(x)=\dfrac{x}{2}+7, \ g(x)=A e^{k x}\)

\(\text{Intersection occurs at }(-12,1) \text { and }(2,8):\)

\(A e^{-12 k}\) \(=1\ \ldots\ (1)\)
\(A e^{2 k}\) \(=18\ \ldots\ (2)\)
Mean mark (a) 51%.

\(\text{Divide:}\ \ (2) ÷ (1)\)

\(e^{2 k-(-12 k)}\) \(=8\)
\(e^{14 k}\) \(=8\)
\(14 k\) \(=\log _e 8\)
\(14 k\) \(=3\log _e 2\)
\(14 k\) \(=\dfrac{3}{14} \log _e 2\)


\(\text{Substitute \(k\) into (1):}\)

\(A e^{-12\left(\tfrac{3}{14} \log _e 2\right)}\) \(=1\)
\(A e^{-\tfrac{18}{7} \log_e2}\) \(=1\)
\(A \times 2^{-\tfrac{18}{7}}\) \(=1\)
\(A\) \(=2^{\tfrac{18}{7}}\)


b.    \(g(x)\) \(=2^{\tfrac{18}{7}} \times e^{\left(\tfrac{3}{14} \log _e 2\right) x}\)
    \(=2^{\tfrac{18}{7}} \times e^{\left(\tfrac{3 x}{14} \log _e 2\right)}\)
    \(=2^{\tfrac{18}{7}} \times e^{\left(\log _e 2^{\tfrac{3x}{14}}\right)}\)
    \(=2^{\tfrac{18}{7}} \times 2^{\tfrac{3 x}{14}}\)

Mean mark (b) 55%.
 

c.    \(\text{Area}=\displaystyle \int_{-12}^2 f(x)-g(x)=15.87 \ \text{u}^2\)
 

d.i.  \(h(x)=f(x)-g(x)\)

\(h(x)=\dfrac{x}{2}+7-2^{\tfrac{18}{7}} \times e^{k x}\)

\(h^{\prime}(x)=\dfrac{1}{2}-\dfrac{6 \log _e 2}{7} \times 2^{\tfrac{3 x}{14}+\tfrac{4}{7}}\)
 

d.ii. \(\text{Solve}\ \ h^{\prime}(x)=0\ \ \text{for}\ x\ \text{(by CAS):}\) 

\(x=-3.829\)

\(\text{Substitute into} \ \ h(x):\)

\(h(x)_{\text{max}}=1.72\)
 

e.   \(\text{Strategy 1}\)

\(\text{By CAS, find} \ \ g^{-1}(x):\)

\(g^{-1}(x)=\dfrac{2\left(7 \log _e x-7 \log _e 8+3 \log _e 2\right)}{3 \log _e 2}\)

\(\text{Solve} \ \ g^{-1}(x)=2(x-7) \ \ \text{for} \ x:\)

\(x=1,8\)

\(\text{Intersection at}\ (1,-12) \ \text{and} \ (8,2).\)
 

\(\text{Strategy 2}\)

\(y=2(x-7) \ \ \text{is the inverse of}\ \  y=\dfrac{x}{2}+7\ \ \text{(i.e.}\ f(x)).\)

\(\text{Two inverse functions will intersect at}\ (1,-12) \ \text{and} \ (8,2).\)
 

f.i.  \(f(x)=\dfrac{x}{2}+7\)

\(F(x)=\displaystyle \int f(x)\ d x=\dfrac{1}{4} x^2+7 x+c\)
 

\(\text{If} \ F(x) \ \text{passes through} \ (-12,1):\)

\(F(-12)=\dfrac{1}{4}(-12)^2+7(-12)+c=1 \ \ \Rightarrow\ \ c=49\)
 

\(\text{If \(F(x)\) passes through \((2,8)\):}\)

\(F(2)=\dfrac{1}{4}(2)^2+7(2)+c=8 \ \ \Rightarrow \ \ c=-7\)

\(\text{Since \(c\) cannot have 2 values, it cannot pass through both points.}\)

♦ Mean mark (f.i) 50%.

f.ii.  \(F(x)=\dfrac{1}{4} x^2+7 x+c\)

\(\text{Dilation of \(m\) from \(x\)-axis passes through \((-12,1)\) and \((2,8)\).}\)

\(\text{Solve simultaneously: }\)

\(m \times F(-12)=36 m-84 m+m c=1\ \ldots\ (1)\)

\(m \times F(2)=m+14 m+m c=8\ \ldots\ (2)\)

\(m=\dfrac{1}{9}, \ c=57\)

♦♦ Mean mark (f.ii) 34%.

Filed Under: Area Under Curves, Graphs and Applications, Log/Index Laws and Equations, Transformations Tagged With: Band 3, Band 4, Band 5, smc-723-50-Log/Exponential, smc-726-50-Exponential Equation, smc-753-20-Dilation (Only)

Calculus, MET2 2025 VCAA 1

Let  \(g: R \rightarrow R\)  be defined by  \(g(x)=4 x^3-3 x^4\).

  1. Find the coordinates of both stationary points of \(g\).   (2 marks)

    --- 3 WORK AREA LINES (style=lined) ---
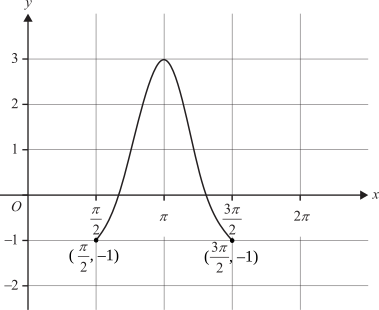
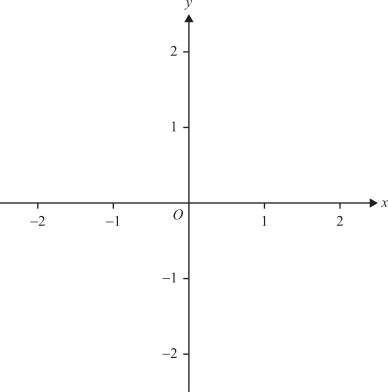
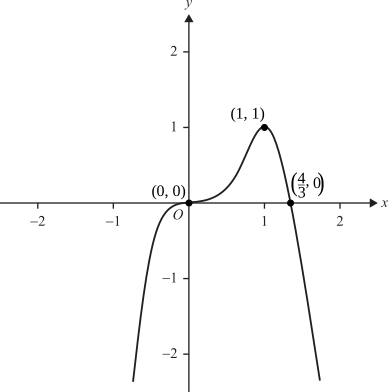
  2. Sketch the graph of \(y=g(x)\) on the axes below, labelling the stationary points and axial intercepts with their coordinates.   (2 marks)

    --- 0 WORK AREA LINES (style=lined) ---
   

  1. Complete the following gradient table with appropriate values of \(x\) and \(g^{\prime}(x)\) to show that \(g\) has a stationary point of inflection.   (2 marks)

    --- 0 WORK AREA LINES (style=lined) ---
\begin{array}{|c|c|c|c|}
\hline \rule{0pt}{2.5ex}x  \rule[-1ex]{0pt}{0pt}& \quad \quad \quad \quad& \quad \quad \quad \quad & \quad \quad \quad \quad\\
\hline\rule{0pt}{2.5ex} \quad g^{\prime}(x) \quad \rule[-1ex]{0pt}{0pt}& & & \\
\hline
\end{array}

  1. Find the average value of \(g\) between  \(x=0\)  and  \(x=2\).   (2 marks)

    --- 5 WORK AREA LINES (style=lined) ---
  2. Let \(h\) be the result after applying a sequence of transformations to \(g\), such that \(h\) has a stationary point of inflection at  \((1,0)\) and a local maximum at \((-1,1)\).
  3. Write down a possible sequence of three transformations to map from \(g\) to \(h\).   (3 marks)

    --- 4 WORK AREA LINES (style=lined) ---
  4. Let  \(X \sim \operatorname{Bi}(4, p)\) be a binomial random variable.
  5. Show that  \(\operatorname{Pr}(X \geq 3)=g(p)\) for all \(p \in[0,1]\).   (2 marks)

    --- 8 WORK AREA LINES (style=lined) ---

Show Answers Only

a.    \(\text{SP’s at} \ (0,0) \ \text{and}\ (1,1)\).
 

b.   

c.

\begin{array}{|c|c|c|c|}
\hline
\rule{0pt}{2.5ex}x \rule[-1ex]{0pt}{0pt}&  \quad -1 \quad & \quad \quad 0 \quad \quad & \quad \quad \frac{1}{2} \quad \quad\\
\hline
\rule{0pt}{2.5ex} \quad g^{\prime}(x) \quad \rule[-1ex]{0pt}{0pt}& 24 & 0 & \frac{3}{2} \\
\hline
\end{array}

 
d.
    \(I=-\dfrac{8}{5}\)
 

e.    \(\text{Possible sequences include:}\)

\begin{array}{|l|l|}
\hline
\rule{0pt}{2.5ex}\text{Sequence 1}\rule[-1ex]{0pt}{0pt}&\text{Sequence 2} \\
\hline
\rule{0pt}{2.5ex}\text {1. Reflect in the } y \text {-axis.}\rule[-1ex]{0pt}{0pt}&\text{1. Dilate by factor 2 from the \(y\)-axis.} \\
\hline
\rule{0pt}{2.5ex}\text{2. Dilate by factor 2 from the \(y\)-axis.} \quad \rule[-1ex]{0pt}{0pt}& \text{2. Translate 1 unit left.} \\
\hline
\rule{0pt}{2.5ex}\text {3. Translate 1 unit right.}\quad \rule[-1ex]{0pt}{0pt}&\text{3. Reflect in the \(y\)-axis.}  \\
\hline
\end{array}

\begin{array}{|l|l|}
\hline
\rule{0pt}{2.5ex}\text{Sequence 3}\rule[-1ex]{0pt}{0pt}&\text{Sequence 4} \\
\hline
\rule{0pt}{2.5ex}\text{1. Reflect in the \(y\)-axis.} \rule[-1ex]{0pt}{0pt}&\text{1. Translate 0.5 units left.} \\
\hline
\rule{0pt}{2.5ex}\text{2. Translate 0.5 units right.}\rule[-1ex]{0pt}{0pt}&\text{2. Dilate by factor 2 from the \(y\)-axis.} \\
\hline
\rule{0pt}{2.5ex}\text{3. Dilate by factor 2 from the \(y\)-axis.} \quad \rule[-1ex]{0pt}{0pt}&\text{3. Reflect in the \(y\)-axis.} \\
\hline
\end{array}

 
f. 
  \(X \sim \operatorname{Bi}(4, p)\)

\(\operatorname{Pr}(X \geqslant 3)\) \(=\operatorname{Pr}(X=3)+\operatorname{Pr}(X=4)\)
  \(=4 p^3(1-p)+p^4\)
  \(=4 p^3-4 p^4+p^4\)
  \(=4 p^3-3 p^4\)
  \(=g(p)\)
Show Worked Solution

a.    \(g(x)=4 x^3-3 x^4\)

\(g^{\prime}(x)=12 x^2-12 x^3=12 x^2(1-x)\)

\(\text{Solve} \ \ g^{\prime}(x)=0:\)

\(x=0,1\)

\(\text{SP’s at} \ (0,0) \ \text{and}\ (1,1)\).
 

b.    \(\text{Find} \ x \text {-intercepts:}\)

\(\text{Solve} \ \ g(x)=0 \ \ \Rightarrow\ \ x=0, \dfrac{4}{3}\)
 

c.

\begin{array}{|c|c|c|c|}
\hline
\rule{0pt}{2.5ex}x \rule[-1ex]{0pt}{0pt}&  \quad -1 \quad & \quad \quad 0 \quad \quad & \quad \quad \frac{1}{2} \quad \quad\\
\hline
\rule{0pt}{2.5ex} \quad g^{\prime}(x) \quad \rule[-1ex]{0pt}{0pt}& 24 & 0 & \frac{3}{2} \\
\hline
\end{array}

 
d.
    \(\text{Solve integral (by CAS):}\)

\(I=\dfrac{1}{2-0} \displaystyle \int_0^2 g(x)\ d x=-\dfrac{8}{5}\)
 

e.    \(\text{Possible sequences include:}\)

\begin{array}{|l|l|}
\hline
\rule{0pt}{2.5ex}\text{Sequence 1}\rule[-1ex]{0pt}{0pt}&\text{Sequence 2} \\
\hline
\rule{0pt}{2.5ex}\text {1. Reflect in the } y \text {-axis.}\rule[-1ex]{0pt}{0pt}&\text{1. Dilate by factor 2 from the \(y\)-axis.} \\
\hline
\rule{0pt}{2.5ex}\text{2. Dilate by factor 2 from the \(y\)-axis.} \quad \rule[-1ex]{0pt}{0pt}& \text{2. Translate 1 unit left.} \\
\hline
\rule{0pt}{2.5ex}\text {3. Translate 1 unit right.}\quad \rule[-1ex]{0pt}{0pt}&\text{3. Reflect in the \(y\)-axis.}  \\
\hline
\end{array}

\begin{array}{|l|l|}
\hline
\rule{0pt}{2.5ex}\text{Sequence 3}\rule[-1ex]{0pt}{0pt}&\text{Sequence 4} \\
\hline
\rule{0pt}{2.5ex}\text{1. Reflect in the \(y\)-axis.} \rule[-1ex]{0pt}{0pt}&\text{1. Translate 0.5 units left.} \\
\hline
\rule{0pt}{2.5ex}\text{2. Translate 0.5 units right.}\rule[-1ex]{0pt}{0pt}&\text{2. Dilate by factor 2 from the \(y\)-axis.} \\
\hline
\rule{0pt}{2.5ex}\text{3. Dilate by factor 2 from the \(y\)-axis.} \quad \rule[-1ex]{0pt}{0pt}&\text{3. Reflect in the \(y\)-axis.} \\
\hline
\end{array}

 
f. 
  \(X \sim \operatorname{Bi}(4, p)\)

\(\operatorname{Pr}(X \geqslant 3)\) \(=\operatorname{Pr}(X=3)+\operatorname{Pr}(X=4)\)
  \(=4 p^3(1-p)+p^4\)
  \(=4 p^3-4 p^4+p^4\)
  \(=4 p^3-3 p^4\)
  \(=g(p)\)
♦ Mean mark (e) 40%.
Mean mark (f) 51%

Filed Under: Average Value and Other, Binomial, Curve Sketching, Transformations Tagged With: Band 3, Band 4, Band 5, smc-638-10-binomial expansion (non-calc), smc-724-20-Degree 4, smc-753-40-Combinations, smc-756-30-Polynomial

ENGINEERING, TE 2025 HSC 7 MC

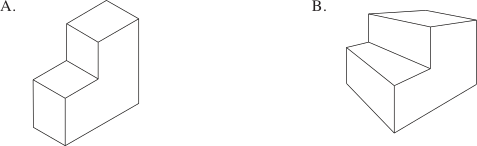
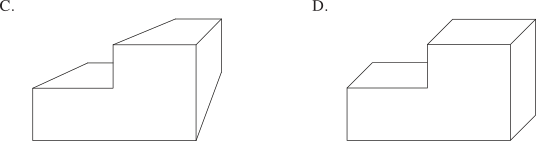
Which of the pictorial drawings is an example of isometric drawing?


Show Answers Only

\(A\)

Show Worked Solution
  • In an isometric drawing, all three axes are drawn at 120° to each other, with vertical lines remaining vertical.
  • Drawing A shows all receding axes at 30° to the horizontal — the defining feature of isometric projection.
  • Drawings B and C show one face drawn true shape with receding lines at an oblique angle — characteristic of oblique projection.
  • Drawing D shows receding lines at an angle inconsistent with isometric construction.

\(\Rightarrow A\)

Filed Under: Communication Tagged With: Band 3, smc-3731-10-Pictorial sketch

Functions, EXT1 F1 2025 MET2 5 MC

Which of the following sets represents a function that has an inverse function?

  1. \(\{(1,3),(2,0),(2,1)\}\)
  2. \(\{(-1,3),(2,2),(3,1)\}\)
  3. \(\{(-1,3),(0,1),(1,3)\}\)
  4. \(\{(1,0),(2,3),(1,3)\}\)
Show Answers Only

\(B\)

Show Worked Solution

\(\text{Option A and D are not functions (one x-value has two y-values).}\)

\(\text{Consider option B:}\)

\(\{(-1,3),(2,2),(3,1)\} \ \ \text{is a} \  1:1 \ \text {function.}\)

\(\therefore \ \text {Inverse exists}\)

\(\text{Note that option C is not one-to-one because two different inputs (-1 and 1) map to}\)

\(\text{the same output (3), so its inverse would not be a function.}\)

\(\Rightarrow B\)

Filed Under: Inverse Functions Tagged With: Band 3, smc-6641-20-Other Functions

Trigonometry, 2ADV T3 2025 MET2 1 MC

A function that has a range of \([6,12]\) is

  1. \(f(x)=6+3 \cos (9 x)\)
  2. \(f(x)=6+6 \cos (3 x)\)
  3. \(f(x)=9-3 \cos (6 x)\)
  4. \(f(x)=9-6 \cos (3 x)\)
Show Answers Only

\(C\)

Show Worked Solution

\(\text{By trial and error,}\)

\(\text{Consider option C:}\ \  f(x)=9-3 \cos (6 x)\)

\(\text{Since}\ \ -1 \leqslant \cos (6 x) \leqslant 1\)

\(\text{Range is} \ \ [-3+9,3+9]=[6,12]\)

\(\Rightarrow C\)

Filed Under: Trig Graphs, Trigonometric Functions Tagged With: Band 3, smc-7124-20-cos, smc-977-20-cos

Statistics, SPEC2 2025 VCAA 6

The volume of water, \(V\) mL, consumed by a student during a school day may be assumed to be normally distributed with a mean of 1000 mL and a standard deviation of 80 mL .

    1. Write down the mean and standard deviation of the sampling distribution for the average volume of water consumed by randomly selected samples of 25 students.
    2. Give your answers in millilitres.   (1 mark)

      --- 2 WORK AREA LINES (style=lined) ---
    3. What is the probability, correct to four decimal places, that the average volume of water consumed by a random sample of 25 students on a particular school day is more than 970 mL?   (1 mark)

      --- 2 WORK AREA LINES (style=lined) ---
The canteen at a particular school stocks two brands of water in bottles, Wasser and Apa.

The manufacturer of Wasser bottled water knows that the volume of water dispensed into bottles may be assumed to be normally distributed with a standard deviation of 5 mL. Engineers at the company take a random sample of 30 bottles and measure the volume of water in each bottle. The sample mean is found to be 750 mL.

  1. Find a 95% confidence interval for the mean volume of water dispensed into each Wasser bottle.
  2. Give your values in millilitres, correct to one decimal place.   (1 mark)

    --- 1 WORK AREA LINES (style=lined) ---
  3. The engineers decide to take 300 random samples, each containing 30 bottles, and calculate the respective 95% confidence intervals. All samples are independent.
  4. In how many of these confidence intervals would the engineers expect the value of the true mean volume dispensed to be included?   (1 mark)

    --- 1 WORK AREA LINES (style=lined) ---
  5. What is the minimum size of the sample required to ensure that the difference between the sample mean and the mean volume dispensed is no more than 1 mL at the 95% confidence level?   (1 mark)

    --- 2 WORK AREA LINES (style=lined) ---
The volume of water dispensed into Apa water bottles may be assumed to be normally distributed with a mean of 750 mL and a standard deviation of 5 mL. After a service, a random sample of 50 bottles gave a sample mean of 748 mL. The company now claims that the mean volume of water dispensed is less than the stated mean of 750 mL.

A one-tailed statistical test at the 1% level of significance is proposed.

  1. Write down the null and alternative hypotheses that will be used in testing the company's claim.   (1 mark)

    --- 2 WORK AREA LINES (style=lined) ---
    1. Determine the \(p\) value for this test.
    2. Give your answer correct to four decimal places.   (1 mark)

      --- 2 WORK AREA LINES (style=lined) ---
    3. Is the company's claim correct?
    4. Explain your conclusion in terms of the \(p\) value.   (1 mark)

      --- 2 WORK AREA LINES (style=lined) ---
  2. At the 1% level of significance for a sample size of 50 bottles, find the critical value of the sample mean, below which a sample mean value would support the conclusion that the mean volume of water dispensed is now less than 750 mL.
  3. Give your answer correct to three decimal places.   (1 mark)

    --- 2 WORK AREA LINES (style=lined) ---
  4. Assume that, after the service, the true mean volume of water in the Apa bottles was found to be 747.5 mL and that the population standard deviation, \(\sigma\), is 5 mL.
  5. At the 1% level of significance, for a sample size of 50 , find the probability that the company will conclude that the service has not reduced the mean volume of water in an Apa bottle.
  6. Give your answer correct to three decimal places.   (1 mark)

    --- 2 WORK AREA LINES (style=lined) ---
Show Answers Only

a.i.  \(\mu=1000,\ \ \sigma=16\)

a.ii.  \(P(V>970)=0.9696\)

b.    \(\text{95% CI}=(748.2,751.8)\) 

c.    \(95 \% \times 300=285\)

d.    \(n=97\) 

e.    \(H_0: \ \mu=750, \ H_1: \ \mu<750\)

f.i.  \(p=0.0023\) 

f.ii.   \(\text{Since \(0.0023<0.01\) (significance level), claim is correct.}\)

g.    \(\overline{X}=748.355 \ \text{mL}\)

h.    \(p=0.113\)

Show Worked Solution
a.i.   \(\mu\) \(=1000\)
  \(\sigma\) \(=\dfrac{80}{\sqrt{16}}=16\)


a.ii.  \(P(V>970)=0.9696\)
 

b.    \(\overline{X} \sim N\left(750, \dfrac{5}{\sqrt{30}}\right)\)

\(\text{95% CI}\) \(=\left(750-1.96 \times \dfrac{5}{\sqrt{30}}, 750+1.96\times\dfrac{5}{\sqrt{30}}\right)\)
  \(=(748.2,751.8)\)


c.    \(95 \% \times 300=285\)
 

d.    \(\text {Solve for} \ n:\)

\(1\) \(\geqslant 1.96 \times \dfrac{5}{\sqrt{n}}\)
\(n\) \(\geqslant 96.04\)
\(n\) \(=97\)


e.    \(H_0: \ \mu=750\)

\(H_1: \ \mu<750\)
 

f.i.    \(p\) \(=\operatorname{Pr}\left(z<\dfrac{748-750}{\frac{5}{\sqrt{50}}}\right)\)
    \(=\operatorname{Pr}\left(z<-\dfrac{2 \sqrt{50}}{5}\right)\)
    \(=0.0023\)


f.ii.   \(\text{Since \(0.0023<0.01\) (significance level), claim is correct.}\)
 

g.    \(\text{Solve for} \ c:\ \ \operatorname{Pr}(\overline{X}<c)=0.01\)

\(c=748.355 \ \text{mL}\)
 

h.    \(p=0.113\)

Filed Under: Confidence Intervals and Hypothesis Testing, Linear Combinations and Sample Means Tagged With: Band 3, Band 4, smc-1162-10-95% CI (sample), smc-1162-20-Other CI (sample), smc-1162-50-Null/Alternative hypothesis

Vectors, SPEC2 2025 VCAA 5

Consider three planes defined by the equations  \(\Pi_1: \ 2 x+9 z=8, \Pi_2: \ 3 x+6 y+5 z=7\)  and  \(\Pi_3: \ x+9 y-3 z=7\).

  1. Find the point of intersection of the three planes.   (1 mark)

    --- 2 WORK AREA LINES (style=lined) ---
    1. Find a vector that gives the direction of the line of intersection of the planes \(\Pi_2\) and \(\Pi_3\).   (2 marks)

      --- 4 WORK AREA LINES (style=lined) ---
    2. Find a set of parametric equations that give the coordinates of the points that lie on this line of intersection.   (1 mark)

      --- 4 WORK AREA LINES (style=lined) ---
  2. Find the shortest distance from the point \((1,1,2)\) to the plane \(\Pi_3\).   (2 marks)

    --- 6 WORK AREA LINES (style=lined) ---
  3. Consider a family of planes, \(\Psi\), with equation  \(6 x+27 z=m\), where \(m \in N\).
    1. Show that the plane \(\Pi_1\) is parallel to each member of \(\Psi\).   (1 mark)

      --- 2 WORK AREA LINES (style=lined) ---
    2. Find all values of \(m\) for which the shortest distance between plane \(\Pi_1\) and the plane of the form  \(6 x+27 z=m\)  is  \(\dfrac{23}{3 \sqrt{85}}\).   (3 marks)

      --- 6 WORK AREA LINES (style=lined) ---
Show Answers Only

a.    \(\text{Intersection at}\ (-5,2,2)\)
 

b.i.  \(\underset{\sim}{d}=\left(\begin{array}{c}-63 \\ 14 \\ 21\end{array}\right)\)
 

b.ii. \(x=-5-63 \lambda\)

\(y=2 + 14 \lambda\)

\(z=2+21 \lambda\)
 

c.    \(\dfrac{3}{\sqrt{91}}\)
 

d.i.  \(\Psi: \ 6 x+27 z=m\)

\(\text{Normal to} \ \Psi: \ 6 \underset{\sim}{i}+27 \underset{\sim}{k}\)

\(\text{Normal to} \ \Pi_2: \ 2 \underset{\sim}{i}+9 \underset{\sim}{k}\)

\(\displaystyle \binom{6}{27}=3\binom{2}{9} \ \Rightarrow \ \text{Planes are parallel}\)

d.ii.  \(m=1,47\)

Show Worked Solution

a.    \(\Pi_1: \ 2 x+9 z=8\)

\(\Pi_2: \ 3 x+6 y+5 z=7\)

\(\Pi_3: \ x+9 y-3 z=7\)

\(\text {Solve simultaneously (by CAS):}\)

\(\text{Intersection at}\ (-5,2,2)\)
 

b.i.  \(\underset{\sim}{d} \ \text{is} \perp \text{to normals of} \ \Pi_2 \ \text{and}\  \Pi_3.\)

\(\underset{\sim}{d}=n_2 \times n_3=\left|\begin{array}{ccc}i & j & k \\ 3 & 6 & 5 \\ 1 & 9 & -3\end{array}\right|=\left(\begin{array}{c}-63 \\ 14 \\ 21\end{array}\right)\)
 

b.ii. \((-5,2,2)\ \text{lies on both planes (from part a.)}\)

\(x=-5-63 \lambda\)

\(y=2 + 14 \lambda\)

\(z=2+21 \lambda\)

♦ Mean mark (b.ii) 51%.

c.    \(\text{Find shortest distance from (1, 1, 2) to \(\Pi_3\).}\)

\(\Pi_3: \ x+9 y-3 z=7 \ \ \Rightarrow \ \ (7,0,0)\ \text{lies on plane.}\)

\(\text {Spanning vector to} \ (1,1,2) \ \text{is} \ (-6 \underset{\sim}{i}+\underset{\sim}{j}+2 \underset{\sim}{k})\)

\(\text{Distance}=\dfrac{1}{\sqrt{91}} \times \abs{\left(\begin{array}{c}-6 \\ 1 \\ 2\end{array}\right)\left(\begin{array}{c}1 \\ 9 \\ -3\end{array}\right)}=\dfrac{3}{\sqrt{91}}\)
 

d.i.  \(\Psi: \ 6 x+27 z=m\)

\(\text{Normal to} \ \Psi: \ 6 \underset{\sim}{i}+27 \underset{\sim}{k}\)

\(\text{Normal to} \ \Pi_2: \ 2 \underset{\sim}{i}+9 \underset{\sim}{k}\)

\(\displaystyle \binom{6}{27}=3\binom{2}{9} \ \Rightarrow \ \text{Planes are parallel}\)
  

d.ii. \(\text{Point on}\ \Pi_1: (4,0,0)\)

\(\text{Point on} \ \Psi:\left(\dfrac{m}{6}, 0,0\right)\)

\(\text{Spanning vector}=\left(4-\dfrac{m}{6}\right) \underset{\sim}{i}\)

\(\text{Distance}=\abs{\left(4-\dfrac{m}{6}\right) \underset{\sim}{i} \cdot \dfrac{(2 \underset{\sim}{i}+9\underset{\sim}{k})}{\sqrt{85}}}=\dfrac{23}{3 \sqrt{85}}\)

\(\text{Solve}\ \ \abs{8-\dfrac{m}{3}}=\dfrac{23}{3} \ \ \text{for} \ m:\)

\(m=1,47\)

♦ Mean mark (d.ii) 45%.

Filed Under: Vector Lines, Planes and Geometry Tagged With: Band 3, Band 4, Band 5, smc-1177-80-Planes

Vectors, SPEC2 2025 VCAA 4

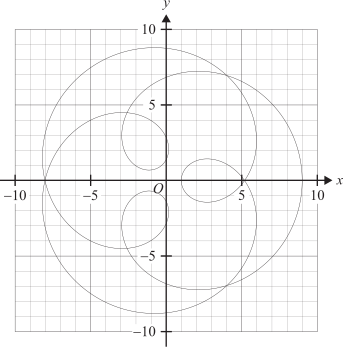
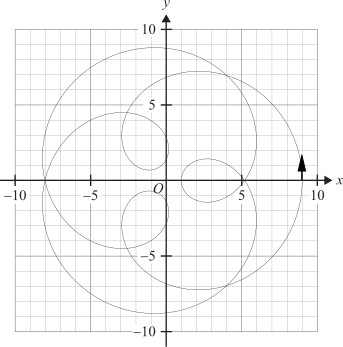
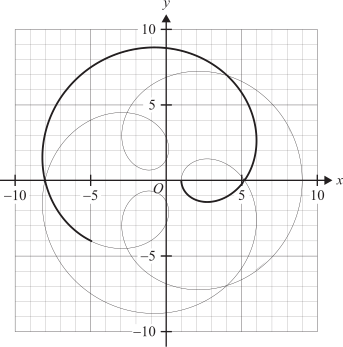
The path of a moving particle with position vector

\(\underset{\sim}{r}(t)=\left(5 \cos (t)-4 \cos \left(\dfrac{5 t}{2}\right)\right) \underset{\sim}{i}+\left(5 \sin (t)-4 \sin \left(\dfrac{5 t}{2}\right)\right) \underset{\sim}{j}\)

is shown below for time \(t \geq 0\).

All lengths are in metres and time is measured in seconds.
 

  1. Write down the coordinates of the particle's starting point.   (1 mark)

    --- 2 WORK AREA LINES (style=lined) ---
  2. On the graph above, draw an arrow from the point \((9,0)\) to indicate the direction of motion of the particle.   (1 mark)

    --- 0 WORK AREA LINES (style=lined) ---

  3. Find the value of \(t\) for which the particle will first return to its starting point.   (1 mark)

    --- 2 WORK AREA LINES (style=lined) ---

  4. Show that the speed of the particle, in m s\(^{-1}\), at time \(t\) can be expressed as  \(\sqrt{125-100 \cos \left(\dfrac{3 t}{2}\right)}\).   (3 marks)

    --- 9 WORK AREA LINES (style=lined) ---

  5. What is the maximum speed of the particle in m s\(^{-1}\)?   (1 mark)

    --- 2 WORK AREA LINES (style=lined) ---

  6. On the graph above, trace the path of the particle for  \(t \in[0, \pi]\).   (1 mark)

    --- 0 WORK AREA LINES (style=lined) ---

  7. Find the length of the path traced in part f, giving your answer in metres, correct to one decimal place.   (2 marks)

    --- 5 WORK AREA LINES (style=lined) ---

Show Answers Only

a.    \(\text{Initial coordinates:}\ (1,0)\)
 

b.    
     

c.   \(t=4 \pi \ \text{seconds}\)

d.    \(r(t)=\left(5 \cos (t)-4 \cos \left(\dfrac{5 t}{2}\right)\right)\underset{\sim}{i}+\left(5 \sin (t)-4 \sin \left(\dfrac{5 t}{2}\right)\right)\underset{\sim}{j}\)

\(\dot{r}(t)=\left(-5 \sin (t)+10 \sin \left(\dfrac{5 t}{2}\right)\right) \underset{\sim}{i}+\left(5 \cos (t)-10 \cos \left(\dfrac{5 t}{2}\right)\right) \underset{\sim}{j}\)

\(\text {Speed}=\abs{\dot{r}(t)}:\)

\(\text{Speed}^2\) \(=\left(-5 \sin (t)+10 \sin \left(\dfrac{5 t}{2}\right)\right)^2+\left(5 \cos (t)-10 \cos \left(\dfrac{5 t}{2}\right)\right)^2\)
  \(=25 \sin ^2(t)-100 \sin (t) \sin \left(\dfrac{5 t}{2}\right)+100 \sin ^2\left(\dfrac{5 t}{2}\right)\)
       \(\quad +25 \cos ^2(t)-100 \cos (t) \cos \left(\dfrac{5 t}{2}\right)+100 \cos ^2\left(\dfrac{5 t}{2}\right)\)
  \(=125-100\left(\sin (t) \sin \left(\dfrac{5 t}{2}\right)-\cos (t) \cos \left(\dfrac{5 t}{2}\right)\right)\)
  \(=125-100 \cos \left(\dfrac{5 t}{2}-t\right)\)
\(\text{speed}\) \(=\sqrt{125-100 \cos \left(\dfrac{3t}{2}\right)}\)


e.    \(\text{Speed}_{\text {max}}=15 \ \text{ms}^{-1}\)
 

f.    \(\text{Path traces curve from}\ (1,0)\ \text{to}\ (-5,-4).\)


g.    \(\displaystyle \int_0^\pi \sqrt{125-100 \cos \left(\frac{3 t}{2}\right)} d t=36.6\ \text{(1 d.p.)}\)

Show Worked Solution

a.    \(\text{At} \ \ t=0:\)

\(r(t)=(5 \cos 0-4 \cos 0)\underset{\sim}{i} + (5 \sin 0-4 \sin 0) {\underset{\sim}{j}}=\underset{\sim}{i}\)

\(\text{Initial coordinates:}\ (1,0)\)
 

b.    
     

c.   \(\text{Solve for}\ t \ \text{(by CAS):}\)

\(5 \cos (t)-4 \cos \left(\dfrac{5t}{2}\right)=1\)

\(5 \sin (t)-4 \sin \left(\dfrac{5 t}{2}\right)=0\)

\(t=4 \pi \ \text{seconds}\)

Mean mark (c) 53%.
 

d.    \(r(t)=\left(5 \cos (t)-4 \cos \left(\dfrac{5 t}{2}\right)\right)\underset{\sim}{i}+\left(5 \sin (t)-4 \sin \left(\dfrac{5 t}{2}\right)\right)\underset{\sim}{j}\)

\(\dot{r}(t)=\left(-5 \sin (t)+10 \sin \left(\dfrac{5 t}{2}\right)\right) \underset{\sim}{i}+\left(5 \cos (t)-10 \cos \left(\dfrac{5 t}{2}\right)\right) \underset{\sim}{j}\)

\(\text {Speed}=\abs{\dot{r}(t)}:\)

\(\text{Speed}^2\) \(=\left(-5 \sin (t)+10 \sin \left(\dfrac{5 t}{2}\right)\right)^2+\left(5 \cos (t)-10 \cos \left(\dfrac{5 t}{2}\right)\right)^2\)
  \(=25 \sin ^2(t)-100 \sin (t) \sin \left(\dfrac{5 t}{2}\right)+100 \sin ^2\left(\dfrac{5 t}{2}\right)\)
       \(\quad +25 \cos ^2(t)-100 \cos (t) \cos \left(\dfrac{5 t}{2}\right)+100 \cos ^2\left(\dfrac{5 t}{2}\right)\)
  \(=125-100\left(\sin (t) \sin \left(\dfrac{5 t}{2}\right)-\cos (t) \cos \left(\dfrac{5 t}{2}\right)\right)\)
  \(=125-100 \cos \left(\dfrac{5 t}{2}-t\right)\)
\(\text{speed}\) \(=\sqrt{125-100 \cos \left(\dfrac{3t}{2}\right)}\)


e.    \(\text{Speed}_{\text {max }} \ \text {occurs when} \ \ \cos \left(\frac{3 t}{2}\right)=-1\)

\(\text{Speed}_{\text {max}}=\sqrt{125+100}=15 \ \text{ms}^{-1}\)
 

f.    \(\text{At} \ \ t=\pi, \quad r(\pi)=-5\underset{\sim}{i}-4\underset{\sim}{j}\)

\(\text{Path traces curve from}\ (1,0)\ \text{to}\ (-5,-4).\)


g.    \(\text{Length of curve (by CAS):}\)

\(\displaystyle \int_0^\pi \sqrt{125-100 \cos \left(\frac{3 t}{2}\right)} d t=36.6\ \text{(1 d.p.)}\)

Filed Under: Position Vectors as a Function of Time Tagged With: Band 3, Band 4, smc-1178-20-Find \(r(t)\ v(t)\ a(t)\), smc-1178-40-Circular motion

Functions, MET2 2025 VCAA 5 MC

Which of the following sets represents a function that has an inverse function?

  1. \(\{(1,3),(2,0),(2,1)\}\)
  2. \(\{(-1,3),(2,2),(3,1)\}\)
  3. \(\{(-1,3),(0,1),(1,3)\}\)
  4. \(\{(1,0),(2,3),(1,3)\}\)
Show Answers Only

\(B\)

Show Worked Solution

\(\text{Option A and D are not functions (x-values have two y-values).}\)

\(\text{Consider option B:}\)

\(\{(-1,3),(2,2),(3,1)\} \ \text{is a one-to-one function.}\)

\(\therefore \ \text {Inverse exists}\)

\(\text{Note that option C is not one-to-one because two different inputs (-1 and 1) map to}\)

\(\text{the same output (3), so its inverse would not be a function.}\)

\(\Rightarrow B\)

Filed Under: Functional Equations Tagged With: Band 3, smc-642-40-Other functions

Graphs, MET2 2025 VCAA 1 MC

A function that has a range of \([6,12]\) is

  1. \(f: R \rightarrow R, \ f(x)=6+3 \cos (9 x)\)
  2. \(f: R \rightarrow R, \ f(x)=6+6 \cos (3 x)\)
  3. \(f: R \rightarrow R, \ f(x)=9-3 \cos (6 x)\)
  4. \(f: R \rightarrow R, \ f(x)=9-6 \cos (3 x)\)
Show Answers Only

\(C\)

Show Worked Solution

\(\text{By trial and error,}\)

\(\text{Consider option C:}\ \  f(x)=9-3 \cos (6 x)\)

\(\text{Since}\ \ -1 \leqslant \cos (6 x) \leqslant 1\)

\(\text{Range is} \ \ [-3+9,3+9]=[6,12]\)

\(\Rightarrow C\)

Filed Under: Trig Graphing Tagged With: Band 3, smc-2757-15-Cos, smc-2757-35-Find range

Complex Numbers, SPEC2 2025 VCAA 2

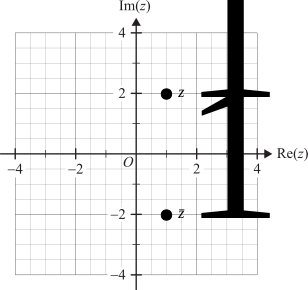
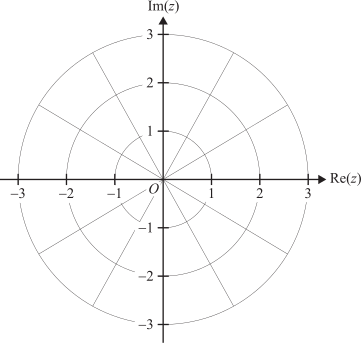
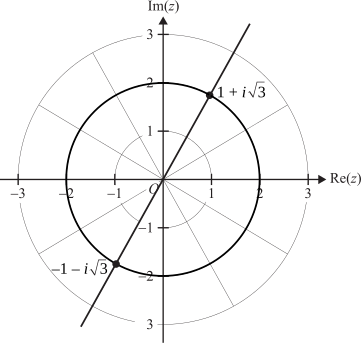
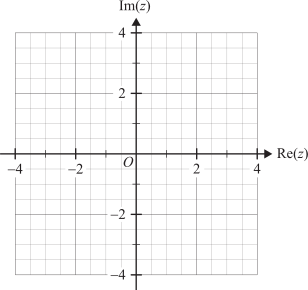
  1. Sketch \(\{z: z \bar{z}=4, z \in C\}\) on the Argand plane below.   (1 mark)
     

    1. Show that \(\{z:|z-2 i|=|z-\sqrt{3}-i|, z \in C\}\) may be expressed as  \(y=\sqrt{3} x\).   (2 marks)

      --- 5 WORK AREA LINES (style=lined) ---

    2. Sketch \(\{z:|z-2 i|=|z-\sqrt{3}-i|, z \in C\}\) on the Argand plane in part a.   (1 mark)

      --- 0 WORK AREA LINES (style=lined) ---

    1. Find the points of intersection of the curves defined in part a and in part b.i, expressing your answers in the form  \(a+i b\), where  \(a, b \in R\).   (2 marks)

      --- 4 WORK AREA LINES (style=lined) ---

    2. Label these points on the Argand plane in part a.   (1 mark)

      --- 0 WORK AREA LINES (style=lined) ---

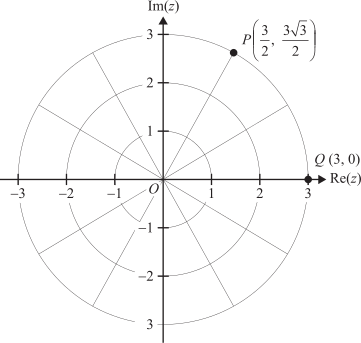
Consider the points \(P\) and \(Q\) labelled on the Argand plane below.
 

  1. A ray originating at point \(P\) and passing through point \(Q\) has the equation  \(\operatorname{Arg}\left(z-z_0\right)=\theta\), where \(\theta\) is a radian measure.
  2. Write down the values of \(z_0\) and \(\theta\).   (1 mark)

    --- 2 WORK AREA LINES (style=lined) ---

  3. Find the area of the minor segment bounded by the chord connecting the points \(P\) and \(Q\) and the circle given by  \(|z|=3\).
  4. Give your answer in the form \(c \pi+d\), where \(c, d \in R\).   (2 marks)

    --- 4 WORK AREA LINES (style=lined) ---

Show Answers Only

a.    \(z \bar{z}=4\ \ \Rightarrow\ \ \text{Circle, centre (0, 0), radius = 2}\)
 

b.i  \(\abs{z-2 i}=\abs{x+(y-2) i}=x^2+(y-2)^2\)

\(\abs{z-\sqrt{3}-i}=\abs{x-\sqrt{3}+(y-1)^2}=(x-\sqrt{3})^2+(y-1)^2\)

\(\text{Equating expressions:}\)

\(x^2+(y-2)^2=(x-\sqrt{3})^2+(y-1)^2\)

\(x^2+y^2-4 y+4=x^2-2 \sqrt{3} x+3+y^2-2 y+1\)

\(-2 y\) \(=-2 \sqrt{3} x\)
\(y\) \(=\sqrt{3} x\)


b.ii    \(\text {See image in part (a).}\)

  \(\abs{z-2 i}=\abs{z-\sqrt{3}-i} \ \Rightarrow \ \text{see straight line in image.}\)
 

c.i   \(\text{Find intersection:}\)

\(x^2+y^2=4 \ \ \text{and} \ \ y=\sqrt{3} x\)

\(x^2+3 x^2=4 \ \ \Rightarrow \ \ x^2=1 \ \ \Rightarrow \ \ x= \pm 1\)

\(\text{Intersection co-ordinates:}\ \ (1, \sqrt{3}),(-1,-\sqrt{3})\)

\(z=1+\sqrt{3} i\)

\(z=-1-\sqrt{3} i\)
 

c.ii  \(\text{See image in part (a)}\)
 

d.    \(z_0=\dfrac{3}{2}+\dfrac{3 \sqrt{3}}{2} i\)

\(\theta=-\dfrac{\pi}{3}\)
 

e.    \(A\) \(=\dfrac{1}{2} \times 3^2 \times\left(\dfrac{\pi}{3}-\sin \dfrac{\pi}{3}\right)\)
    \(=\dfrac{3}{2} \pi-\dfrac{9 \sqrt{3}}{4}\)
Show Worked Solution

a.    \(z \bar{z}=4\ \ \Rightarrow\ \ \text{Circle, centre (0, 0), radius = 2}\)
 

b.i  \(\abs{z-2 i}=\abs{x+(y-2) i}=x^2+(y-2)^2\)

\(\abs{z-\sqrt{3}-i}=\abs{x-\sqrt{3}+(y-1)^2}=(x-\sqrt{3})^2+(y-1)^2\)

\(\text{Equating expressions:}\)

\(x^2+(y-2)^2=(x-\sqrt{3})^2+(y-1)^2\)

\(x^2+y^2-4 y+4=x^2-2 \sqrt{3} x+3+y^2-2 y+1\)

\(-2 y\) \(=-2 \sqrt{3} x\)
\(y\) \(=\sqrt{3} x\)


b.ii    \(\text {See image in part (a).}\)

  \(\abs{z-2 i}=\abs{z-\sqrt{3}-i} \ \Rightarrow \ \text{see straight line in image.}\)
 

c.i   \(\text{Find intersection:}\)

\(x^2+y^2=4 \ \ \text{and} \ \ y=\sqrt{3} x\)

\(x^2+3 x^2=4 \ \ \Rightarrow \ \ x^2=1 \ \ \Rightarrow \ \ x= \pm 1\)

\(\text{Intersection co-ordinates:}\ \ (1, \sqrt{3}),(-1,-\sqrt{3})\)

\(z=1+\sqrt{3} i\)

\(z=-1-\sqrt{3} i\)
 

c.ii  \(\text{See image in part (a)}\)
 

d.    \(z_0=\dfrac{3}{2}+\dfrac{3 \sqrt{3}}{2} i\)

\(\theta=-\dfrac{\pi}{3}\)

Mean mark (d) 51%.
e.    \(A\) \(=\dfrac{1}{2} \times 3^2 \times\left(\dfrac{\pi}{3}-\sin \dfrac{\pi}{3}\right)\)
    \(=\dfrac{3}{2} \pi-\dfrac{9 \sqrt{3}}{4}\)

Filed Under: Geometry and Complex Numbers Tagged With: Band 3, Band 4, smc-1173-10-Circles, smc-1173-40-Linear

Calculus, SPEC2 2025 VCAA 1

  1. Sketch the graph of  \(y(x)=\dfrac{3 x}{x^3+x+2}\)  on the axes below.
  2. Label the asymptotes with their equations, and label the turning point and the point of inflection with their coordinates. Give the coordinates of the point of inflection correct to one decimal place.   (3 marks)

    --- 0 WORK AREA LINES (style=lined) ---

  1. The region bounded by the graph of  \(y=\dfrac{3 x}{x^3+x+2}\), the coordinate axes and the line  \(x=2\)  is rotated about the \(x\)-axis to form a solid of revolution.
    1. Write down a definite integral that, when evaluated, will give the volume of the solid of revolution.   (1 mark)

      --- 2 WORK AREA LINES (style=lined) ---

    2. Find the volume of the solid of revolution correct to two decimal places.   (1 mark)

      --- 2 WORK AREA LINES (style=lined) ---

  2. Find the equations of the vertical asymptotes of the curve given by  \(y=\dfrac{3 x}{x^3-5 x+2}\).   (1 mark)

    --- 3 WORK AREA LINES (style=lined) ---

  3. A family of curves is given by  \(y(x)=\dfrac{3 x}{x^3+a x+2}\), where  \(a \in R\).
    1. Consider the case where the graph has a stationary point \(P\).
    2. Find the \(y\)-coordinate of \(P\) in terms of \(a\).   (1 mark)

      --- 3 WORK AREA LINES (style=lined) ---

    3. For a given value of \(a\), the graph has no stationary points.
    4. Find the equations of the vertical asymptotes of the graph in this case.   (1 mark)

      --- 3 WORK AREA LINES (style=lined) ---

    5. For a given value of \(a\), the graph will have a point of inflection at  \(x=2\).
    6. Find the value of \(a\).   (2 marks)

      --- 3 WORK AREA LINES (style=lined) ---

Show Answers Only

a.    

b.i.    \(V=\displaystyle \int_0^2 \pi\left(\frac{3 x}{x^3+x+2}\right)^2 \, d x\)

b.ii.  \(V=2.29\ \text{u}^3\)

c.   \(x=-\sqrt{2}-1, \ x=\sqrt{2}-1, \ x=2\)

d.i.  \(\text{SP at} \ \left(1, \dfrac{3}{3+a}\right)\)
 

d.ii. \(\text{No SP’s exist when}\ \ 3+a=0 \ \ \Rightarrow \ \ a=-3\)

\(x=-2,1\)

d.iii.  \(a=\dfrac{24}{5}\)

Show Worked Solution

a.    

b.i.    \(V=\displaystyle \int_0^2 \pi\left(\frac{3 x}{x^3+x+2}\right)^2 \, d x\)
 

b.ii.  \(V=2.29\ \text{u}^3\)
 

c.   \(\text{Find vertical asymptotes.}\)

\(\text {Solve:} \ \ x^3-5 x+\dfrac{1}{2}=0\)

\(x=-\sqrt{2}-1, \ x=\sqrt{2}-1, \ x=2\)
 

d.i.  \(y=\dfrac{3 x}{x^3+a x+2}\)

\(\text{Find \(x\) when \(y^{\prime}=0 \ \ \Rightarrow \ \ x=1\)}\)

\(\text{SP at} \ \ \left(1, \dfrac{3}{3+a}\right)\)
 

d.ii. \(\text{No SP’s exist when}\ \ 3+a=0 \ \ \Rightarrow \ \ a=-3\)

\(y=\dfrac{3 x}{x^3-3 x+2}\)

\(\text{Vertical asymptotes occur when}\ \ x^3-3 x+2=0\)

\(\text{(By CAS):} \ \ x=-2,1\)

♦ Mean mark (d.ii) 46%.

d.iii.  \(\text{If POI exists at} \ \ x=2:\)

\(y^{\prime \prime}(2)=0 \ \Rightarrow \ \dfrac{-3(5 a-24)}{2(a+5)^3}=0\)

\(a=\dfrac{24}{5}\)

Filed Under: Solids of Revolution, Tangents and Curve Sketching Tagged With: Band 3, Band 4, Band 5, smc-1180-40-Other graphs, smc-1180-50-x-axis rotations, smc-1182-35-Sketch curve, smc-1182-40-Other 1st/2nd deriv problems

Calculus, EXT1 C3 2025 SPEC2 8 MC

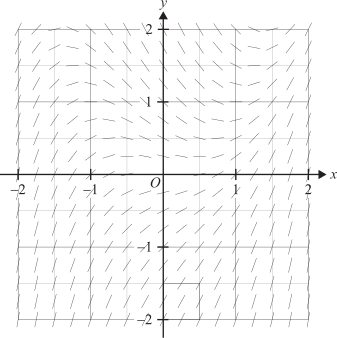
Consider the direction field below.
 

The direction field best represents the differential equation

  1. \(\dfrac{d y}{d x}=x^2-y\)
  2. \(\dfrac{d y}{d x}=x-y^2\)
  3. \(\dfrac{d y}{d x}=y-x\)
  4. \(\dfrac{d y}{d x}=x-y\)
Show Answers Only

\(A\)

Show Worked Solution

\(\text{By elimination:}\)

\(\text{At \((-1,0)\), gradient is positive (eliminate B and D)}\).

\(\text{At \((1,0)\), gradient is positive (eliminate C)}\).

\(\Rightarrow A\)

Filed Under: Equations and Slope Fields, Equations and Slope Fields Tagged With: Band 3, smc-1197-10-Slope Fields, smc-7296-10-Slope Fields

Proof, EXT2 P1 2025 SPEC2 1 MC

A tiger is a type of cat.

Consider the following statement.

'If I have a tiger, then I have a cat.'

The contrapositive of this statement is

  1. if I do not have a tiger, then I do not have a cat.
  2. if I have a cat, then I have a tiger.
  3. if I do not have a cat, then I do not have a tiger.
  4. if I do not have a tiger, then I have a different type of cat.
Show Answers Only

\(C\)

Show Worked Solution

\(\text{Statement: If} \ \ X \Rightarrow Y\)

\(\text{Contrapositive: If}\ \ \neg \ Y\ \Rightarrow \neg \ X\)

\(\text{If I don’t have a cat} \ \ \Rightarrow \ \ \text{I don’t have a tiger.}\)

\(\Rightarrow C\)

Filed Under: Converse, Contradiction and Contrapositive Proof, Language and Illustrations of Proofs Tagged With: Band 3, smc-1207-20-Contrapositive, smc-7421-30-Contrapositive, smc-7422-25-Contrapositive

Probability, 2ADV EQ-Bank 19

A new test has been developed for determining whether or not people are carriers of the Gaussian virus.

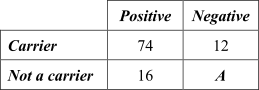
Two hundred people are tested. A two-way table is being used to record the results.
 

  1.  What is the value of `A`?   (1 mark)

    --- 1 WORK AREA LINES (style=lined) ---

  2.  A person randomly selected from the tested group is a carrier of the virus.
  3. What is the probability that the test results would show this?   (1 mark) 

    --- 4 WORK AREA LINES (style=lined) ---

  4. If the person randomly selected has a negative result from their test, what is the probability they are not a carrier of the virus?   (2 marks)

    --- 4 WORK AREA LINES (style=lined) ---

Show Answers Only

a.    `98`

b.    `37/43`

c.    `49/55`

Show Worked Solution

a.    `A= 200-(74 + 12 + 16)= 98`
 

b.    `P` `= text(#Positive carriers)/text(Total carriers)`
  `= 74/86`
  `= 37/43`


c.    `text(Total number with negative results) = 110`

`text{Total non-carriers with negative results}\ = 98`

`P\text{(not a carrier)|negative result}\ = 98/110=49/55`

Filed Under: Conditional Probability and Venn Diagrams Tagged With: Band 3, Band 4, smc-6470-25-Two-way tables

Probability, 2ADV EQ-Bank 16

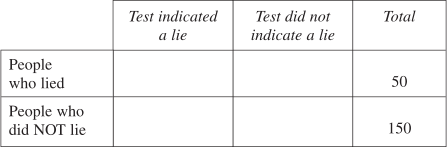
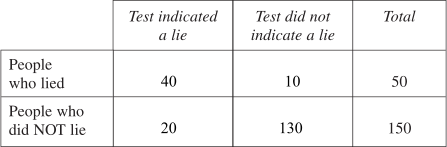
Lie detector tests are not always accurate. A lie detector test was administered to 200 people.

The results were:

• 50 people lied. Of these, the test indicated that 40 had lied;
• 150 people did NOT lie. Of these, the test indicated that 20 had lied.

  1. Complete the table using the information above   (1 mark)


    --- 0 WORK AREA LINES (style=lined) ---

  2. For what percentage of the people tested was the test accurate?   (1 mark)

    --- 3 WORK AREA LINES (style=lined) ---

  3. What is the probability that the test indicated a lie for a person who did NOT lie?   (1 mark)

    --- 3 WORK AREA LINES (style=lined) ---

Show Answers Only

a.    `text(See Worked Solutions)`

b.    `text(85%)`

c.    `2/15`

Show Worked Solution

a.

b.  `text(Percentage of people with accurate readings)`

`= text(# Accurate readings)/text(Total readings) xx 100`

`= (40+130)/200`

`= 85 text(%)`
 

c.  `text{P(lie detected when NOT a lie)}`

`= 20/150`

`= 2/15`

Filed Under: Conditional Probability and Venn Diagrams Tagged With: Band 3, Band 4, smc-6470-25-Two-way tables

Statistics, 2ADV EQ-Bank 4 MC

A random variable \(X\) is defined as the volume of fuel (in litres) dispensed by a bowser per use. Which statement best describes \(X\) ?

  1. \(X\) is discrete because the machine dispenses a fixed amount each time.
  2. \(X\) is discrete because volume can only take positive values.
  3. \(X\) is continuous because the machine is used many times per day.
  4. \(X\) is continuous because volume can take any value within an interval.
Show Answers Only

\(D\)

Show Worked Solution
  • Volume is a measurement variable that can take any value within a range, so \(X\) is a continuous random variable.

\(\Rightarrow D\)

Filed Under: Data Tagged With: Band 3, smc-6805-10-Discrete vs Continuous

Statistics, 2ADV EQ-Bank 3 MC

Which of the following is an example of a continuous random variable?

  1. The number of text messages sent by a student in a day
  2. The time taken for a swimmer to complete 100 m race
  3. The number of cars in a school car park at 9 am
  4. The number of siblings a student has
Show Answers Only

\(B\)

Show Worked Solution
  • Time is a measurement that can take any value within an interval and is therefore continuous.
  • Options A, B and D are all counts that can only take whole number values, making them discrete.

\(\Rightarrow B\)

Filed Under: Data Tagged With: Band 3, smc-6805-10-Discrete vs Continuous

Statistics, 2ADV EQ-Bank 2 MC

A hospital records the number of patients admitted to the emergency department each day. How would this data best be classified?

  1. Discrete, because the number of patients changes every day
  2. Discrete, because the count can only take whole number values
  3. Continuous, because the number of patients can be very large
  4. Continuous, because patient admission is an ongoing process
Show Answers Only

\(B\)

Show Worked Solution
  • The number of patients is a count and can only take whole number values, making it a discrete numerical variable.

\(\Rightarrow B\)

Filed Under: Data Tagged With: Band 3, smc-6805-10-Discrete vs Continuous

Statistics, 2ADV EQ-Bank 1 MC

A scientist measures the wingspan of butterflies in a study. How would this data best be classified?

  1. Discrete, because wingspan can be measured precisely
  2. Discrete, because each butterfly has a unique wingspan
  3. Continuous, because wingspan can take any value within a range
  4. Continuous, because there are many butterflies in the study
Show Answers Only

\(C\)

Show Worked Solution
  • Wingspan is a measurement that can take any value within a range, making it a continuous numerical variable.

\(\Rightarrow C\)

Filed Under: Data Tagged With: Band 3, smc-6805-10-Discrete vs Continuous

Complex Numbers, EXT2 N2 2025 SPEC1 8

Consider the function with rule  \(f(z)=z^4+6 z^2+25\), where \(z \in C\).

  1. Consider  \(z_1=1+2 i\).
  2. Plot and label \(z_1\) and \(\overline{z}_1\) on the Argand plane below.   (1 mark)  

    --- 0 WORK AREA LINES (style=lined) ---

     
  3. Given that  \(1+2 i\)  is a solution of  \(f(z)=0\), find a quadratic factor of \(f(z)\).   (2 marks)  

    --- 6 WORK AREA LINES (style=lined) ---

  4. Hence, find all remaining solutions of  \(f(z)=0\).   (2 marks)

    --- 10 WORK AREA LINES (style=lined) ---

Show Answers Only

a.    \(z_1=1+z_i \ \Rightarrow \ \overline{z}_1=1-z_i\)
 

b.    \(z^2-2 z+5\)

c.    \(z=-1+2 i, z=-1-2 i\)

Show Worked Solution

a.    \(z_1=1+z_i \ \Rightarrow \ \overline{z}_1=1-z_i\)
 

b.    \(\text{Since} \ \ 1+2 i \ \ \text{is a solution of}\ \ f(z)=0:\)

\(\Rightarrow 1-2 i \ \ \text{is also a solution (conjugate factor theorem).}\)

\(\text {Express as a quadratic factor:}\)

\((z-(1+2 i))(z-(1-2 i))\) \(=((z-1)-2 i)((z-1)+2 i)\)
  \(=(z-1)^2-4 i^2\)
  \(=z^2-2 z+5\)


c.    \(f(z)=z^4+6 z^2+25, \quad z \in C\)

\(\text{Since \(\ z^2-2 z+5\ \) is a factor:}\)

\(f(z)\) \(=\left(z^2-2 z+5\right)\left(z^2+a z+b\right)\)
  \(=z^2\left(z^2+a z+b\right)-2 z\left(z^2+a z+b\right)+5\left(z^2+a z+b\right)\)
  \(=z^4+a z^3+b z^2-2 z^3-2 a z^2-2 b z+5 z^2+5 a z+5 b\)
  \(=z^4+(a-2) z^3+(b-2 a+5) z^2+(-2 b+5 a) z+5 b\)
Mean mark (c) 53%.

\(\text{Equating co-efficients:}\)

\(a-2=0 \ \Rightarrow \ a=2\)

\(5 b=25 \ \Rightarrow \ b=5\)

\(f(z)=\left(z^2-2 z+5\right)\left(z^2+2 z+5\right)\)
 

\(\text{Solve:} \ \ z^2+2 z+5=0\)

\(z=\dfrac{-2 \pm \sqrt{2^2-4 \cdot 1 \cdot 5}}{2}=\dfrac{-2 \pm \sqrt{-16}}{2}=-1 \pm 2 i\)

\(\therefore \ \text{Other solutions:}\ \ z=-1+2 i, z=-1-2 i\)

Filed Under: Solving Equations, Solving Equations with Complex Numbers Tagged With: Band 3, Band 4, smc-1050-10-Quadratic roots, smc-1050-30-Roots > 3, smc-1050-35-Conjugate roots, smc-7429-10-Quadratic roots, smc-7429-30-Roots > 3, smc-7429-35-Conjugate roots

Calculus, SPEC2 2025 VCAA 8 MC

Consider the direction field below.
 

The direction field best represents the differential equation

  1. \(\dfrac{d y}{d x}=x^2-y\)
  2. \(\dfrac{d y}{d x}=x-y^2\)
  3. \(\dfrac{d y}{d x}=y-x\)
  4. \(\dfrac{d y}{d x}=x-y\)
Show Answers Only

\(A\)

Show Worked Solution

\(\text{By elimination:}\)

\(\text{At \((-1,0)\), gradient is positive (eliminate B and D)}\).

\(\text{At \((1,0)\), gradient is positive (eliminate C)}\).

\(\Rightarrow A\)

Filed Under: Euler, Pseudocode and Slope Fields Tagged With: Band 3, smc-1183-20-Slope fields

Calculus, SPEC2 2025 VCAA 7 MC

Using the substitution  \(u=\cos (\theta), \dfrac{1}{2} \displaystyle \int_0^{\tfrac{\pi}{2}} \dfrac{\sin (2 \theta)}{1+\cos (\theta)} \, d \theta\)  can be expressed as

  1. \(\displaystyle\int_0^{\tfrac{\pi}{2}} u \sqrt{\frac{1-u}{1+u}}\ d u\)
  2. \(\displaystyle\int_0^1\left(1+\frac{1}{1+u}\right) d u\)
  3. \(\displaystyle\int_0^{\tfrac{\pi}{2}}\left(1-\frac{1}{1+u}\right) d u\)
  4. \(\displaystyle\int_0^1\left(1-\frac{1}{1+u}\right) d u\)
Show Answers Only

\(D\)

Show Worked Solution

\(u=\cos (\theta) \ \Rightarrow \ du=-\sin (\theta)\ d \theta\)

\(\text{When} \ \ \theta=\dfrac{\pi}{2}, u=0\)

\(\text{When}\ \  \theta=0, u=1\)

\(I\) \(=\displaystyle\frac{1}{2} \int_0^{\tfrac{\pi}{2}} \frac{\sin (2 \theta)}{1+\cos \theta} \, d \theta\)
  \(=\displaystyle\int_0^{\tfrac{\pi}{2}} \frac{\sin (\theta) \cos (\theta)}{1+\cos (\theta)} \, d \theta\)
  \(=\displaystyle \int_1^0-\frac{u}{1+u} \, d u\)
  \(=\displaystyle\int_0^1 \frac{1+u-1}{1+u} \, d u\)
  \(=\displaystyle\int_0^1\left(1-\frac{1}{1+u}\right) \, d u\)


\(\Rightarrow D\)

Filed Under: Integration by Substitution Tagged With: Band 3, smc-2564-30-Trig

Statistics, STD2 S1 2010 HSC 26b*

A new shopping centre has opened near a primary school. A survey is conducted to determine the number of motor vehicles that pass the school each afternoon between 2.30 pm and 4.00 pm.

The results for 60 days have been recorded in the table and are displayed in the cumulative frequency histogram.
 

2010 26b

  1. Find the value of  Χ  in the table.   (1 mark)

    --- 1 WORK AREA LINES (style=lined) ---

  2. On the cumulative frequency histogram above, draw a cumulative frequency polygon (ogive) for this data.   (1 mark)
  3. Use your graph to determine the median. Show, by drawing lines on your graph, how you arrived at your answer.   (1 mark)
Show Answers Only

a.    `15`

b. & c.
               

`text(Median)\ ~~155`

Show Worked Solution

a.    `X= 25-10= 15`

b. & c.
               

`text(Median)\ ~~155`

Filed Under: Data Tagged With: Band 3, Band 4, smc-6805-30-Find Mode/Median

Complex Numbers, SPEC1 2025 VCAA 8

Consider the function with rule  \(f(z)=z^4+6 z^2+25\), where \(z \in C\).

  1. Consider  \(z_1=1+2 i\).
  2. Plot and label \(z_1\) and \(\overline{z}_1\) on the Argand plane below.   (1 mark)  

    --- 0 WORK AREA LINES (style=lined) ---

     
  3. Given that  \(1+2 i\)  is a solution of  \(f(z)=0\), find a quadratic factor of \(f(z)\).   (2 marks)  

    --- 6 WORK AREA LINES (style=lined) ---

  4. Hence, find all remaining solutions of  \(f(z)=0\).   (2 marks)

    --- 10 WORK AREA LINES (style=lined) ---

Show Answers Only

a.    \(z_1=1+z_i \ \Rightarrow \ \overline{z}_1=1-z_i\)
 

b.    \(z^2-2 z+5\)

c.    \(z=-1+2 i, z=-1-2 i\)

Show Worked Solution

a.    \(z_1=1+z_i \ \Rightarrow \ \overline{z}_1=1-z_i\)
 

b.    \(\text{Since} \ \ 1+2 i \ \ \text{is a solution of}\ \ f(z)=0:\)

\(\Rightarrow 1-2 i \ \ \text{is also a solution.}\)

\(\text {Express as a quadratic factor:}\)

\((z-(1+2 i))(z-(1-2 i))\) \(=((z-1)-2 i)((z-1)+2 i)\)
  \(=(z-1)^2-4 i^2\)
  \(=z^2-2 z+5\)


c.    \(f(z)=z^4+6 z^2+25, \quad z \in C\)

\(\text{Since \(\ z^2-2 z+5\ \) is a factor:}\)

\(f(z)\) \(=\left(z^2-2 z+5\right)\left(z^2+a z+b\right)\)
  \(=z^2\left(z^2+a z+b\right)-2 z\left(z^2+a z+b\right)+5\left(z^2+a z+b\right)\)
  \(=z^4+a z^3+b z^2-2 z^3-2 a z^2-2 b z+5 z^2+5 a z+5 b\)
  \(=z^4+(a-2) z^3+(b-2 a+5) z^2+(-2 b+5 a) z+5 b\)
Mean mark (c) 53%.

\(\text{Equating co-efficients:}\)

\(a-2=0 \ \Rightarrow \ a=2\)

\(5 b=25 \ \Rightarrow \ b=5\)

\(f(z)=\left(z^2-2 z+5\right)\left(z^2+2 z+5\right)\)
 

\(\text{Solve:} \ \ z^2+2 z+5=0\)

\(z=\dfrac{-2 \pm \sqrt{2^2-4 \cdot 1 \cdot 5}}{2}=\dfrac{-2 \pm \sqrt{-16}}{2}=-1 \pm 2 i\)

\(\therefore \ \text{Other solutions:}\ \ z=-1+2 i, z=-1-2 i\)

Filed Under: Factors and Roots Tagged With: Band 3, Band 4, smc-1172-30-Roots > 3, smc-1172-40-Conjugate roots

Trigonometry, 2ADV T3 2025 MET1 3

Let  \(f(x)=2 \cos (2 x)+1\)  over the domain \(x \in\left[0, 2 \pi \right]\).

  1. State the range of \(f(x)\).   (1 mark)

    --- 2 WORK AREA LINES (style=lined) ---

  2. Solve  \(f(x)=0\)  for \(x\).   (3 marks)

    --- 8 WORK AREA LINES (style=lined) ---

  3. Sketch the graph of  \(y=f(x)\)  for  \(x \in\left[\dfrac{\pi}{2}, \dfrac{3 \pi}{2}\right]\) on the axes below.
  4. Label the endpoints with their coordinates.   (2 marks)

    --- 0 WORK AREA LINES (style=lined) ---

Show Answers Only

a.    \(\text{Range of } f(x):-1 \leqslant y \leqslant 3\)

b.    \(x=\dfrac{\pi}{3}, \dfrac{2 \pi}{3}, \dfrac{4 \pi}{3}, \dfrac{5 \pi}{3}\)

c.   


Show Worked Solution

a.    \(\text{Amplitude}=2 \ \ \text{about} \ \ y=1.\)

\(\text{Range of } f(x):\ -1 \leqslant y \leqslant 3\)
 

b.     \(2 \cos (2 x)+1\) \(=0\)
  \(\cos (2 x)\) \(=-\dfrac{1}{2}\)

 
\(\text{Base angle}=\dfrac{\pi}{3}\)

\(2x=\pi-\dfrac{\pi}{3}, \pi+\dfrac{\pi}{3}, \cdots\)

\(2x=\dfrac{2 \pi}{3}, \dfrac{4 \pi}{3}, \dfrac{8 \pi}{3}, \dfrac{10 \pi}{3}\)

  \(x=\dfrac{\pi}{3}, \dfrac{2 \pi}{3}, \dfrac{4 \pi}{3}, \dfrac{5 \pi}{3}\)
  

c.   


♦ Mean mark (c) 49%.

Filed Under: Trig Graphs, Trigonometric Functions Tagged With: Band 3, Band 4, Band 5, smc-7124-20-cos, smc-977-20-cos

Calculus, MET1 2025 VCAA 7

Let \(f: R \rightarrow R, f(x)=x^3-x^2-16 x-20\).

  1. Verify that  \(x=5\)  is a solution of  \(f(x)=0\).   (1 mark)

    --- 3 WORK AREA LINES (style=lined) ---

  2. Express \(f(x)\) in the form  \((x+d)^2(x-5)\), where \(d \in R\).   (2 marks)

    --- 8 WORK AREA LINES (style=lined) ---

  3. Consider the graph of  \(y=f(x)\), as shown below.
  4. Complete the coordinate pairs of all axial intercepts of  \(y=f(x)\).   (1 mark)

    --- 0 WORK AREA LINES (style=lined) ---


  1. Let \(g: R \rightarrow R, g(x)=x+2\).
    1. State the coordinates of the stationary point of inflection for the graph of  \(y=f(x) g(x)\).   (1 mark)

      --- 3 WORK AREA LINES (style=lined) ---

    2. Write down the values of \(x\) for which  \(f(x) g(x) \geq 0\).   (1 mark)

      --- 3 WORK AREA LINES (style=lined) ---

Show Answers Only

a.    \(f(5)=5^3-5^2-16 \times 5-20 =0\)

b.    \(f(x)=(x+2)^2(x-5)\)

c.   
       

d.i.   \((-2,0)\)

d.ii.  \(x \in(-\infty,-2] \cup[5, \infty)\)

Show Worked Solution

a.    \(f(x)=x^3-x^2-16 x-20\)

\(f(5)=5^3-5^2-16 \times 5-20=125-25-80-20=0\) 

\(\therefore x=5\ \ \text{is a solution of}\ f(x)\).
 

b.    \(\text{By long division:}\)


\(f(x)=\left(x^2+4 x+4\right)(x-5)=(x+2)^2(x-5)\)
 

c.   


d.i.    \(y\) \(=f(x) \cdot g(x)\)
    \(=(x+2)^2(x-5)(x+2)\)
    \(=(x+2)^3(x-5)\)


\((x+2)^3\ \text{factor}\ \Rightarrow\ \text{SP of inflection at} \ (-2,0)\)

♦ Mean mark (d.i) 44%.
♦♦ Mean mark (d.ii) 27%.
 

d.ii.
     

\(\text{By inspection of graph:}\)

\(f(x) g(x) \geqslant 0 \ \ \text{when}\ \  x \leqslant-2\ \cup\  x \geqslant 5\)

\(x \in(-\infty,-2] \cup[5, \infty) \ \text{also correct.}\)

Filed Under: Curve Sketching Tagged With: Band 3, Band 5, smc-724-10-Cubic, smc-724-20-Degree 4

Probability, MET1 2025 VCAA 4

The probability distribution for the discrete random variable \(X\) is given in the table below, where \(k\) is a positive real number.

\begin{array}{|c|c|c|c|c|}
\hline
\rule{0pt}{2.5ex}x \rule[-1ex]{0pt}{0pt}& \quad \quad 0 \quad \quad & \quad \quad 1 \quad \quad & \quad \quad 2 \quad \quad & \quad \quad 3 \quad \quad \\
\hline
\rule{0pt}{2.5ex}\operatorname{Pr}(X=x) \rule[-1ex]{0pt}{0pt}& \dfrac{4}{k} &\dfrac{2 k}{75} &\dfrac{k}{75} & \dfrac{2}{k} \\
\hline
\end{array}

  1. Show that  \(k=10\)  or  \(k=15\).   (2 marks)

    --- 8 WORK AREA LINES (style=lined) ---

  2. Let  \(k=15\).
    1. Find \(\operatorname{Pr}(X>1)\).   (1 mark)

      --- 3 WORK AREA LINES (style=lined) ---

    2. Find \(E (X)\).   (1 mark)

      --- 4 WORK AREA LINES (style=lined) ---
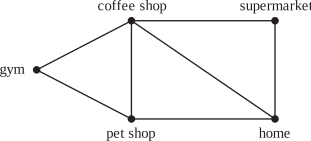
Show Answers Only

a.    \(\text{Sum of probabilities\(=1\):}\)

\(\dfrac{4}{k}+\dfrac{2 k}{75}+\dfrac{k}{75}+\dfrac{2}{k}\) \(=1\)
\(\dfrac{6}{k}+\dfrac{3 k}{75}\) \(=1\)
\(3 k^2+450\) \(=75k\)
\(3 k^2-75 k+450\) \(=0\)
\(k^2-25 k+150\) \(=0\)
\((k-10)(k-15)\) \(=0\)

  
\(\therefore k=10 \ \ \text{or 15}\)

b.i.   \(\operatorname{Pr}(X>1)=\dfrac{1}{3}\) 

b.ii.  \(E(X)=\dfrac{90}{75}\)

Show Worked Solution

a.    \(\text{Sum of probabilities\(=1\):}\)

\(\dfrac{4}{k}+\dfrac{2 k}{75}+\dfrac{k}{75}+\dfrac{2}{k}\) \(=1\)
\(\dfrac{6}{k}+\dfrac{3 k}{75}\) \(=1\)
\(3 k^2+450\) \(=75k\)
\(3 k^2-75 k+450\) \(=0\)
\(k^2-25 k+150\) \(=0\)
\((k-10)(k-15)\) \(=0\)


\(\therefore k=10 \ \ \text{or 15}\)
 

b.i.   \(\operatorname{Pr}(X>1)\) \(=\operatorname{Pr}(X=2)+\operatorname{Pr}(X=3)\)
    \(=\dfrac{15}{75}+\dfrac{2}{15}\)
    \(=\dfrac{1}{3}\)


b.ii.   \(E(X)\) \(=0 \times \dfrac{4}{15}+1 \times \dfrac{30}{75}+2 \times \dfrac{15}{75}+3 \times \dfrac{2}{15}\)
    \(=\dfrac{30}{75}+\dfrac{30}{75}+\dfrac{30}{75}\)
    \(=\dfrac{90}{75}\)

Filed Under: Probability Distribution Tables Tagged With: Band 3, Band 4, smc-732-10-Sum of Probabilities = 1, smc-732-20-E(X) / Mean, smc-732-60-General Probability

BIOLOGY, M8 EQ-Bank 5 MC

Which coordination system detects changes in blood glucose and sends signals to effector organs to restore homeostasis?

  1. Circulatory
  2. Digestive
  3. Hormonal
  4. Neural
Show Answers Only

`D`

Show Worked Solution
  • D is correct: Neural pathways detect changes and send signals to effectors to restore homeostasis.

Other Options:

  • A is incorrect: Circulatory system transports substances; does not detect or signal.
  • B is incorrect: Digestive system processes nutrients; not a coordination system.
  • C is incorrect: Hormonal is a valid coordination system but uses chemical messengers via blood, not neural signals.

Filed Under: Homeostasis Tagged With: Band 3, smc-3659-60-Coordination Systems

Graphs, MET1 2025 VCAA 3

Let  \(f:[0,2 \pi] \rightarrow R, f(x)=2 \cos (2 x)+1\).

  1. State the range of \(f\).   (1 mark)

    --- 2 WORK AREA LINES (style=lined) ---

  2. Solve  \(f(x)=0\)  for \(x\).   (3 marks)

    --- 8 WORK AREA LINES (style=lined) ---

  3. Sketch the graph of  \(y=f(x)\)  for  \(x \in\left[\dfrac{\pi}{2}, \dfrac{3 \pi}{2}\right]\) on the axes below.
  4. Label the endpoints with their coordinates.   (2 marks)

    --- 0 WORK AREA LINES (style=lined) ---

Show Answers Only

a.    \(\text{Range of } f(x):-1 \leqslant y \leqslant 3\)

b.    \(x=\dfrac{\pi}{3}, \dfrac{2 \pi}{3}, \dfrac{4 \pi}{3}, \dfrac{5 \pi}{3}\)

c.   


Show Worked Solution

a.    \(\text{Amplitude}=2 \ \ \text{about} \ \ y=1.\)

\(\text{Range of } f(x):\ -1 \leqslant y \leqslant 3\)
 

b.     \(2 \cos (2 x)+1\) \(=0\)
  \(\cos (2 x)\) \(=-\dfrac{1}{2}\)

 
\(\text{Base angle}=\dfrac{\pi}{3}\)

\(2x=\pi-\dfrac{\pi}{3}, \pi+\dfrac{\pi}{3}, \cdots\)

\(2x=\dfrac{2 \pi}{3}, \dfrac{4 \pi}{3}, \dfrac{8 \pi}{3}, \dfrac{10 \pi}{3}\)

  \(x=\dfrac{\pi}{3}, \dfrac{2 \pi}{3}, \dfrac{4 \pi}{3}, \dfrac{5 \pi}{3}\)
  

c.   


♦ Mean mark (c) 49%.

Filed Under: Trig Equations, Trig Graphing Tagged With: Band 3, Band 4, Band 5, smc-2757-15-Cos, smc-2757-35-Find range, smc-725-20-Cos

Calculus, MET1 2025 VCAA 1a

Let  \(y=x^2 \cos (x)\).

Find \(\dfrac{d y}{d x}\).   (1 mark)

--- 5 WORK AREA LINES (style=lined) ---

Show Answers Only

\(\dfrac{d y}{d x}=x(2 \cos (x)-x\,\sin (x))\)

Show Worked Solution
\(y\) \(=x^2 \cos (x)\)
\(\dfrac{d y}{d x}\) \(=2 x \cos (x)+x^2(-\sin (x))\)
  \(=x(2 \cos (x)-x\,\sin (x))\)

Filed Under: Trig Differentiation Tagged With: Band 3, smc-744-20-cos, smc-744-40-Product Rule

Statistics, STD2 S1 EQ-Bank 18

A boxplot for the sale prices of a sample of 203 homes is shown.
 

  1. Calculate the range of the sale price data in the boxplot.   (1 mark)

    --- 1 WORK AREA LINES (style=lined) ---

  2. Calculate the upper fence for any outliers within the sale price data of the boxplot.   (2 marks)

    --- 5 WORK AREA LINES (style=lined) ---

Show Answers Only

a.    \(\text{Range}=900\,000\)

b.    \(1\,350\,000\)

Show Worked Solution

a.    \(\text{Range}=1\,300\,000-400\,000=900\,000\)
 

b.    \(IQR=900\,000-600\,000=300\,000\)

\(Q_3=900\,000\)

\(\text{Upper Fence}\) \(=Q_3+1.5 \times IQR\)
  \(=900\,000+1.5 \times 300\,000\)
  \(=1\,350\,000\)

Filed Under: Summary Statistics - Box Plots Tagged With: Band 3, Band 4, smc-6313-10-Single Box Plots, smc-6313-40-Outliers

Networks, GEN2 2025 VCAA 15

Frances lives in a housing estate.

On the graph below the vertices represent her favourite locations, and the edges represent the roads between them.
 

  1. Calculate the sum of the degrees of all the vertices in this graph.   (1 mark)

    --- 2 WORK AREA LINES (style=lined) ---

  2. Euler's formula, \(v+f=e+2\), holds for this graph.
  3. Complete the formula by writing the appropriate numbers in the boxes below.   (1 mark)

    --- 0 WORK AREA LINES (style=lined) ---

  1. Frances is at the gym. She would like to visit each of the other locations once and end at her home.
  2. What is the mathematical term used to describe this route?   (1 mark)

    --- 1 WORK AREA LINES (style=lined) ---

  3. Using edges from the original graph, construct a spanning tree below.   (1 mark)


--- 0 WORK AREA LINES (style=lined) ---

Show Answers Only

a.    \(\text{Sum of degrees}=2+4+2+3+3=14\)

b.    \(5+4=7+2\)

c.    \(\text{Hamiltonian path}\)

d.    \(\text{Spanning tree (one of many possibilities):}\)
 

Show Worked Solution

a.    \(\text{Sum of degrees}=2+4+2+3+3=14\)
 

b.    \(v+f=e+2 \ \ \Rightarrow \ \ 5+4=7+2\)
 

c.    \(\text{Hamiltonian path}\)

♦ Mean mark (c) 53%.

d.    \(\text{Spanning tree (one of many possibilities):}\)
 

Filed Under: Basic Concepts, Minimum Spanning Trees and Shortest Paths Tagged With: Band 3, Band 5, smc-624-40-Prim's Algorithm, smc-626-10-Definitions, smc-626-20-Degrees of Vertices, smc-626-40-Euler's Formula

Data Analysis, GEN2 2025 VCAA 2

A boxplot for the sale prices of a sample of 203 homes is shown.
 

  1. Calculate the range of the sale price data in the boxplot.   (1 mark)

    --- 1 WORK AREA LINES (style=lined) ---

  2. Calculate the upper fence for the sale price data in the boxplot.   (1 mark)

    --- 3 WORK AREA LINES (style=lined) ---

Show Answers Only

a.    \(\text{Range}=900\,000\)

b.    \(1\,350\,000\)

Show Worked Solution

a.    \(\text{Range}=1\,300\,000-400\,000=900\,000\)
 

b.    \(IQR=900\,000-600\,000=300\,000\)

\(Q_3=900\,000\)

\(\text{Upper Fence}\) \(=Q_3+1.5 \times IQR\)
  \(=900\,000+1.5 \times 300\,000\)
  \(=1\,350\,000\)

Filed Under: Graphs - Stem/Leaf and Boxplots Tagged With: Band 3, smc-643-10-Single Box-Plots, smc-643-60-Outliers

Data Analysis, GEN2 2025 VCAA 1

Table 1, below, shows the prices in dollars, price, for a sample of 20 homes sold in an inner Melbourne suburb during 2017.

The type of home sold is either an apartment or a house.

Table 1

\begin{array}{|c|c|}
\hline \rule{0pt}{2.5ex}\quad \ \textit{Price(\$)}\quad \ \rule[-1ex]{0pt}{0pt}& \textit{Type} \\
\hline \rule{0pt}{2.5ex}350\,000 \rule[-1ex]{0pt}{0pt}& \ \ \text{apartment}\ \ \\
\hline \rule{0pt}{2.5ex}490\,000 \rule[-1ex]{0pt}{0pt}& \text{apartment}\\
\hline \rule{0pt}{2.5ex}500\,000 \rule[-1ex]{0pt}{0pt}& \text{apartment}\\
\hline \rule{0pt}{2.5ex}620\,000 \rule[-1ex]{0pt}{0pt}& \text{apartment}\\
\hline \rule{0pt}{2.5ex}720\,000 \rule[-1ex]{0pt}{0pt}\rule[-1ex]{0pt}{0pt}& \text{apartment}\\
\hline \rule{0pt}{2.5ex}830\,000 & \text{apartment}\\
\hline \rule{0pt}{2.5ex}875\,000 \rule[-1ex]{0pt}{0pt}& \text{apartment}\\
\hline \rule{0pt}{2.5ex}995\,000 \rule[-1ex]{0pt}{0pt}& \text{apartment}\\
\hline \rule{0pt}{2.5ex}1\,100\,000 \rule[-1ex]{0pt}{0pt}& \text{apartment}\\
\hline \rule{0pt}{2.5ex}1\,520\,000 \rule[-1ex]{0pt}{0pt}& \text{apartment}\\
\hline \rule{0pt}{2.5ex}800\,000 \rule[-1ex]{0pt}{0pt} & \text{house}\\
\hline \rule{0pt}{2.5ex}840\,000 \rule[-1ex]{0pt}{0pt}& \text{house}\\
\hline \rule{0pt}{2.5ex}920\,000 \rule[-1ex]{0pt}{0pt}& \text{house} \\
\hline \rule{0pt}{2.5ex}920\,000 \rule[-1ex]{0pt}{0pt}& \text{house}\\
\hline \rule{0pt}{2.5ex}1\,010\,000\rule[-1ex]{0pt}{0pt} & \text{house}\\
\hline \rule{0pt}{2.5ex}1\,263\,000 \rule[-1ex]{0pt}{0pt}& \text{house}\\
\hline \rule{0pt}{2.5ex}1\,398\,000 \rule[-1ex]{0pt}{0pt}& \text{house}\\
\hline \rule{0pt}{2.5ex}1\,460\,000\rule[-1ex]{0pt}{0pt} & \text{house}\\
\hline \rule{0pt}{2.5ex}1\,540\,000 \rule[-1ex]{0pt}{0pt}& \text{house} \\
\hline \rule{0pt}{2.5ex}1\,540\,000 \rule[-1ex]{0pt}{0pt} & \text{house}\\
\hline
\end{array}

  1. Find the median, in dollars, of the variable price.   (1 mark)

    --- 1 WORK AREA LINES (style=lined) ---

  2. State whether the variable type is numerical, nominal or ordinal.   (1 mark)

    --- 1 WORK AREA LINES (style=lined) ---

    1. Complete the table below by finding the standard deviation, to the nearest whole number, for the sale price of apartments in the sample.   (1 mark)

      --- 0 WORK AREA LINES (style=lined) ---

    2. Table 2
      \begin{array}{|c|c|}
      \hline \rule{0pt}{2.5ex} \quad \ \ \textbf{Type of home} \quad \ \ & \quad \textbf{Standard deviation of} \quad \\
      & \rule[-1ex]{0pt}{0pt}\textbf{sale price (\$)}\\
      \hline \rule{0pt}{2.5ex}\text{house} \rule[-1ex]{0pt}{0pt}& 300\,911 \\
      \hline \rule{0pt}{2.5ex}\text{apartment} \rule[-1ex]{0pt}{0pt}& \\
      \hline
      \end{array}
    3. Using the information in Table 2, comment on the relative spread in the distribution of the sale prices of houses compared with apartments in this sample.   (1 mark)

      --- 3 WORK AREA LINES (style=lined) ---

  3. Table 3, below, shows the percentage of houses and apartments with prices in the given ranges. Some information is missing.
  4. Use the data from Table 1 to complete Table 3.

    --- 0 WORK AREA LINES (style=lined) ---

  5. Table 3 
Show Answers Only

a.    \(\text{Median}=920\,000\)

b.    \(\text{Variable is nominal}\)

c.i.  \(\text{Std deviation = \$346 466}\)

c.ii.  \(\text {Apartment sale prices have a higher spread (standard deviation) than the}\)

\(\text{spread of house sale prices.}\)

d.

\begin{array}{|c|c|}
\hline \hline \rule{0pt}{2.5ex}\ \ \ \text {House}(\%) \ \ \ \rule[-1ex]{0pt}{0pt}& \text {Apartment}(\%) \\
\hline \hline \rule{0pt}{2.5ex}0 \rule[-1ex]{0pt}{0pt}& 30 \\
\hline \hline \rule{0pt}{2.5ex}40 \rule[-1ex]{0pt}{0pt}& 50 \\
\hline \hline \rule{0pt}{2.5ex}60 \rule[-1ex]{0pt}{0pt}& 20 \\
\hline \hline \rule{0pt}{2.5ex}100 \rule[-1ex]{0pt}{0pt}& 100 \\
\hline
\end{array}

Show Worked Solution

a.    \(\text{Median}=\dfrac{10^{\text{th}}+11^{\text{th}}}{2}=920\,000\)
 

b.    \(\text{Type is qualitative and cannot be ordered}\)

\(\Rightarrow \ \text{Variable is nominal}\)
 

c.i.  \(\text{By calculator,}\)

\(\text{Std deviation = \$346 466}\)
 

c.ii.  \(\text {Apartment sale prices have a higher spread (standard deviation) than the}\)

\(\text{spread of house sale prices.}\)

♦ Mean mark (c.ii) 47%.

d.

\begin{array}{|c|c|}
\hline \hline \rule{0pt}{2.5ex}\ \ \ \text {House}(\%) \ \ \ \rule[-1ex]{0pt}{0pt}& \text {Apartment}(\%) \\
\hline \hline \rule{0pt}{2.5ex}0 \rule[-1ex]{0pt}{0pt}& 30 \\
\hline \hline \rule{0pt}{2.5ex}40 \rule[-1ex]{0pt}{0pt}& 50 \\
\hline \hline \rule{0pt}{2.5ex}60 \rule[-1ex]{0pt}{0pt}& 20 \\
\hline \hline \rule{0pt}{2.5ex}100 \rule[-1ex]{0pt}{0pt}& 100 \\
\hline
\end{array}

Filed Under: Summary Statistics Tagged With: Band 3, Band 4, Band 5, smc-468-10-Data Classification, smc-468-30-Std Dev, smc-468-40-Median Mode and Range

Networks, GEN1 2025 VCAA 34 MC

Consider the following graph.
 

The number of bridges in this graph is

  1. 1
  2. 2
  3. 3
  4. 4
Show Answers Only

\(C\)

Show Worked Solution

\(\text{Bridge – an edge, if removed, will disconnect the network.}\)

\(\text{The top 3 edges satisfy this test.}\)

\(\Rightarrow C\)

Filed Under: Basic Concepts Tagged With: Band 3, smc-626-10-Definitions

Matrices, GEN1 2025 VCAA 29 MC

The female population of an animal species has been divided into four age groups (1, 2, 3 and 4), with age group 1 being the youngest.

The age groups, birth rates and survival rates are presented in the life-cycle diagram below.


Which one of the following is a Leslie matrix that corresponds with this life-cycle diagram?
 

  1. \(\begin{bmatrix}0 & 2.1 & 4.6 & 1.8 \\ 0.9 & 0 & 0 & 0 \\ 0 & 0.7 & 0 & 0 \\ 0 & 0 & 0.2 & 0\end{bmatrix}\)
     
  2. \(\begin{bmatrix}0 & 0.9 & 0.7 & 0.2 \\ 2.1 & 0 & 0 & 0 \\ 0 & 4.6 & 0 & 0 \\ 0 & 0 & 1.8 & 0\end{bmatrix}\)
     
  3. \(\begin{bmatrix}2.1 & 4.6 & 1.8 & 0 \\ 0.9 & 0 & 0 & 0 \\ 0 & 0.7 & 0 & 0 \\ 0 & 0 & 0.2 & 0\end{bmatrix}\)
     
  4. \(\begin{bmatrix}2.1 & 4.6 & 1.8 & 0.8 \\ 0 & 0.9 & 0 & 0 \\ 0 & 0 & 0.7 & 0 \\ 0 & 0 & 0 & 0.2\end{bmatrix}\)
Show Answers Only

\(A\)

Show Worked Solution

\(\text{Age group 1 has no birthrate \(\Rightarrow  \ e_{11}=0\) (eliminate C, D)}\)

\(\text{Only option A has birth/death rates in the correct place.}\)

\(\Rightarrow A\)

Filed Under: Transition Matrices - Regular Tagged With: Band 3, smc-618-55-Leslie matrix, smc-618-62-4x4 Matrix

Matrices, GEN1 2025 VCAA 27 MC

Consider the matrix \(E\) where

\begin{align*}
E=\begin{bmatrix}
m & -9 \\
4 & n
\end{bmatrix}
\end{align*}

For the inverse of \(E\) to exist, the values of \(m\) and \(n\), respectively, cannot be

  1. \(3\) and \(12\)
  2. \(12\) and \(3\)
  3. \(3\) and \(-12\)
  4. \(-3\) and \(-12\)
Show Answers Only

\(C\)

Show Worked Solution

\(\text{Inverse exists}\ \ \Rightarrow\ \ \operatorname{det}\,E \neq 0\)

\(\operatorname{det}\,E=m \times n-(-9 \times 4)=mn+36\)

\(\text {Only option C gives} \ \ mn=-36\)

\(\Rightarrow C\)

Filed Under: Matrix Calculations Tagged With: Band 3, smc-616-50-Determinant

Matrices, GEN1 2025 VCAA 26 MC

Consider the matrices \(A, B\) and \(C\) where

\begin{align*}
A=\begin{bmatrix}
2 & 0 \\
1 & 6
\end{bmatrix}, B=\begin{bmatrix}
3 \\
5
\end{bmatrix} \ \text{and}\ \  C=AB.
\end{align*}

The calculation that correctly determines element \(c_{21}\) is

  1. \(2 \times 3+0 \times 5\)
  2. \(2 \times 5+3 \times 0\)
  3. \(1 \times 3+6 \times 5\)
  4. \(1 \times 5+6 \times 3\)
Show Answers Only

\(C\)

Show Worked Solution

\(AB=\begin{bmatrix}2 & 0 \\ 1 & 6\end{bmatrix}\begin{bmatrix}3 \\ 5\end{bmatrix}=\begin{bmatrix} 6 \\ 33\end{bmatrix}\)

\(c_{12}=1 \times 3+6 \times 5=33\)

\(\Rightarrow C\)

Filed Under: Matrix Calculations Tagged With: Band 3, smc-616-10-Basic Calculations

  • « Previous Page
  • 1
  • 2
  • 3
  • 4
  • …
  • 61
  • Next Page »

Copyright © 2014–2026 SmarterEd.com.au · Log in