How many solutions does the equation `|\ cos (2x)\ | = 1` have for `0 <= x <= 2 pi?`
(A) `1`
(B) `3`
(C) `4`
(D) `5`
Aussie Maths & Science Teachers: Save your time with SmarterEd
How many solutions does the equation `|\ cos (2x)\ | = 1` have for `0 <= x <= 2 pi?`
(A) `1`
(B) `3`
(C) `4`
(D) `5`
Two events, `A` and `B`, from a given event space, are such that `text(Pr)(A) = 1/5` and `text(Pr)(B) = 1/3`.
a. `text(Sketch Venn diagram:)`

| `:. text(Pr)(A′ ∩ B)` | `=text(Pr)(B) – text(Pr)(A ∩B)` |
| `=1/3 – 1/8` | |
| `=5/24` |
| b. |  |
`text(Mutually exclusive means)\ \ text(Pr)(A ∩ B)=0,`
`:. text(Pr)(A′ ∩ B) = 1/3`
Let `f: R -> R,\ \ f(x) = e^(2x) - 1`.


a. `text(Let)\ \ y = f(x)`
`text(For Inverse, swap)\ x ↔ y`
| `x` | `= e^(2y) – 1` |
| `x + 1` | `= e^(2y)` |
| `2y` | `= log_e(x + 1)` |
| `y` | `= 1/2 log_e(x + 1)` |
| `text(Domain)(f^(−1))` | `=\ text(Range)\ (f)` |
| `= (−1,∞)` |
`:. f^(−1)(x) = 1/2log_e(x + 1),quadx ∈ (−1,∞)`
b. `f(f^(−1)(x)) = x`
`text(Domain is)\ \ (-1, oo)`
| c. | `−f^(−1)(2x)` | `= −1/2 ln(2x + 1)` |
| `:. f(−f^(−1)(2x))` | `= e^(-log_e(2x + 1)) – 1` | |
| `=(2x+1)^-1 -1` | ||
| `= 1/(2x + 1) – 1` | ||
| `= (−2x)/(2x + 1)` |
The figure shown represents a wire frame where `ABCE` is a convex quadrilateral. The point `D` is on line segment `EC` with `AB = ED = 2\ text(cm)` and `BC = a\ text(cm)`, where `a` is a positive constant.
`/_ BAE = /_ CEA = pi/2`
Let `/_ CBD = theta` where `0 < theta < pi/2.`

a. `text(In)\ \ Delta BCD,`
| `cos theta` | `= (BD)/a` |
| `:. BD` | `= a cos theta` |
| `sin theta` | `= (CD)/a` |
| `:. CD` | `= a sin theta` |
| b. | `L` | `= 4 + 2 BD + CD + a` |
| `= 4 + 2a cos theta + a sin theta + a` | ||
| `= 4 + a + 2a cos theta + a sin theta` |
c. `text(Noting that)\ a\ text(is a constant:)`
`(dL)/(d theta)= – 2 a sin theta + a cos theta`
`text(When)\ \ (dL)/(d theta) = 0`,
| `- 2 a sin theta+ a cos theta` | `= 0` |
| `a cos theta` | `= 2 a sin theta` |
| `:. BD` | `= 2CD\ \ text{(using part (a))}` |
d. `text(SP’s when)\ \ (dL)/(d theta)=0,`
| `- 2 a sin theta+ a cos theta` | `= 0` |
| `sin theta` | `=1/2 cos theta` |
| `tan theta` | `=1/2` |

`text(If)\ \ tan theta=1/2,\ \ cos theta = 2/sqrt5,\ \ sin theta = 1/sqrt5`
| `L_(max)` | `= 4 + a + 2a cos theta + a sin theta` |
| `= 4 + (3 sqrt 5) + 2 (3 sqrt 5) (2/sqrt 5) + (3 sqrt 5) (1/sqrt 5)` | |
| `= 4 + 3 sqrt 5 + 12 + 3` | |
| `= 19 + 3 sqrt 5\ text(cm)` |
If the function `f` has the rule `f(x) = sqrt (x^2 - 9)` and the function `g` has the rule `g(x) = x + 5`
| a. | `f(g(x))` | `= sqrt {(x + 5)^2 – 9}` |
| `= sqrt (x^2 + 10x + 16)` | ||
| `= sqrt {(x + 2) (x + 8)}` |
`:. c = 2, d = 8 or c = 8, d = 2`
b. `text(Find)\ x\ text(such that:)`
`(x+2)(x+8) >= 0`

`(x + 2) (x + 8) >= 0\ \ text(when)`
`x <= -8 or x >= -2`
`:.\ text(Maximal domain is:)`
`x in (– oo, – 8] uu [– 2, oo)`
Let `f: R -> R,\ f(x) = e^(– mx) + 3x`, where `m` is a positive rational number.
A line intersects the coordinate axes at the points `U` and `V` with coordinates `(u, 0)` and `(0, v)`, respectively, where `u` and `v` are positive real numbers and `5/2 <= u <= 6`.

If `a` and `b` are non-zero real numbers, find the values of `a` and `b`. (3 marks)

a. `text(S)text{ince (2, 4) lies on parabola:}`
| `4` | `= a(2)^2 + b(2)` |
| `4` | `= 4a + 2b` |
| `2` | `= 2a + b\ …\ (1)` |
| `y` | `=ax^2+bx` |
| `dy/dx` | `=2ax+b` |
`text(At)\ \ x=2,`
| `m_(QU)` | `=m_(text(tang))` |
| `(4 – 0)/(2 – 6)` | `= 2a(2) + b` |
| `−1` | `= 4a + b\ …\ (2)` |
`text(Subtract)\ \ (2) – (1)`
`−3 = 2a`
`:. a = −3/2, b = 5`
| b.i. | `text(Solution 1)` |
`text(Using similar triangles:)`

`Delta VOU\ text(|||)\ Delta QPU`
| `v/4` | `= u/(u -2)` |
| `:. v` | `= (4u)/(u -2)` |
`text(Solution 2)`
| `m_(VQ)` | `=m_(UQ)` |
| `(v-4)/(0-2)` | `=(0-4)/(u-2)` |
| `v` | `=8/(u-2) + 4` |
| `=(8+4(u-2))/(u-2)` | |
| `=(4u)/(u-2)` |
| b.ii. | `text(Area)` | `= 1/2uv – 2 xx 4` |
| `= 1/2u((4u)/(u -2)) – 8` | ||
| `= (2u^2)/(u -2) – 8` |
`text(SP occurs when)\ \ (dA)/(du)=0,`
| `(4u(u – 2) – 2u^2)/((u – 2)^2)` | `= 0` |
| `2u^2 – 8u` | `= 0` |
| `2u(u – 4)` | `= 0` |
`u = 0quadtext(or)quadu = 4`
`:. u = 4, \ \ u ∈ [5/2,6]`
| `text(When)\ u=4,\ \ A` | `=(2 xx 4^2)/(4-2) – 8` |
| `= 8\ text(u²)` |
`text(Test areas at end points,)`
`text(When)\ u=5/2,\ A=17`
`text(When)\ u=6,\ A=10`
`:. A_(text(min))=8\ text{u² (when}\ u=4)`
b.iii. `text{As only one (local minimum) stationary point}`
`text(exists over)\ 5/2 <= u <= 6, text(the maximum area)`
`text(must occur at an endpoint.)`
`:. A_(text(max)) = 17\ text{u²}\ \ (text{when}\ u=5/2)`
The diagram below shows a point, `T`, on a circle. The circle has radius 2 and centre at the point `C` with coordinates `(2, 0)`. The angle `ECT` is `theta`, where `0 < theta <= pi/2`.

The diagram also shows the tangent to the circle at `T`. This tangent is perpendicular to `CT` and intersects the `x`-axis at point `X` and the `y`-axis at point `Y`.
Consider the function `f: R -> R,\ f(x) = 1/27 (2x - 1)^3 (6 - 3x) + 1.`
In the following, `f` is the function `f: R -> R,\ f(x) = 1/27 (ax - 1)^3 (b - 3x) + 1` where `a` and `b` are real constants.
Find the value of `p`. (3 marks)
a. `text(S.P. occurs when)\ \ f prime (x) = 0`
| `f(x)` | `=1/27 (2x – 1)^3 (6 – 3x) + 1` |
| `f′(x)` | `=- 1/9 (2x – 1)^2 (8x – 13) ` |
`text(Solve:)\ \ f′(x)=0\ \ text(for)\ x,`
`:. x = 1/2 or x = 13/8`
`text(Sketch the graph:)`

`=>\ text(Point of inflection at)\ \ x = 1/2`
`=>\ text(Local max at)\ \ x = 13/8`
b. `text(S.P. occurs when)\ \ f prime (x) = 0`
| `f(x)` | `=1/27 (ax – 1)^3 (b – 3x) + 1` |
| `f′(x)` | `=1/9 (ax – 1)^2 (ab+1-4ax)` |
`text(Solve:)\ \ f prime (x) = 0\ \ text(for)\ \ x,`
`:. x = (ab + 1)/(4a) or x = 1/a`
c. `text(For)\ \ x = (ab + 1)/(4a) or x = 1/a\ \ text(to exist,)`
`a != 0`
`:.\ text(No stationary points when)\ \ a = 0`
d. `text(If there is 1 S.P.,)`
| `(ab + 1)/(4a)` | `= 1/a` |
| `:. a` | `= 3/b` |
e. `text(The maximum number of SP’s for a quartic)`
`text(polynomial is 3. In the function given, one of)`
`text(the SP’s is a point of inflection.)`
`:.f(x)\ \ text(has a maximum of 2 SP’s.)`
f. `text(Solution 1)`
`text(SP’s occur at)\ \ (1,1) and (p,p),\ \ text(where,)`
`x = (ab + 1)/(4a) or x = 1/a`
`text(Consider)\ \ p=1/a,`
| `f(p)` | `=f(1/a)` |
|
`=1/27 (a*1/a-1)^3(b-3*1/a)+1=1` |
|
`f(p)=1,\ \ text(SP at)\ (1,1) and p!=1`
`=> p!=1/a`
`text(Consider)\ \ 1=1/a,`
`=> a=1 and b=4p-1`
`f(1)=1`
`f(p)=p`
| `1/27 (p-1)^3(4p-1-3p)+1` | `=p` |
| `1/27(p-1)^4-(p-1)` | `=0` |
| `(p-1)(1/27(p-1)^3-1)` | `=0` |
| `(p-1)^3` | `=27` |
| `p` | `=4` |
`text{Solution 2 [by CAS]}`
`text(Define)\ \ f(x) = 1/27 (x – 1)^3 (b – 3x) + 1`
`text(Solve:)\ \ f(p) = p, f prime (1) = 1 and f prime (p) = p\ \ text(for)\ \ p,`
`:. p = 4,\ \ \ (p != 1)`
An ancient civilisation buried its kings and queens in tombs in the shape of a square-based pyramid, `WABCD.`
The kings and queens were each buried in a pyramid with `WA = WB = WC = WD = 10\ text(m).`
Each of the isosceles triangle faces is congruent to each of the other triangular faces.
The base angle of each of these triangles is `x`, where `pi/4 < x < pi/2.`
Pyramid `WABCD` and a face of the pyramid, `WAB`, are shown here.

`Z` is the midpoint of `AB.`
Queen Hepzabah’s pyramid was designed so that it had the maximum possible volume.
Queen Hepzabah’s daughter, Queen Jepzibah, was also buried in a pyramid. It also had
`WA = WB = WC = WD = 10\ text(m.)`
The volume of Jepzibah’s pyramid is exactly one half of the volume of Queen Hepzabah’s pyramid. The volume of Queen Jepzibah’s pyramid is also given by the formula for `T` obtained in part d.
| a.i. | `cos x` | `= (1/2 AB)/10` |
| `:. AB` | `= 20 cos(x)` |
| ii. | `sin (x)` | `= (wz)/10` |
| `:. wz` | `= 10 sin (x)` |
| b. | `text(Area base)` | `= (20 cos (x))^2` |
| `= 400 cos^2(x)` | ||
| `4 xx text(Area)_Delta` | `= 4 xx (1/2 xx 20 cos (x) xx 10 sin (x))` | |
| `= 400 cos (x) sin (x)` |
| `:. S` | `= 400 cos^2 (x) + 400 cos (x) sin (x)` |
| `= 400 (cos^2 (x) + cos (x) sin (x))\ \ text(… as required.)` |
c. `text(Using)\ \ Delta WYZ,`

`text(Using Pythagoras,)`
| `WY` | `= sqrt (10^2 sin^2 (x) – 10^2 cos^2 (x))` |
| `= 10 sqrt (sin^2(x) – cos^2 (x))` |
| d. | `T` | `= 1/3 xx text(base) xx text(height)` |
| `= 1/3 xx (400 cos^2 (x)) xx (10 sqrt(sin^2 (x) – cos^2 (x)))` | ||
| `= 4000/3 sqrt (cos^4 (x) (sin^2 (x) – cos^2 (x))` |
`text(Using)\ \ sin^2 (x) = 1 – cos^2 (x),`
| `T` | `= 4000/3 sqrt (cos^4 (x) (1 – cos^2 (x) – cos^2 (x))` |
| `= 4000/3 sqrt (cos^4 (x) – 2 cos^6 (x))` |
e. `(dT)/(dx) = (8000 cos (x) sin (x) (3 cos^2 (x) – 1))/(3 sqrt(1 – 2 cos^2 (x)))`
`text(Stationary point when,)`
`(dT)/(dx) = 0\ \ text(for)\ \ x in (pi/4, pi/2)`
`:. x = cos^-1 (sqrt 3/3)`
| `:.T_max` | `=T(cos^-1 (sqrt 3/3))` |
| `= (4000 sqrt 3)/27\ \ text(m³)` |
f. `text(Solve)\ \ T(x) = (2000 sqrt 3)/27\ \ text(for)\ \ x in (pi/4, pi/2)`
`:. x = 0.81 or x = 1.23\ \ text{(2 d.p.)}`
An egg marketing company buys its eggs from farm A and farm B. Let `p` be the proportion of eggs that the company buys from farm A. The rest of the company’s eggs come from farm B. Each day, the eggs from both farms are taken to the company’s warehouse.
Assume that `3/5` of all eggs from farm A have white eggshells and `1/5` of all eggs from farm B have white eggshells.
Find, in terms of `p`, the probability that the egg has a white eggshell. (1 mark)
| a. |
|
| `text(Pr)(AW) + text(Pr)(BW)` | `= p xx 3/5 + (1-p) xx 1/5` |
| `=(3p)/5+1/5-p/5` | |
| `= (2p+1)/5` |
| b.i. | `text(Pr)(B | W)` | `= (text(Pr)(B ∩ W))/(text(Pr)(W))` |
| `= ((1 – p)/5)/((2p + 1)/5)` | ||
| `=(1-p)/5 xx 5/(2p+1)` | ||
| `= (1 – p)/(2p + 1)` |
| b.ii. | `text(Pr)(B | W)` | `= 3/10` |
| `(1 – p)/(2p + 1)` | `= 3/10` | |
| `10 – 10p` | `= 6p + 3` | |
| `7` | `= 16p` | |
| `:. p` | `= 7/16` |
A company anticipates that it will need to borrow $20 000 to pay for a new machine.
It expects to take out a reducing balance loan with interest calculated monthly at a rate of 10% per annum.
The loan will be fully repaid with 24 equal monthly instalments.
Determine the total amount of interest that will be paid on this loan.
Write your answer to the nearest dollar. (2 marks)
Khan decides to extend his home office and borrows $30 000 for building costs. Interest is charged on the loan at a rate of 9% per annum compounding monthly.
Assume Khan will pay only the interest on the loan at the end of each month.
Suppose the interest rate remains at 9% per annum compounding monthly and Khan pays $400 each month for five years.
Write your answer correct to the nearest dollar. (1 mark)
Khan decides to repay the $30 000 loan fully in equal monthly instalments over five years.
The interest rate is 9% per annum compounding monthly.
Gas is generally cheaper than petrol.
A car must run on petrol for some of the driving time.
Let `x` be the number of hours driving using gas
`y` be the number of hours driving using petrol
Inequalities 1 to 5 below represent the constraints on driving a car over a 24-hour period.
Explanations are given for Inequalities 3 and 4.
Inequality 1: `x ≥ 0`
Inequality 2: `y ≥ 0`
| Inequality 3: `y ≤ 1/2x` | The number of hours driving using petrol must not exceed half the number of hours driving using gas. |
| Inequality 4: `y ≥ 1/3x` | The number of hours driving using petrol must be at least one third the number of hours driving using gas. |
Inequality 5: `x + y ≤ 24`
The lines `x + y = 24` and `y = 1/2x` are drawn on the graph below.

On a particular day, the Goldsmiths plan to drive for 15 hours. They will use gas for 10 of these hours.
On another day, the Goldsmiths plan to drive for 24 hours.
Their car carries enough fuel to drive for 20 hours using gas and 7 hours using petrol.
Maximum = ___________ hours
Minimum = ___________ hours

a. `text(Inequality 5 means that the total hours driving)`
`text(with gas PLUS the total hours driving with petrol)`
`text(must be less than or equal to 24 hours.)`
b.i. & ii.
c. `text(If they drive for 10 hours on gas, 5 hours)`
`text(is driven on petrol.)`
`=>\ text{(10, 5) is in the feasible region.}`
`:.\ text(They comply with all constraints.)`
d. `text(Maximum = 18 hours)`
`text{(6 hours of petrol available)}`
`text(Minimum = 17 hours)`
`text{(7 hours of petrol is the highest available)}`
Michelle took a reducing balance loan for $15 000 to purchase her car. Interest is calculated monthly at a rate of 9.4% per annum.
In order to repay the loan Michelle will make a number of equal monthly payments of $350.
The final repayment will be less than $350.
Exactly one year after Michelle established her loan the interest rate increased to 9.7% per annum. Michelle decided to increase her monthly payment so that the loan would be fully paid in three years (exactly four years from the date the loan was established).
An event involves running for 10 km and cycling for 30 km.
Let `x` be the time taken (in minutes) to run 10 km
`y` be the time taken (in minutes) to cycle 30 km
Event organisers set constraints on the time taken, in minutes, to run and cycle during the event.
Inequalities 1 to 6 below represent all time constraints on the event.
| Inequality 1: `x ≥ 0` | Inequality 4: `y <= 150` |
| Inequality 2: `y ≥ 0` | Inequality 5: `y <= 1.5x` |
| Inequality 3: `x ≤ 120` | Inequality 6: `y >= 0.8x` |
The lines `y = 150` and `y = 0.8x` are drawn on the graph below.

One competitor, Jenny, took 100 minutes to complete the run.
Tiffany qualified for a prize.

a. `text(Inequality 3 means that the run must take)`
`text(120 minutes or less for any competitor.)`
b.i. & ii.
c. `text(From the graph, the possible cycling)`
`text(time range is between:)`
`text(80 – 150 minutes)`
d.i. `text(Constraint to win a prize is)`
`x + y <= 90`
`text(Maximum cycling time occurs)`
`text(when)\ y = 1.5x`
| `:. x + 1.5x` | `<= 90` |
| `2.5x` | `<= 90` |
| `x` | `<= 36` |
| `:. y_(text(max))` | `= 1.5 xx 36` |
| `= 54\ text(minutes)` |
d.ii. `text(Maximum run time occurs)`
`text(when)\ \ y = 0.8x`
| `:. x + 0.8x` | `<= 90` |
| `1.8x` | `<= 90` |
| `x` | `<= 50` |
`:. x_(text(max)) = 50\ text(minutes)`
In order to drought-proof the course, the golf club will borrow $200 000 to develop a water treatment facility.
The club will establish a reducing balance loan and pay interest monthly at the rate of 4.65% per annum.
How much of the principal will be left to pay after five years?
Write your answer in dollars correct to the nearest cent. (1 mark)
Write your answer in dollars correct to the nearest cent. (1 mark)
Calculate the new monthly repayment that will fully repay this amount in 60 equal instalments.
Write your answer in dollars correct to the nearest cent. (1 mark)
Cheapstar Airlines wishes to find the optimum number of flights per day on two of its most popular routes: Alberton to Bisley and Alberton to Crofton.
Let `x` be the number of flights per day from Alberton to Bisley
`y` be the number of flights per day from Alberton to Crofton
Table 4 shows the constraints on the number of flights per day and the number of crew per flight.

The lines `x + y = 10` and `3x + 5y = 41` are graphed below.

A profit of $1300 is made on each flight from Alberton to Bisley and a profit of $2100 is made on each flight from Alberton to Crofton.
Determine the maximum total profit that Cheapstar Airlines can make per day from these flights. (2 marks)

`P = 1300x + 2100y`
`text(Within the feasible area, profit is)`
`text(maximised at)\ (2,7).`
`:.\ text(Maximum profit)`
`= 1300 xx 2 + 2100 xx 7`
`= $17\ 300`
A home buyer takes out a reducing balance loan of $250 000 to purchase an apartment.
Interest on the loan will be calculated and paid monthly at the rate of 6.25% per annum.
Write your answer correct to the nearest dollar. (1 mark)
By making a lump sum payment after nine years, the home buyer is able to reduce the principal on his loan to $100 000. At this time, his monthly repayment changes to $1250. The interest rate remains at 6.25% per annum, compounding monthly.
Simple Saver is a simple interest investment in which interest is paid annually.
Growth Plus is a compound interest investment in which interest is paid annually.
Initially, $8000 is invested with both Simple Saver and Growth Plus.
The graph below shows the total value (principal and all interest earned) of each of these investments over a 15 year period.
The increase in the value of each investment over time is due to interest

Give a reason to justify your answer. (1 mark)
Find the amount of interest paid annually. (1 mark)
Write your answer as a percentage correct to one decimal place. (1 mark)
Let `x` be the number of Softsleep pillows that are sold each week and `y` be the number of Resteasy pillows that are sold each week.
A constraint on the number of pillows that can be sold each week is given by
Inequality 1: `x + y ≤ 150`
Each week, Anne sells at least 30 Softsleep pillows and at least `k` Resteasy pillows.
These constraints may be written as
Inequality 2: `x ≥ 30`
Inequality 3: `y ≥ k`
The graphs of `x + y = 150` and `y = k` are shown below.

What is the maximum possible weekly revenue that Anne can obtain? (2 marks)
Anne decides to sell a third type of pillow, the Snorestop.
She sells two Snorestop pillows for each Softsleep pillow sold. She cannot sell more than 150 pillows in total each week.
Inequality 4: `3x + y ≤ 150`
where `x` is the number of Softsleep pillows that are sold each week
and `y` is the number of Resteasy pillows that are sold each week. (1 mark)
Softsleep pillows sell for $65 each.
Resteasy pillows sell for $50 each.
Snorestop pillows sell for $55 each.

a. `text(Inequality 1 means that the combined number of Softsleep)`
`text(and Resteasy pillows must be less than 150.)`
b. `k = 45`
| c.i. & ii. |
|
d. `text(Checking revenue at boundary)`
`text(At)\ (30,120),`
`R = 65 xx 30 + 50 xx 120 = $7950`
`text(At)\ (105,45),`
`R = 65 xx 105 + 50 xx 45 = $9075`
`:. text(Maximum weekly revenue) = $9075`
e. `text(Let)\ z = text(number of SnoreStop pillows)`
`:. x + y + z <= 150,\ text(and)`
`z = 2x\ \ text{(given)}`
| `:. x + y + 2x` | `<= 150` |
| `3x + y` | `<= 150\ \ …text(as required)` |
| f. | `R` | `= 65x + 50y + 55(2x)` |
| `= 65x + 50y + 110x` | ||
| `= 175x + 50y` |
| g. |
|
`text(New intersection occurs at)\ (35,45)`
`:.\ text(Maximum weekly revenue)`
`= 175 xx 35 + 50 xx 45`
`= $8375`
A flying fox suspension wire begins at `V`, 12.5 metres above `T` as shown in the diagram below. It ends at `S`, 4.5 metres above `K`.

At `P`, the flying fox wire passes over `H`.
The horizontal distances `TH` and `HK` are 95 metres and 65 metres respectively.
Calculate the vertical distance, `PH`, in metres. (2 marks)

`Delta VAS\ text(|||)\ Delta PBS\ \ (A A A)`
| `(PB)/(BS)` | `= (VA)/(AS)` |
| `(PB)/(65)` | `= 8/160` |
| `:. PB` | `= (8 xx 65)/160` |
| `= 3.25\ text(m)` |
| `:. PH` | `= PB + BH` |
| `= 3.25 + 4.5` | |
| `= 7.75\ text(m)` |
`text(Alternative solution)`
`text(In)\ Delta VAS,`
| `tantheta` | `= 8/160` |
| `:. theta` | `= 2.862…^@` |
`text(In)\ DeltaPBS,`
| `tantheta` | `= (PB)/65` |
| `PB` | `= 65 xx tan2.862…^@` |
| `= 3.25\ text(m)` |
`:. PH = 3.25 + 4.5 = 7.75\ text(m)`
Tania takes out a reducing balance loan of $265 000 to pay for her house.
Her monthly repayments will be $1980.
Interest on the loan will be calculated and paid monthly at the rate of 7.62% per annum.
Immediately after Tania made her twelfth payment, the interest rate on her loan increased to 8.2% per annum, compounding monthly.
Tania decided to increase her monthly repayment so that the loan would be repaid in a further nineteen years.
Write your answer to the nearest cent. (1 mark)
Arthur invested $80 000 in a perpetuity that returns $1260 per quarter. Interest is calculated quarterly.
She will be paid $1260 per quarter from her investment.
After ten years, the balance of Martha’s investment will have reduced to $7000.
Determine the initial sum of money Martha invested.
Write your answer, correct to the nearest dollar. (1 mark)
An area of a club needs to be refurbished.
$40 000 is borrowed at an interest rate of 7.8% per annum.
Interest on the unpaid balance is charged to the loan account monthly.
Suppose the $40 000 loan is to be fully repaid in equal monthly instalments over five years.
Determine the monthly interest payment, correct to the nearest cent. (1 mark)
Euler’s formula, relating vertices, faces and edges, does not apply to which one of the following graphs?


`text(Euler’s formula only applies to)`
`text(planar graphs.)`
`text(Consider option)\ D,`

`text(Only option)\ D\ text(cannot be redrawn)`
`text(as a planar graph.)`
`rArr D`

The graph above has
`text(Redrawing the graph in planar form,)`
`text(the graph can be seen to have 6 faces.)`

`text(Alternatively, using Euler’s rule:)`
| `v + f` | `= e + 2` |
| `5 + f` | `= 9 + 2` |
| `:. f` | `= 6` |
`=> C`
The table below shows the time (in minutes) that each of four people, Aiden, Bing, Callum and Dee, would take to complete each of the tasks `U, V, W` and `X.`

If each person is allocated one task only, the minimum total time for this group of people to complete all four tasks is
A. `22\ text(minutes)`
B. `28\ text(minutes)`
C. `29\ text(minutes)`
D. `30\ text(minutes)`
E. `32\ text(minutes)`

`:.\ text(Minimum time)`
`= 9 + 5 + 6 + 8`
`= 28\ text(minutes)`
`=> B`
A project has 12 activities. The network below gives the time (in hours) that it takes to complete each activity.
The critical path for this project is
A. `ADGK`
B. `ADGIL`
C. `BHJL`
D. `CEGIL`
E. `CEHJL`
The network below shows the activities and their completion times (in hours) that are needed to complete a project.
The project is to be crashed by reducing the completion time of one activity only.
This will reduce the completion time of the project by a maximum of
A. 1 hour
B. 2 hours
C. 3 hours
D. 4 hours
E. 5 hours
Five soccer teams played each other once in a tournament. In each game there was a winner and a loser.
A table of one-step and two-step dominances was prepared to summarise the results.

One result in the tournament that must have occurred is that
A. Elephants defeated Bears.
B. Elephants defeated Aardvarks.
C. Aardvarks defeated Donkeys.
D. Donkeys defeated Bears.
E. Bears defeated Chimps.
An undirected connected graph has five vertices.
Three of these vertices are of even degree and two of these vertices are of odd degree.
One extra edge is added. It joins two of the existing vertices.
In the resulting graph, it is not possible to have five vertices that are
A. all of even degree.
B. all of equal degree.
C. one of even degree and four of odd degree.
D. three of even degree and two of odd degree.
E. four of even degree and one of odd degree.
`text(Consider an example of the graph)`
`text{described (below):}`

`A\ text(is possible – join)\ V\ text(and)\ Z`
`B\ text(is possible – join)\ V\ text(and)\ Z`
`C\ text(is possible – join)\ W\ text(and)\ Y`
`D\ text(is possible – join)\ V\ text(and)\ X`
`E\ text(is NOT possible)`
`=> E`
An Euler path through a network commences at vertex `P` and ends at vertex `Q`.
Consider the following five statements about this Euler path and network.
• In the network, there could be three vertices with degree equal to one.
• The path could have passed through an isolated vertex.
• The path could have included vertex `Q` more than once.
• The sum of the degrees of vertices `P` and `Q` could equal seven.
• The sum of the degrees of all vertices in the network could equal seven.
How many of these statements are true?
A. `0`
B. `1`
C. `2`
D. `3`
E. `4`
Andy, Brian and Caleb must complete three activities in total (K, L and M)
The table shows the person selected to complete each activity, the time it will take to complete the activity in minutes and the immediate predecessor for each activity.

All three activities must be completed in a total of 40 minutes.
The instant that Andy starts his activity, Caleb gets a telephone call.
The maximum time, in minutes, that Caleb can speak on the telephone before he must start his allocated activity is
A. 5
B. 13
C. 18
D. 24
E. 34
John, Ken and Lisa must work together to complete eight activities, `A, B, C, D, E, F, G` and `H`, in minimum time.
The directed network below shows the activities, their completion times in days, and the order in which they must be completed.

Several activities need special skills. Each of these activities may be completed only by a specified person.
With these conditions, the minimum number of days required to complete these eight activities is
A. 14
B. 17
C. 20
D. 21
E. 24

Eight activities, `A, B, C, D, E, F, G\ text(and)\ H`, must be completed for a project.
The graph above shows these activities and their usual duration in hours.
The duration of each activity can be reduced by one hour.
To complete this project in 16 hours, the minimum number of activities that must be reduced by one hour each is
A. 1
B. 2
C. 3
D. 4
E. 5
Vehicles from a town can drive onto a freeway along a network of one-way and two-way roads, as shown in the network diagram below.
The numbers indicate the maximum number of vehicles per hour that can travel along each road in this network. The arrows represent the permitted direction of travel.
One of the four dotted lines shown on the diagram is the minimum cut for this network.

The maximum number of vehicles per hour that can travel through this network from the town onto the freeway is
A. `310`
B. `330`
C. `350`
D. `370`
E. `390`

The graph above shows five activities, `A, B, C, D\ text(and)\ E`, that must be completed to finish a project.
The number next to each letter shows the completion time, in hours, for the activity.
Each of the five activities can have its completion time reduced by a maximum of one hour at a cost of $100 per hour.
The least cost to achieve the greatest reduction in the time taken to finish the project is
A. $100
B. $200
C. $300
D. $400
E. $500
A community centre is to be built on the new housing estate.
Nine activities have been identified for this building project.
The directed network below shows the activities and their completion times in weeks.

The builders of the community centre are able to speed up the project.
Some of the activities can be reduced in time at an additional cost.
The activities that can be reduced in time are `A`, `C`, `E`, `F` and `G`.
The owner of the estate is prepared to pay the additional cost to achieve early completion.
The cost of reducing the time of each activity is $5000 per week.
The maximum reduction in time for each one of the five activities, `A`, `C`, `E`, `F`, `G`, is 2 weeks.
As an attraction for young children, a miniature railway runs throughout the new housing estate.
The trains travel through stations that are represented by nodes on the directed network diagram below.
The number of seats available for children, between each pair of stations, is indicated beside the corresponding edge.

Cut 1, through the network, is shown in the diagram above.
On one particular train, 10 children set out from the West Terminal.
No new passengers board the train on the journey to the East Terminal.
a. `text(The capacity of Cut 1)`
`=14 + 8 + 13 + 8`
`= 43`
| b. |  |
| `text(Maximum seats)` | `=\ text(minimum cut)` |
| `= 6 + 7 + 9` | |
| `= 22` |
c. `text{The path (edge weights) of the train setting out with}`
`text(10 children starts with: 11 → 13.)`
`text(At the next station, a maximum of 7 seats are available)`
`text(which remain until the East Terminal.)`
`:.\ text(Maximum number of children arriving is 7.)`
A network of tracks connects two car parks in a festival venue to the exit, as shown in the directed graph below.
The arrows show the direction that cars can travel along each of the tracks and the numbers show each track’s capacity in cars per minute.
Five cuts are drawn on the diagram.
The maximum number of cars per minute that will reach the exit is given by the capacity of
A. Cut A
B. Cut B
C. Cut C
D. Cut D
E. Cut E
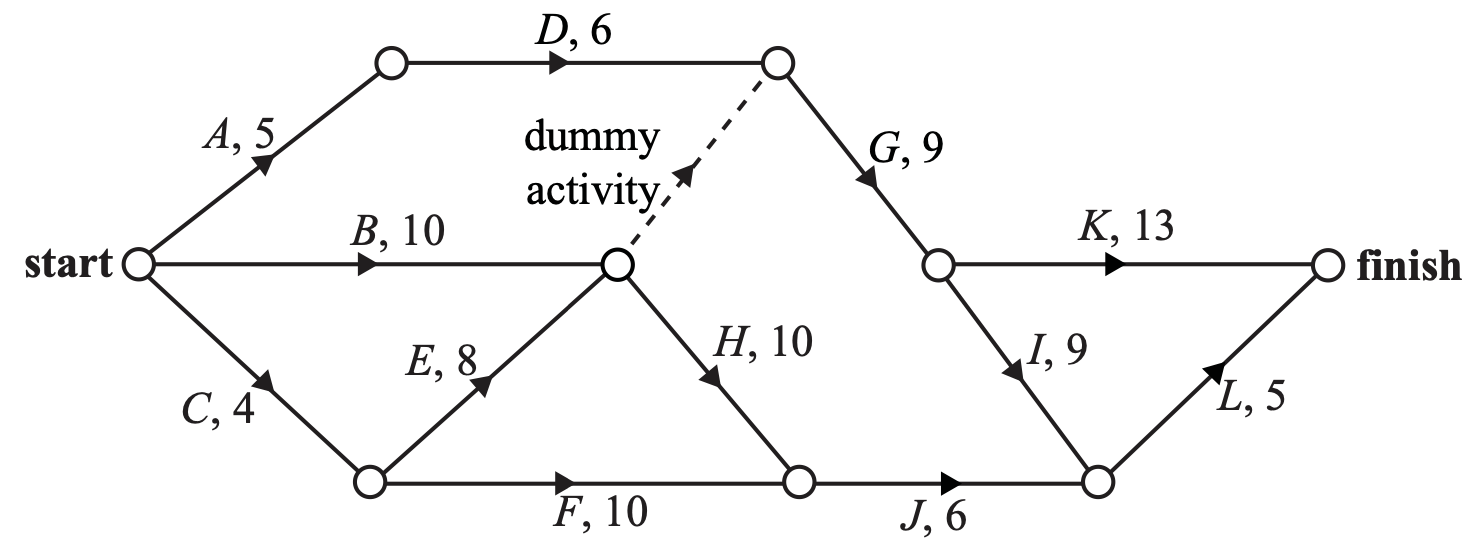
The rangers at the wildlife park restrict access to the walking tracks through areas where the animals breed.
The edges on the directed network diagram below represent one-way tracks through the breeding areas. The direction of travel on each track is shown by an arrow. The numbers on the edges indicate the maximum number of people who are permitted to walk along each track each day.

One day, all the available walking tracks will be used by students on a school excursion.
The students will start at `A` and walk in four separate groups to `D`.
Students must remain in the same groups throughout the walk.
Write down the path that group 1 will take. (1 mark)
Complete the six missing entries shaded in the table below. (2 marks)

| a. | `text(Maximum flow)` | `=\ text(minimum cut through)\ CD and ED` |
| `= 24 + 13` | ||
| `= 37` |
`:.\ text(A maximum of 37 people can walk)`
`text(to)\ D\ text(from)\ A.`
b.i. `A − B − E − C − D`
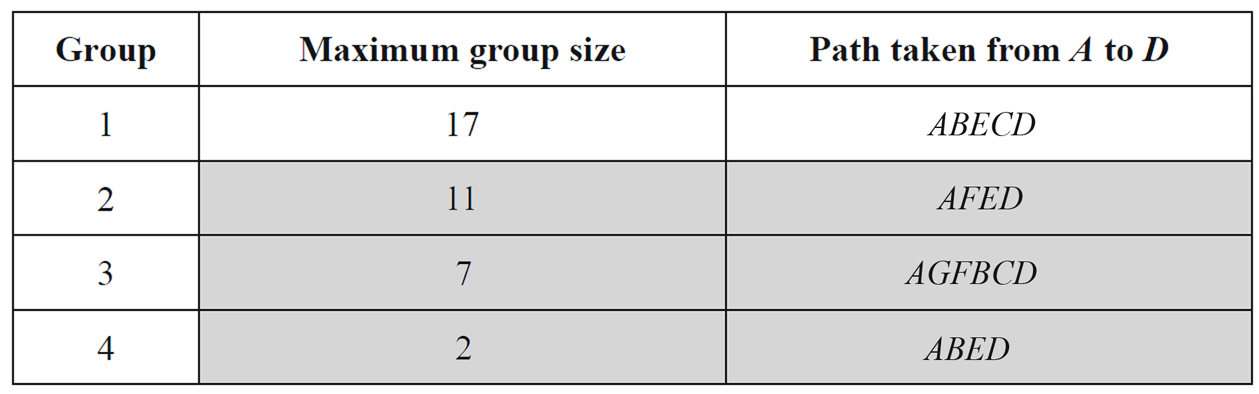
b.ii. `text(One solution using the second possible largest)`
`text(group of 11 students and two groups from the)`
`text(remaining 9 students is:)`
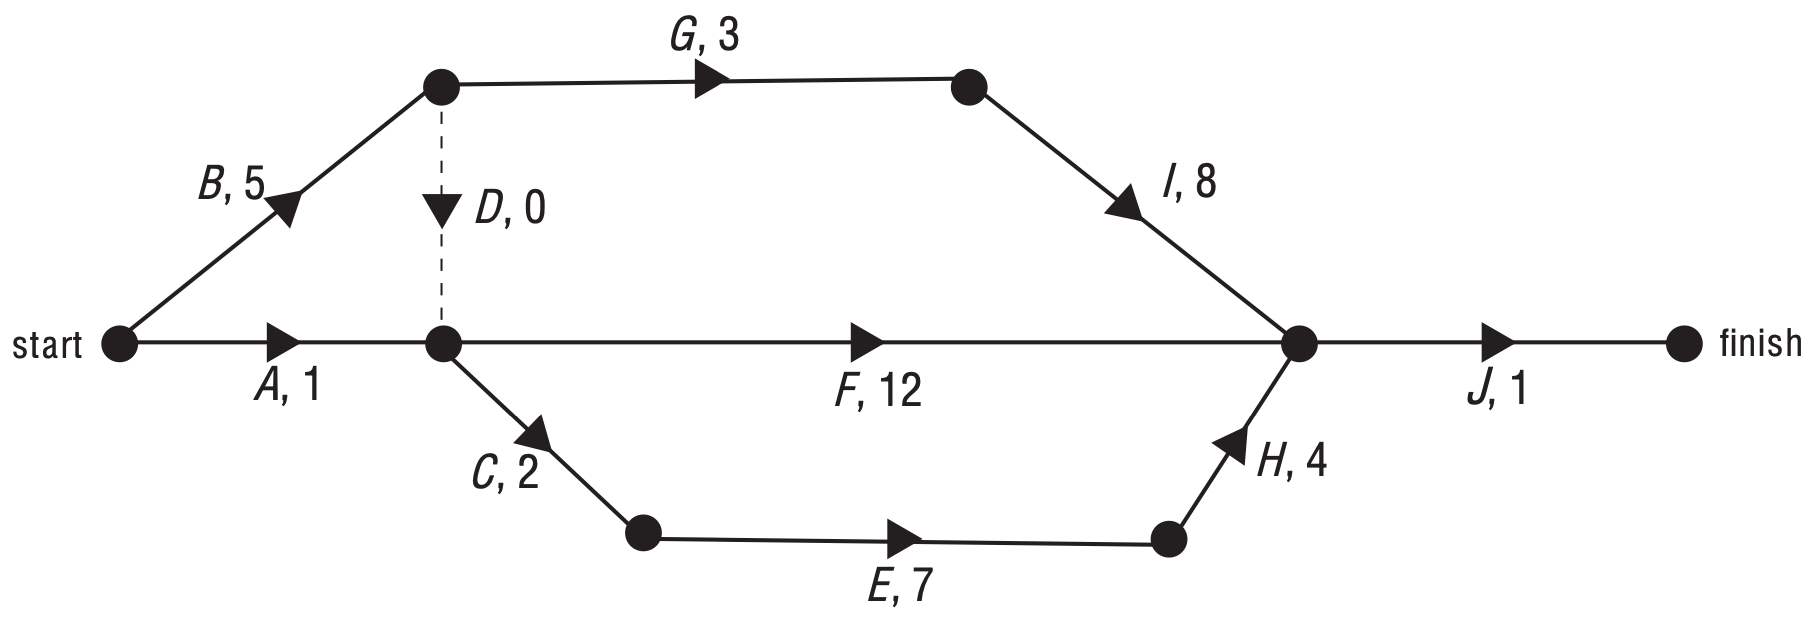
A walkway is to be built across the lake.
Eleven activities must be completed for this building project.
The directed network below shows the activities and their completion times in weeks.

Determine the longest float time, in weeks, on the supervisor’s list. (1 mark)
A twelfth activity, `L`, with duration three weeks, is to be added without altering the critical path.
Activity `L` has an earliest start time of four weeks and a latest start time of five weeks.
Determine the total overall time, in weeks, for the completion of this building project. (1 mark)

a. `7\ text(weeks)`
b. `BDFGIK`
c. `H\ text(or)\ J\ text(can be delayed for a maximum)`
`text(of 3 weeks.)`
| d. | |
e. `text(The new critical path is)\ BLEGIK.`
`L\ text(now takes 7 weeks.)`
`:.\ text(Time for completion)`
`= 4 + 7 + 1 + 5 + 2 + 6`
`= 25\ text(weeks)`
Stormwater enters a network of pipes at either Dunlop North (Source 1) or Dunlop South (Source 2) and flows into the ocean at either Outlet 1 or Outlet 2.
On the network diagram below, the pipes are represented by straight lines with arrows that indicate the direction of the flow of water. Water cannot flow through a pipe in the opposite direction.
The numbers next to the arrows represent the maximum rate, in kilolitres per minute, at which stormwater can flow through each pipe.

![]()
A length of pipe, show in bold on the network diagram below, has been damaged and will be replaced with a larger pipe.

What minimum rate of flow through the pipe, in kilolitres per minute, will achieve this? (1 mark)
a. `text(Storm water from Source 2 cannot reach Outlet 1)`
| b. |  |
`text(The minimum cut includes the 200 kL/min pipe from Source 1.)`
`:.\ text(Maximum rates are)`
`text(Outlet 1: 700 kL/min)`
`text(Outlet 2: 700 kL/min)`
c. `text(The next smallest cut in the lower pipe system is 800.)`
`:.\ text(The minimum flow through the new pipe that will achieve)`
`text(this is 300 kL/min.)`
To restore a vintage train, 13 activities need to be completed.
The network below shows these 13 activities and their completion times in hours.

The minimum time in which all 13 activities can be completed is 21 hours.
Just before they started restoring the train, the members of the club needed to add another activity, `X`, to the project.
Activity `X` will take seven hours to complete.
Activity `X` has no predecessors, but must be completed before activity `G` starts.
Activity `A` can be crashed by up to four hours at an additional cost of $90 per our.
This may reduce the minimum completion time for the project, including activity `X`.
Market researchers claim that the ideal number of bookshops (`x`), sports shoe shops (`y`) and music stores (`z`) for a shopping centre can be determined by solving the equations
`2x + y + z = 12`
`x-y+z=1`
`2y-z=6`
`qquad[(qquadqquadqquad),(),()][(quad),(quad),(quad)] = [(quad),(quad),(quad)]`
To study the life-and-death cycle of an insect population, a number of insect eggs (`E`), juvenile insects (`J`) and adult insects (`A`) are placed in a closed environment.
The initial state of this population can be described by the column matrix
`S_0 = [(400),(200),(100),(0)]{:(E),(J),(A),(D):}`
A row has been included in the state matrix to allow for insects and eggs that die (`D`).
In this population
In this population, the adult insects have been sterilised so that no new eggs are produced. In these circumstances, the life-and-death cycle of the insects can be modelled by the transition matrix
`{:(qquadqquadqquadqquadquadtext(this week)),((qquadqquadqquadE,quad\ J,quadA,\ D)),(T = [(0.4,0,0,0),(0.5,0.4,0,0),(0,0.5,0.8,0),(0.1,0.1,0.2,1)]{:(E),(J),(A),(D):}):}`
Assuming 30% of adults lay eggs each week, the population matrix after one week, `S_1`, is now given by
`qquad S_1 = TS_0 + BS_0`
where `B = [(0,0,0.3,0),(0,0,0,0),(0,0,0,0),(0,0,0,0)]` and `S_0 = [(400),(200),(100),(0)]{:(E),(J),(A),(D):}`
This pattern continues. The population matrix after `n` weeks, `S_n`, is given by
`qquad qquad qquad S_n = TS_(n - 1) + BS_(n - 1)`
A breeding program is started in the wetlands. It is aimed at establishing a colony of native ducks.
The matrix `W_0` displays the number of juvenile female ducks (`J`) and the number of adult female ducks (`A`) that are introduced to the wetlands at the start of the breeding program.
`W_0 = [(32),(64)]{:(J),(A):}`
The number of juvenile female ducks (`J`) and the number of adult female ducks (`A`) in the colony at the end of Year 1 of the breeding program is determined using the matrix equation
`W_1 = BW_0`
In this equation, `B` is the breeding matrix
`{:((qquadqquadqquad\ J,qquadA)),(B = [(0,2),(0.25,0.5)]{:(J),(A):}):}`
The number of juvenile female ducks (`J`) and the number of adult female ducks (`A`) in the colony at the end of Year `n` of the breeding program is determined using the matrix equation
`W_n = BW_(n - 1)`
The graph below is incomplete because the points for the end of Year 3 of the breeding program are missing.

Plot the corresponding points on the graph. (2 marks)
Write your answer correct to the nearest whole number. (1 mark)
The breeding matrix `B` assumes that, on average, each adult female duck lays and hatches two female eggs for each year of the breeding program.
If each adult female duck lays and hatches only one female egg each year, it is expected that the duck colony in the wetland will not be self-sustaining and will, in the long run, die out.
The matrix equation
`W_n = PW_(n - 1)`
with a different breeding matrix
`{:((qquadqquadqquad\ J,qquadA)),(P = [(0,1),(0.25,0.5)]{:(J),(A):}):}`
and the initial state matrix
`W_0 = [(32),(64)]{:(J),(A):}`
models this situation.
Changing the number of juvenile and adult female ducks at the start of the breeding program will also change the expected size of the colony.

a. `text(Total female ducks introduced)`
`= 32 + 64`
`= 96`
| b. | `W_1` | `= BW_0` |
| `= [(0,2),(0.25,0.5)][(32),(64)]` | ||
| `= [(128),(40)]` |
| c.i. | |
`W_n = BW_(n – 1)`
`W_2 = [(0,2),(0.25,0.5)][(128),(40)] = [(80),(52)]`
`W_3 = [(0,2),(0.25,0.5)][(80),(52)] = [(104),(46)]`
`:.\ text{Plot (3, 104) and (3, 46)}`
c.ii. `text(Consider)\ n = text(50 and 51,)`
`W_50 = [(0,2),(0.25,0.5)]^49[(32),(64)] = [(96),(48)]`
`W_51 = [(0,2),(0.25,0.5)]^50[(32),(64)] = [(96),(48)]`
`:.\ text(Total female ducks in the long term)`
`= 96 + 48`
`= 144`
d. `text(Initial female ducks = 96)`
`W_n = PW_(n – 1)`
`W_4 = [(0,1),(0.25,0.5)]^3[(32),(64)] = [(28),(33)]`
`:. 51\ text(ducks at end of year 4.)`
`W_5 = [(0,1),(0.25,0.5)]^4[(32),(64)] = [(23),(18.5)]`
`:. 41.5\ text(ducks at end of year 5.)`
`:.\ text{Numbers halve (drop below 48) in year 5.}`
| e. | `text(Let )` | `a = text(initial juvenile ducks)` |
| `b = text(initial adult ducks)` |
`text(Find)\ a\ text(and)\ b\ text(such that,)`
`[(0,1),(0.25,0.5)]^2[(a),(b)]= [(100),(50)]`
`[(0.25,0.5),(0.125,0.5)][(a),(b)] = [(100),(50)]`
| `:. [(a),(b)]` | `= [(0.25,0.5),(0.125,0.5)]^(-1)[(100),(50)]` |
| `= [(400),(0)]` |
`:. 400\ text(juvenile ducks and 0 adult ducks)`
`text(should be introduced.)`
10 000 trout eggs, 1000 baby trout and 800 adult trout are placed in a pond to establish a trout population.
In establishing this population
From year to year, this situation can be represented by the transition matrix `T`, where
`{:(qquadqquadqquadqquadqquadtext(this year)),((qquadqquadqquadE,quad\ B,quad\ A,\ D)),(T = [(0,0,0,0),(0.4,0,0,0),(0,0.25,0.5,0),(0.6,0.75,0.5,1)]):}{:(),(),(E),(B),(A),(D):}{:(),(),(qquadtext(next year)):}`
The initial state matrix for this trout population, `S_0`, can be written as
`S_0 = [(10\ 000),(1000),(800),(0)]{:(E),(B),(A),(D):}`
Let `S_n` represent the state matrix describing the trout population after `n` years.
The rule `S_n = T S_(n – 1)` that was used to describe the development of the trout in this pond does not take into account new eggs added to the population when the adult trout begin to breed.
The matrix describing the population after one year, `S_1`, is now given by the new rule
`S_1 = T S_0 + 500\ M\ S_0`
where `T=[(0,0,0,0),(0.40,0,0,0),(0,0.25,0.50,0),(0.60,0.75,0.50,1.0)], M=[(0,0,0.50,0),(0,0,0,0),(0,0,0,0),(0,0,0,0)]\ text(and)\ S_0=[(10\ 000),(1000),(800),(0)]`
This pattern continues so that the matrix describing the population after `n` years, `S_n`, is given by the rule
`S_n = T\ S_(n – 1) + 500\ M\ S_(n – 1)`
a.i. `text(60% of eggs die in 1st year,)`
`:.\ text(Eggs that die in year 1)`
`= 0.60 xx 10\ 000`
`= 6000`
| a.ii. |
|
| b.i. | `S_1` | `= TS_0` |
| `= [(0,0,0,0),(0.4,0,0,0),(0,0.25,0.5,0),(0.6,0.75,0.5,1)][(10\ 000),(1000),(800),(0)]` | ||
| `= [(0),(4000),(650),(7150)]` |
| b.ii. | `S_4` | `= T^4S_0` |
| `= [(0,0,0,0),(0.4,0,0,0),(0,0.25,0.5,0),(0.6,0.75,0.5,1)]^4[(10\ 000),(1000),(800),(0)]` | ||
| `= [(0),(0),(331.25),(11\ 468.75)]` |
`:. 331\ text(trout is the predicted population)`
`text(after 4 years.)`
| c.i. | `S_12 = T^12S_0 = [(0),(0),(1.29),(11\ 791)]` |
`S_13 = T^13S_0 = [(0),(0),(0.65),(11\ 799)]`
`:.\ text{It will take 13 years (when the trout}`
`text{population drops below 1).}`
| c.ii. | `S_1 = TS_0 = [(0),(4000),(650),(7150)]` |
`text(After 1 year, 650 adult trout.)`
`text(Similarly,)`
`S_2 = T^2S_0 = [(0),(0),(1325),(10\ 475)]`
`S_3 = T^3S_0 = [(0),(0),(662.5),(11\ 137.5)]`
`S_4 = T^4S_0 = [(0),(0),(331),(11\ 469)]`
`:.\ text(Largest number of adult trout = 1325.)`
| d. | `S_0 – S_1 = [(10\ 000),(1000),(800),(0)] – [(0),(4000),(650),(7150)] = [(10\ 000),(−3000),(150),(−7150)]` |
`:.\ text(Add 10 000 eggs, remove 3000 baby trout)`
`text(and add 150 adult trout to keep the)`
`text(population constant.)`
| e.i. | `S_1` | `= TS_0 + 500MS_0` |
| `= [(0),(4000),(650),(7150)] + 500 xx [(0,0,0.5,0),(0,0,0,0),(0,0,0,0),(0,0,0,0)][(10\ 000),(1000),(800),(0)]` | ||
| `= [(0),(4000),(650),(7150)] + 500[(400),(0),(0),(0)]` | ||
| `= [(200\ 000),(4000),(650),(7150)]` |
| e.ii. | `S_2` | `= TS_1 + 500MS_1` |
|
`= [(0,0,0,0),(0.4,0,0,0),(0,0.25,0.5,0),(0.6,0.75,0.5,1)][(200\ 000),(4000),(650),(7150)]` `+ 500 xx [(0,0,0.5,0),(0,0,0,0),(0,0,0,0),(0,0,0,0)][(200\ 000),(4000),(650),(7150)]` |
||
| `= [(162\ 500),(80\ 000),(1325),(130\ 475)]` |
A large population of mutton birds migrates each year to a remote island to nest and breed. There are four nesting sites on the island, A, B, C and D.
Researchers suggest that the following transition matrix can be used to predict the number of mutton birds nesting at each of the four sites in subsequent years. An equivalent transition diagram is also given.
| `{:(qquad qquad qquad qquad {:text(this year):}), (qquad qquad quad quad \ {:(A,\ \ B,\ \ C,\ D):}), (T = [(0.4, 0, 0.2, 0),(0.35, 1, 0.15, 0), (0.15, 0, 0.55, 0), (0.1, 0, 0.1, 1)] {:(A), (B), (C), (D):} quad {:text(next year):}):}` |  |
Part 1
Two thousand eight hundred mutton birds nest at site C in 2008.
Of these 2800 mutton birds, the number that nest at site A in 2009 is predicted to be
A. `560`
B. `980`
C. `1680`
D. `2800`
E. `3360`
Part 2
This transition matrix predicts that, in the long term, the mutton birds will
A. nest only at site A.
B. nest only at site B.
C. nest only at site A and C.
D. nest only at site B and D.
E. continue to nest at all four sites.
Part 3
Six thousand mutton birds nest at site B in 2008.
Assume that an equal number of mutton birds nested at each of the four sites in 2007. The same transition matrix applies.
The total number of mutton birds that nested on the island in 2007 was
A. `6000`
B. `8000`
C. `12\ 000`
D. `16\ 000`
E. `24\ 000`
Robbie completed a test of four multiple-choice questions.
Each question had four alternatives, A, B, C or D.
Robbie randomly guessed the answer to the first question.
He then determined his answers to the remaining three questions by following the transition matrix
`{:(qquad qquad qquad {:text(this question):}), (qquad qquad quad \ {:(A, B, C, D):}), (T = [(1,\ 0,\ 0,\ 0), (0,\ 0,\ 1,\ 0), (0,\ 0,\ 0,\ 1), (0,\ 1,\ 0,\ 0)] {:(A), (B), (C), (D):} quad {:text(next question):}):}`
Which of the following statements is true?
A. It is impossible for Robbie to give the same answer to all four questions.
B. Robbie would always give the same answer to the first and fourth questions
C. Robbie would always give the same answer to the second and third questions.
D. If Robbie answered A for question one, he would have answered B for question two
E. It is possible that Robbie gave the same answer to exactly three of the four questions.
Vince, Nev and Rani all service office equipment.
The matrix `T` shows the time that it takes (in minutes) for each of Vince (V), Nev (N) and Rani (R) to service a photocopier (P) a fax machine (F) and a scanner (S).
`{:(qquad qquad qquad {:(V,\ N,\ R):}), (T = [(12, 15, 14),(8, 7, 8), (20, 19, 17)] {:(P), (F), (S):}):}`
The matrix `U` below displays the number of photocopiers, fax machines and scanners to be serviced in three schools, Alton (A), Borton (B) and Carlon (C).
`{:(qquad qquad qquad {:(P, F, S):}), (U = [(5,\ 3,\ 2),(4,\ 4,\ 3), (6,\ 1,\ 2)] {:(A), (B), (C):}):}`
A matrix that displays the time that it would take each of Vince, Nev and Rani, working alone, to service the photocopiers, fax machines and scanners in each of the three schools is
| A. | `[(17, 18, 16), (12, 11, 11), (26, 20, 19)]` | B. | `[(204, 110, 97), (116, 60, 53), (278, 153, 131)]` |
| C. | `[(124, 134, 128), (140, 145, 139), (120, 135, 126)]` | D. | `[(7, 12, 12), (4, 3, 5), (14, 18, 15)]` |
| E. | `[(60, 15, 28), (32, 35, 24), (120, 19, 34)]` |
The total cost of one ice cream and three soft drinks at Catherine’s shop is $9.
The total cost of two ice creams and five soft drinks is $16.
Let `x` be the cost of an ice cream and `y` be the cost of a soft drink
The matrix `[(x), (y)]` is equal to
A. `[(1, 3), (2, 5)] [(x), (y)]`
B. `[(1, 3), (2, 5)] [(9), (16)]`
C. `[(1, 2), (3, 5)] [(9), (16)]`
D. `[(– 5, 2), (3, – 1)] [(9), (16)]`
E. `[(– 5, 3), (2, – 1)] [(9), (16)]`
`P, Q, R` and `S` are matrices such that the matrix product `P = QRS` is defined.
Matrix `Q` and matrix `S` are square, non-zero matrices for which `Q + S` is not defined.
Which one of the following matrix expressions is defined?
A. `R - S`
B. `Q + R`
C. `P^2`
D. `R^-1`
E. `P × S`
If `A = [(1,3), (6,4), (0,0)]` and the matrix product `XA = [(4,1),(1,4), (3,5)],` then the order matrix `X` is
A. `(2 xx 2)`
B. `(2 xx 3)`
C. `(3 xx 1)`
D. `(3 xx 2)`
E. `(3 xx 3)`
Matrix `A` is a 3 x 3 matrix. Seven of the elements in matrix `A` are zero.
Matrix `B` contains six elements, none of which are zero.
Assuming the matrix product `AB` is defined, the minimum number of zero elements in the product matrix `AB` is
A. `0`
B. `1`
C. `2`
D. `4`
E. `6`
A new model for the number of students in the school after each assessment takes into account the number of students who are expected to leave the school after each assessment.
After each assessment, students are classified as beginner (`B`), intermediate (`I`), advanced (`A`) or left the school (`L`).
Let matrix `T_2` be the transition matrix for this new model.
Matrix `T_2`, shown below, contains the percentages of students who are expected to change their ability level or leave the school after each assessment.
`{:(qquadqquadqquadquadtext(before assessment)),(qquadqquadqquadquad{:(B,\ qquadI,qquadA,quadL):}),(T_2 = [(0.30,0,0,0),(0.40,0.70,0,0),(0.05,0.20,0.75,0),(0.25,0.10,0.25,1)]{:(B),(I),(A),(L):}qquadtext(after assessment)):}`

The number of students at each level, immediately before the first assessment of the year, is shown in matrix `R_0` below.
`R_0 = [(20),(60),(40),(0)]{:(B),(I),(A),(L):}`
Matrix `T_2`, repeated below, contains the percentages of students who are expected to change their ability level or leave the school after each assessment.
`{:(qquadqquadqquadquadtext(before assessment)),(qquadqquadqquadquad{:(B,\ qquadI,qquadA,quadL):}),(T_2 = [(0.30,0,0,0),(0.40,0.70,0,0),(0.05,0.20,0.75,0),(0.25,0.10,0.25,1)]{:(B),(I),(A),(L):}qquadtext(after assessment)):}`
Write your answer correct to the nearest whole number. (1 mark)
Another model for the number of students in the school after each assessment takes into account the number of students who are expected to join the school after each assessment.
Let `R_n` be the state matrix that contains the number of students in the school immediately after `n` assessments.
Let `V` be the matrix that contains the number of students who join the school after each assessment.
Matrix `V` is shown below.
`V = [(4),(2),(3),(0)]{:(B),(I),(A),(L):}`
The expected number of students in the school after `n` assessments can be determined using the matrix equation
`R_(n + 1) = T_2 xx R_n + V`
where
`R_0 = [(20),(60),(40),(0)]{:(B),(I),(A),(L):}`
How many are expected to become advanced-level students after the next assessment?
Write your answer correct to the nearest whole number. (2 marks)

| a. | |
| b. | `T_2 R_0` | `= [(0.3, 0, 0, 0), (0.4, 0.7, 0, 0), (0.05, 0.2, 0.75, 0), (0.25, 0.1, 0.25, 1)] [(20), (60), (40), (0)]` |
| `= [(6), (50), (43), (21)]` |
`:.\ text(Percentage that leave school)`
`= 21/120`
`= 17.5 text(%)`
c. `text(After 2 assessments,)`
| `(T_2)^2 R_0` | `= [(0.3, 0, 0, 0), (0.4, 0.7, 0, 0), (0.05, 0.2, 0.75, 0), (0.25, 0.1, 0.25, 1)]^2 [(20), (60), (40), (0)]` |
| `=[(1.8), (37.4), (42.55), (38.25)]` |
`:.\ text(43 advanced-level students expected to remain.)`
d. `text(After 4 assessments,)`
`(T_2)^4 R_0\ text(shows 54 students left)`
`text(After 5 assessments,)`
`(T_2)^5 R_0\ text(shows 43 students left.)`
`:.\ text(Numbers drop below 50 after 5 assessments.)`
| e. | `R_1` | `= T_2 R_0 + V` |
| `= [(6), (50), (43), (21)] + [(4), (2), (3), (0)] = [(10), (52), (46), (21)]` | ||
| `R_2` | `= [(0.30, 0, 0, 0), (0.40, 0.70, 0, 0), (0.05, 0.20, 0.75, 0), (0.25, 0.10, 0.25, 1)] [(10), (52), (46), (21)] + [(4), (2), (3), (0)] = [(7), (42.4), (48.4), (40.2)]` | |
| `R_3` | `= [(0.30, 0, 0, 0), (0.40, 0.70, 0, 0), (0.05, 0.20, 0.75, 0), (0.25, 0.10, 0.25, 1)] [(7), (42.4), (48.4), (40.2)] + [(4), (2), (3), (0)] = [(6.1), (34.48), (48.13), (58.29)]` |
`:.\ text(After 3 assessments, the number expected to)`
`text(move from Intermediate to Advanced)`
`= 20text(%) xx 34.48`
`= 6.896`
`= 7\ text{students (nearest whole)}`
When a new industrial site was established at the beginning of 2011, there were 350 staff at the site.
The staff comprised 100 apprentices (`A`), 200 operators (`O`) and 50 professionals (`P`).
At the beginning of each year, staff can choose to stay in the same job, move to a different job at the site or leave the site (`L`).
The number of staff in each category at the beginning of 2011 is given in the matrix
`S_2011 = [(100), (200), (50), (0)]{:(A), (O), (P), (L):}`
The transition diagram below shows the way in which staff are expected to change their jobs at the site each year.

The information in the transition diagram has been used to write the transition matrix `T`.
`{:(qquad qquad qquad qquad qquad qquad text(this year)),((qquad qquad qquad\ A, qquad O, qquad P, qquad L)),(T = [(0.70, 0, 0, 0),(0.10, 0.80, 0, 0), (0, 0.10, 0.90, 0), (0.20, 0.10, 0.10, 1.00)]):} {:(), (), (A), (O), (P), (L):} {:(), (), (qquad text(next year)):}`
If staff at the site continue to change their jobs in this way, the matrix `S_n` will contain the number of apprentices (`A`), operators (`O`), professionals (`P`) and staff who leave the site (`L`) at the beginning of the `n`th year.
Suppose the manager decides to bring 30 new apprentices, 20 new operators and 10 new professionals to the site at the beginning of each year.
The matrix `S_(n + 1)` will then be given by
`S_(n + 1) = T S_n + A` where `S_2011 = [(100), (200), (50), (0)] {:(A), (O), (P), (L):}` and `A = [(30), (20), (10), (0)] {:(A), (O), (P), (L):}`
A company repairs phones and laptops.
Let `x` be the number of phones repaired each day
`y` be the number of laptops repaired each day.
It takes 35 minutes to repair a phone and 50 minutes to repair a laptop.
The constraints on the company are as follows.
Constraint 1 `x ≥ 0`
Constraint 2 `y ≥ 0`
Constraint 3 `35x + 50y ≤ 1750`
Constraint 4 `y ≤ 4/5 x`
Use this constraint to complete the following sentence.
For every ten phones repaired, at most _______ laptops may be repaired. (1 mark)
The line `y = 4/5 x` is drawn on the graph below.

The profit from repairing one phone is $60 and the profit from repairing one laptop is $100.
a. `text(Constraint 3 means that the maximum time)`
`text(available to repair phones and laptops is 1750)`
`text(minutes on any given day.)`
b. `y <= 4/5x`
`text(When)\ x = 10,`
| `y` | `<= 4/5 xx 10` |
| `<= 8` |
`:.\ text(At most, 8 laptops may be repaired)`
| c. |  |
d. `text(From the graph, the highest number)`
`text(of laptops below the intersection)`
`text{(in the feasible region) is 18.}`
e. `text(When)\ y = 9,\ text(constraint 3 requires)`
| `35x + (50 xx 9)` | `<= 1750` |
| `35x` | `<= 1300` |
| `:. x` | `<= 37.14…` |
`:.\ text(The maximum number of phones = 37.)`
f.i. `text(Profit)\ = 60x + 100y`
`text(In the feasible region, maximum)`
`text(profits occur at the intersection.)`
`:. 18\ text(laptops)`
`text(When)\ y = 18,\ text(constraint 3 requires)`
| `35x + (50 xx 18)` | `<= 1750` |
| `35x` | `<= 850` |
| `x` | `<= 24.28…` |
`:. text(Maximum profit occurs at)\ (24,18)`
f.ii. `text(Maximum daily profit)`
`= 60 xx 24 + 100 xx 18`
`= $3240`


